HAL Id: hal-00301660
https://hal.archives-ouvertes.fr/hal-00301660
Submitted on 27 Jun 2006HAL is a multi-disciplinary open access
archive for the deposit and dissemination of sci-entific research documents, whether they are pub-lished or not. The documents may come from teaching and research institutions in France or abroad, or from public or private research centers.
L’archive ouverte pluridisciplinaire HAL, est destinée au dépôt et à la diffusion de documents scientifiques de niveau recherche, publiés ou non, émanant des établissements d’enseignement et de recherche français ou étrangers, des laboratoires publics ou privés.
Technical Note: Anthropogenic and natural offline
emissions and the online EMissions and dry DEPosition
submodel EMDEP of the Modular Earth Submodel
system (MESSy)
L. N. Ganzeveld, J. A. van Aardenne, T. M. Butler, M. G. Lawrence, S. M.
Metzger, P. Stier, P. Zimmermann, J. Lelieveld
To cite this version:
L. N. Ganzeveld, J. A. van Aardenne, T. M. Butler, M. G. Lawrence, S. M. Metzger, et al.. Technical Note: Anthropogenic and natural offline emissions and the online EMissions and dry DEPosition submodel EMDEP of the Modular Earth Submodel system (MESSy). Atmospheric Chemistry and Physics Discussions, European Geosciences Union, 2006, 6 (3), pp.5457-5483. �hal-00301660�
ACPD
6, 5457–5483, 2006Offline and online emissions and dry deposition in MESSy L. N. Ganzeveld et al. Title Page Abstract Introduction Conclusions References Tables Figures J I J I Back Close
Full Screen / Esc
Printer-friendly Version Interactive Discussion
EGU
Atmos. Chem. Phys. Discuss., 6, 5457–5483, 2006 www.atmos-chem-phys-discuss.net/6/5457/2006/ © Author(s) 2006. This work is licensed
under a Creative Commons License.
Atmospheric Chemistry and Physics Discussions
Technical Note: Anthropogenic and
natural o
ffline emissions and the online
EMissions and dry DEPosition submodel
EMDEP of the Modular Earth Submodel
system (MESSy)
L. N. Ganzeveld1, J. A. van Aardenne2, T. M. Butler1, M. G. Lawrence1, S. M. Metzger1, P. Stier3, P. Zimmermann1, and J. Lelieveld1
1
Max-Planck Institute for Chemistry, Department of Atmospheric Chemistry, Joachim-Becher-Weg 27, 55128, Mainz, P.O. Box 3060, 55020 Mainz, Germany
2
Joint Research Centre, Institute for Environment and Sustainability, Climate Change Unit, Ispra (Va), Italy
3
California Institute of Technology, Pasadena, CA, USA
Received: 19 April 2006 – Accepted: 18 May 2006 – Published: 27 June 2006 Correspondence to: L. N. Ganzeveld ([email protected])
ACPD
6, 5457–5483, 2006Offline and online emissions and dry deposition in MESSy L. N. Ganzeveld et al. Title Page Abstract Introduction Conclusions References Tables Figures J I J I Back Close
Full Screen / Esc
Printer-friendly Version Interactive Discussion
EGU Abstract
We present the online calculated Earth’s surface trace gas and aerosol emissions and dry deposition in the Modular Earth Submodel System (MESSy) submodel EMDEP as well as the currently applied anthropogenic and natural emissions inventories. These inventories, being read-in by the MESSy submodel OFFLEM, include the industrial,
5
fossil fuel, agricultural and biomass burning emissions considering emission height profiles as a function of the source category based on the EDGAR v3.2 fast track 2000 inventory. Terrestrial and marine emissions of a selection of trace gases and aerosols are calculated online in EMDEP using climate model parameters such as wind speed, temperature and land cover and land use parameters. The online dry deposition
calcu-10
lation includes gases and aerosols, where the default selection for the trace gases for the dry deposition scheme can be easily extended using a commonly applied method based on trace gas solubility and reactivity. In general, the simulated global annual emissions agree with previously reported inventories, although differences exist, partly dependent on the applied model resolution. A high sensitivity of the simulated dry
15
deposition to the applied emission height profiles stresses the importance of a real-istic and consistent representation of the spatial and temporal variability in surface exchange processes in Earth system models.
1 Introduction
A key aspect of comprehensive models to study atmospheric chemistry and its role
20
in the Earth system is the treatment of the surface boundary conditions, i.e., anthro-pogenic and natural emissions and dry deposition. The representation of these emis-sions and dry deposition is not only important for simulating realistic global burdens but also for the model evaluation in comparison to near-surface observations, which largely reflect the role of the temporal and spatial variability in surface exchanges and
25
ACPD
6, 5457–5483, 2006Offline and online emissions and dry deposition in MESSy L. N. Ganzeveld et al. Title Page Abstract Introduction Conclusions References Tables Figures J I J I Back Close
Full Screen / Esc
Printer-friendly Version Interactive Discussion
EGU
processes should realistically incorporate some of the major drivers that determine this variability such as land cover and meteorological, biogeochemical and hydrolog-ical parameters. Here we provide a description of state-of-the-art representations of anthropogenic and natural emissions and dry deposition of reactive trace gases and aerosols in the Modular Earth Submodel System (MESSy, see J ¨ockel et al., 2005)
sub-5
model EMDEP. This includes an anthropogenic and natural offline emission inventory (hereafter referred to as offline emission inventory), distributed with the first official re-lease of MESSy (version 1.1), and the online calculated emissions and dry deposition surface fluxes with MESSy’s submodel EMDEP. The later is the extensive development and testing model for the representation of online emissions, dry deposition and canopy
10
interactions (coupled representation of in-canopy dry deposition, biogenic emissions, turbulence and chemistry) (Ganzeveld et al., 2002) in MESSy.
The dry deposition and online emission routines of EMDEP actually provided the basis for the development of a distribution submodel for online emissions (ONLEM, Kerkweg et al., 2006a) and one for dry deposition (DRYDEP, Kerkweg et al., 2006b1).
15
The processing of the tracer emission fluxes of the offline emission inventory to update the atmospheric tracer concentrations is being done with MESSy’s submodel OFFLEM (Kerkweg et al., 2006a).
More details about the emissions included in the offline emission inventory are pre-sented in Sect. 2 followed by a description in Sect. 3 of some of the fundamental
20
concepts of online calculated emissions and dry deposition. In Sect. 4 we present the online emission budgets simulated with EMDEP with the major drivers of these emissions, e.g., surface temperature, wind speed, precipitation, being provided by the climate model ECHAM5 (Roeckner et al., 2003). To indicate the sensitivity of the on-line emissions to differences in the simulation of major drivers as a function of
ap-25
1
Kerkweg, A., Buchholz, J., Ganzeveld, L., Pozzer, A., Tost, H., and J ¨ockel, P.: Technical Note: An implementation of the dry removal processes DRY DEPosition and SEDImentation in the Modular Earth Submodel System (MESSy), Atmos. Chem. Phys. Discuss., submitted, 2006b.
ACPD
6, 5457–5483, 2006Offline and online emissions and dry deposition in MESSy L. N. Ganzeveld et al. Title Page Abstract Introduction Conclusions References Tables Figures J I J I Back Close
Full Screen / Esc
Printer-friendly Version Interactive Discussion
EGU
plied GCM’s model resolution, we present the calculated budgets for three resolutions. Moreover, we present some first analysis of the sensitivity of dry deposition calcula-tions to the inclusion of emissions heights in the offline emission inventory, followed by a summary and conclusions.
2 Offline emission inventory
5
The representation of surface emissions in EMDEP includes a selection of terrestrial and marine natural emissions which are calculated online whereas technologically driven emissions and a selection of natural emissions, some with an anthropogenic component such as biomass burning, are included in preprocessed input files, referred to as offline emissions, and read in for use in MESSy using the submodel OFFLEM.
10
These offline sources include a large selection of technological-, agricultural, biomass burning- and terrestrial biogenic and oceanic emissions of mostly trace gases. For the technological, agricultural and biomass burning emissions we use the EDGAR (Emission Database for Global Atmospheric Research, http://www.mnp.nl/edgar/) v3.2 fast-track update of the emissions for the year 2000 (hereafter referred to as
15
EDGARv3.2-FT2000). For more details we refer to Olivier et al. (2005), Van Aardenne et al. (2005) and Van der Werf et al. (2003), discussing here some specific features relevant to the compiled inventory.
The EDGARv3.2-FT2000 dataset differs from the EDGARv3.2 dataset represent-ing the 1995 emissions such that it is based on the activity data for the year 2000
20
applying the same emission factors as in EDGARv3.2 except for countries for which new information about emission control measures has become available. A new fea-ture of the offline emissions is that emission height profiles have been assigned to the different EDGAR source categories distinguishing six effective emission heights (45, 140, 240, 400, 600 and 800 m a.g.l.) based on profiles used in the EMEP
(Co-25
operative Programme on the Long-Range Transmission of Air Pollutants in Europe,
ACPD
6, 5457–5483, 2006Offline and online emissions and dry deposition in MESSy L. N. Ganzeveld et al. Title Page Abstract Introduction Conclusions References Tables Figures J I J I Back Close
Full Screen / Esc
Printer-friendly Version Interactive Discussion
EGU
we arbitrarily assumed that the effective emission height is less than 45 m, except of ship emissions for which we assume that a substantial fraction is emitted at a higher altitude of 145 m.
The emission profiles are shown in Table 1. The sensitivity of simulated atmospheric chemistry to biomass burning emission height profiles, as recommended by van
Aar-5
denne et al. (2005), considering a larger vertical extent of emission heights compared to the domain described above, is currently being tested and will be included in a future release of the offline emission inventory.
The EDGARv3.2-FT2000 provides only emissions of total non-methane volatile or-ganic compounds (NMVOC). To obtain the emissions of each individual NMVOC
rep-10
resented in the offline emission inventory, this total mass of NMVOC is first converted to a mass of carbon using the ratios from Table 4.7(b) of the IPCC Third Assessment Report. This total mass of carbon is then partitioned between the NMVOC species using the speciation ratios from von Kuhlmann et al. (2003) which in turn are for an-thropogenic emissions based on the EDGAR v2.0 inventory and for biomass burning
15
and biofuel emissions based on Andrea and Merlet (2001) for biomass burning and biofuel emissions.
The terrestrial biogenic and oceanic emissions of NMVOC’s are similar to the emis-sions in the inventory applied in the offline chemistry and tracer transport model MATCH-MPIC (Von Kuhlmann et al., 2003; Lawrence et al., 1999, hereafter MATCH).
20
Although the biogenic emissions of terpenes and other reactive volatile organic com-pounds (ORVOC’s) are calculated online (see Sect. 3.1), which could be used to pro-vide the first-order estimate of biogenic CO and acetone emissions, we use the Guen-ther et al. (1995) global annual estimates of terpene and ORVOC emissions to arrive at the biogenic emission budgets of CO, acetone, methanol, alkanes, alkenes, aldehydes
25
and acids. Oceanic emissions of CO and NMVOC’s are also included. In addition, we apply the Bouwman (1997) dataset for ammonia (NH3) emissions, made available through the Global Emission Inventory Activity (GEIA, Guenther et al., 1995).
ACPD
6, 5457–5483, 2006Offline and online emissions and dry deposition in MESSy L. N. Ganzeveld et al. Title Page Abstract Introduction Conclusions References Tables Figures J I J I Back Close
Full Screen / Esc
Printer-friendly Version Interactive Discussion
EGU
we present in Table 2 the global annual technological, biofuel, biomass burning and total emissions (with the biogenic component). Note that biomass burning emissions refer to the year 2000, based on average activity data over the period 1997–2001. For specific years within this period the actual biomass burning estimates are now available as well but have not yet been applied here. Also shown are the budgets of a
selec-5
tion of offline terrestrial and oceanic biogenic emissions, including CO and NMVOC’s, based on the MATCH model emission dataset, about which more details can be found in von Kuhlmann et al. (2003). The MATCH emission budgets are based on the 1990 EDGARv2 inventory for technological emissions and the biomass burning inventory by Galanter et al. (2000). Consequently, the comparison of global emission budgets
in-10
dicates about the differences between the EDGARv2 and v3.2-F2000 as well as the biomass burning emissions. The largest differences occur in the NOx, CO and C4H10 global emissions, with changes (relative to the MATCH inventory) of +33, –13 and +54%. The significantly larger total NOx source is mostly due to larger ship
emis-sions in EDGARv3.2-FT2000 (Eyring et al, 2005) compared to EDGARv2 and larger
15
biomass burning emissions, both about 4 TgN yr−1 larger compared to the MATCH in-ventory. These differences do not only reflect differences in inventory compilation but obviously also differences between 1990 and 2000. The smaller CO emissions in the presented inventory compared to the MATCH inventory are mostly due to an about 50 TgC yr−1 smaller technological emission flux of the EDGARv3.2-FT2000 inventory
20
compared to EDGARv2 whereas EDGARv3.2-FT2000 includes an about 20 TgC yr−1 larger C4H10emission flux compared to EDGARv2. The latter difference is explained by EDGARv3.2-FT2000 technological NMVOC emissions being about 30 TgC yr−1larger compared to EDGARv2 for an NMVOC speciation such that C4H10 makes up 70% of the technological NMVOC emissions. The biogenic NH3 emission reflects the
agricul-25
ACPD
6, 5457–5483, 2006Offline and online emissions and dry deposition in MESSy L. N. Ganzeveld et al. Title Page Abstract Introduction Conclusions References Tables Figures J I J I Back Close
Full Screen / Esc
Printer-friendly Version Interactive Discussion
EGU 3 Online emissions and dry deposition in EMDEP
3.1 Online emissions
For more details concerning the description of the emissions mostly relevant to aerosol modeling, including the emissions of marine DiMethylSulfide (DMS) and sea salt, ter-restrial DMS, volcanic SO2, mineral dust, and fossil fuel and biomass burning organic
5
and black carbon, we refer to Dentener et al. (2006) and Stier et al. (2005). The imple-mentation of a selection of algorithms to calculate the natural emissions of DMS, sea salt and mineral dust allows that the model can be used at different resolutions to study the sensitivity for a range of global flux estimates as well as controlling parameters such as the surface layer wind speed. The DMS emissions, which are calculated from the
10
10m wind speed and a climatology of the ocean water DMS concentrations according to Kettle and Andreae (2000), can be calculated by selecting one of different available parameterizations of the piston velocity according to Liss and Merlivat (1986), Wan-ninkhof (1992) or Nightingale (2000). Similarly, sea salt emissions can be simulated using algorithms based on Monahan (1986) or Schulz et al. (2004). Mineral dust
emis-15
sions are simulated according to Balkanski et al. (2004) where alternative algorithms, e.g. based on Tegen et al. (2002), will become available in future updated model ver-sions (see also Sect. 4). Other online calculated natural sources involve soil-biogenic NOx and vegetation emissions of NMVOC’s. Soil-biogenic NOx emissions are calcu-lated according to a modified version of the Yienger and Levy (1995) algorithm initially
20
implemented and applied in the chemistry-climate model ECHAM4 to study the role of canopy processes for global soil-biogenic NOx emissions (Ganzeveld et al., 2002). To actually consider the role of deposition, chemical transformations and turbulence within the canopy, a Canopy Reduction Factor (CRF) (Yienger and Levy (1995) is used as a default since the study by Ganzeveld et al. (2002) indicated that the ecosystem specific
25
CRF provides reasonable estimates of the atmosphere-biosphere NOx flux compared to an explicit multi-layer canopy model. One further modification relevant to mention is that in the version implemented in EMDEP not only the contribution to soil NO
emis-ACPD
6, 5457–5483, 2006Offline and online emissions and dry deposition in MESSy L. N. Ganzeveld et al. Title Page Abstract Introduction Conclusions References Tables Figures J I J I Back Close
Full Screen / Esc
Printer-friendly Version Interactive Discussion
EGU
sions by synthetic fertilizer application but also that due to animal manure is considered (A. F. Bouwman, personal communication, 2004). However, despite a near doubling of the N input, there is actually a decrease in the global annual NO emissions related to agricultural activities due to the fact that the fractional loss of the amount of fertilizer, which was previously set at 2.5% (Yienger and Levy, 1995), has been reduced to 0.7%
5
(Bouwman et al., 2002).
Biogenic NMVOC emissions are calculated according to the Guenther et al. (1995) algorithm based on the global distribution of the 72 ecosystems of the Olson (1992) database. The latter, in combination with a Normalized Difference Vegetation Index (NDVI) satellite dataset, provides monthly estimates of the biomass (foliar density and
10
Leaf Area Index, LAI), which are applied not only to calculate the emissions of iso-prene, monoterpenes and other VOC’s, but also dry deposition and soil-biogenic NOx emissions.
Finally, in EMDEP there is the option to consider the emissions of methane (CH4), which are, in the current implementation, not calculated online but inferred from the
dif-15
ference in the simulated surface layer and observed surface layer CH4concentrations. The latter are based on observations from the NOAA/CMDL cooperative air sampling network (Dlugokencky, 1994) processed using the methodology of Butler (2004). 3.2 Gaseous and aerosol dry deposition
A major limitation to introduce improved representations of the dry deposition process
20
in large-scale models such ECHAM5/MESSy is the fact that dry deposition has only been directly measured for a small selection of gases and aerosols such as ozone (O3), sulfur dioxide (SO2) ammonia (NH3) and sulfate (SO2−4 ). Merely a limited number of dry deposition measurements of other species such as peroxides (hydrogen perox-ide, H2O2), nitric acid (HNO3) and other oxidized nitrogen species such as nitrogen
25
(di)oxide (NO2 and NO) have been performed, whereas measurements are also gen-erally biased towards vegetation dry deposition. Observations of dry deposition over the oceans, snow-ice covered and bare soil surfaces are sparse, which not only limits a
ACPD
6, 5457–5483, 2006Offline and online emissions and dry deposition in MESSy L. N. Ganzeveld et al. Title Page Abstract Introduction Conclusions References Tables Figures J I J I Back Close
Full Screen / Esc
Printer-friendly Version Interactive Discussion
EGU
better quantification of the role of dry deposition in tracer budgets over these surfaces, but also the identification of controlling mechanisms required for the further advance-ment of model representations. The understanding of the mechanisms is mostly lim-ited to that of turbulent transport and diffusion to the surface and some surface related mechanisms such as the stomatal uptake of gases such as O3 and SO2. For a
com-5
prehensive overview of the status of dry deposition research we refer to Wesely and Hicks (2000).
To at least provide first-order estimates of the potential role of dry deposition of gases for which no direct dry deposition measurements are available Wesely (1989) introduced a commonly applied approach by which surface uptake resistances are
10
estimated based on solubility and reactivity by scaling to those of O3and SO2. A non-soluble but reactive gas is expected to deposit like O3whereas a more soluble and less reactive gas should deposit like SO2. The default selection of gases included in the dry deposition scheme of EMDEP (and DRYDEP) are O3, SO2, HNO3, NO and NO2, com-plemented with bulk sulfate aerosol dry deposition (Ganzeveld and Lelieveld, 1995;
15
Ganzeveld et al., 1998) for studies that include sulfur chemistry but do not explicitly resolve aerosol mass size distributions (see below).
Dry deposition fluxes are calculated as the product of the surface layer concentration and the dry deposition velocity, which reflects the efficiency of the transport to- and de-struction at the surface. The dry deposition velocity (Vd) is calculated according to the
20
so-called “big leaf” approach where the vegetation canopy, or other surface, is repre-sented as a bulk substrate without considering in detail the different removal processes at different levels in the canopy. In analogy to the resistance against electrical conduc-tivity, Vd is calculated as the reciprocal of three serial resistances that represent the turbulent transport to the surface, molecular diffusion through a quasi-laminar
bound-25
ary layer and finally uptake and destruction by the surface. The turbulent transport or so-called aerodynamic resistance (Ra) is calculated from the wind speed, surface roughness and atmospheric stability whereas the quasi-laminar boundary layer resis-tance (Rb) is calculated from the same parameters and the trace gas specific
molec-ACPD
6, 5457–5483, 2006Offline and online emissions and dry deposition in MESSy L. N. Ganzeveld et al. Title Page Abstract Introduction Conclusions References Tables Figures J I J I Back Close
Full Screen / Esc
Printer-friendly Version Interactive Discussion
EGU
ular diffusivity. The vegetation surface uptake resistance (Rc) is calculated from the leaf/needle resistance, scaled up to the canopy scale by using the Leaf Area Index (LAI, single-sided leaf area per soil area), a species-specific soil uptake resistance and a resistance that accounts for turbulent transport through the canopy to the soil. The leaf resistance in EMDEP is calculated from the stomatal uptake resistance, generally
5
being provided by the driver model (e.g., in ECHAM5 to calculate evapotranspiration according to Sellers, 1986), corrected for differences in diffusivity between H2O and the gas, and species-specific mesophyllic and cuticular uptake resistances. For details concerning the selected values for the default selection of gases of the dry deposition scheme, we refer to Ganzeveld and Lelieveld (1995) and Ganzeveld et al. (1998). For
10
any other trace gas to be added to the dry deposition scheme, e.g., oxygenated com-pounds or acids, the only modification to be made is to define the tracer specific Henry Law’s coefficient [m atm−1], a reactivity coefficient [0, 0.1, 1] (with 0 for species that are poorly reactive on surfaces, e.g. acetaldehyde, 0.1 for semi-reactive species, e.g., peroxyacetylnitrate and 1 for highly reactive species, e.g., O3) and its molar mass (see
15
Appendix A).
A main new feature of the dry deposition calculations in EMDEP is the online calcu-lation of aerosol dry deposition as a function of aerosol properties, meteorology and surface cover. Aerosol dry deposition velocities (Vdaerosol) and fluxes are calculated with a modified version of the aerosol dry deposition model that has been used to develop
20
a parameterization of the bulk sulfate aerosol dry deposition in the chemistry-climate model ECHAM4 (Ganzeveld et al., 1998). The online aerosol dry deposition code has also been implemented and applied in the aerosol-climate model ECHAM5-HAM (Stier et al., 2005).
The model calculates Vdaerosolover land and over sea considering turbulence,
Brow-25
nian diffusion, impaction and sedimentation as a function of radius and density. Over sea the effect of particle growth on dry deposition due to the large relative humidity close to the sea surface is accounted for as well as bubble bursting that enhances dry deposition through the breakdown of the laminar boundary layer and the
scaveng-ACPD
6, 5457–5483, 2006Offline and online emissions and dry deposition in MESSy L. N. Ganzeveld et al. Title Page Abstract Introduction Conclusions References Tables Figures J I J I Back Close
Full Screen / Esc
Printer-friendly Version Interactive Discussion
EGU
ing of the particles by sea spray (Hummelshøj, 1992). The main modification in the aerosol dry deposition model is the calculation of the vegetation dry deposition veloc-ities, whereas in the Ganzeveld et al. (1998) model we applied a parameterization of sulfate aerosol dry deposition as a function of the friction velocity for stable and un-stable conditions developed by Wesely et al. (1985). In the new model aerosol dry
5
deposition to the vegetation is calculated according to Gallagher et al. (2002), which is a further modification of a parameterization of aerosol dry deposition by Slinn (1982). In contrast to Zhang et al. (2001) we have selected a smallest and a largest collector size of 10 µm and 1 mm, respectively, independent of land cover, partly associated with the large uncertainty involved in the definition of these parameters. The largest
collec-10
tor size is used to calculate the Stokes number, which is not only used to calculate impaction but also a rebound correction factor, whereas the small collector size is used to calculate the interception collection efficiency (Gallagher et al., 2002). More details concerning the use of the aerosol dry deposition model are found in the Appendix A.
4 Global emission budgets and dry deposition
15
Table 3 shows the global annual emissions for a selection of reactive trace gases and aerosols simulated with EMDEP, applied in ECHAM5/MESSy (version 1.1), for an 1-year climatological model integration (1 month spin-up, reference 1-year 1987–1988) with the T42L19 (i.e., 2.8◦grid resolution, 19 vertical levels) resolution of ECHAM5. The global isoprene (C5H8) emission flux of 607 TgC yr−1is significantly larger compared to
20
the estimate by Guenther et al. (1995) and the online simulated source of 500 TgC yr−1 with the chemistry-climate model ECHAM4 (Ganzeveld et al., 2002). The latter was calculated at a T31L19 spatial resolution with significantly larger estimates of vegeta-tion biomass compared to that used in the current implementavegeta-tion of biogenic emission and dry deposition calculations in EMDEP. In ECHAM4 the maximum Leaf Area Index
25
(LAI) for tropical forest even exceeded 10 m2 m−2 whereas observations show max-imum values up to about 6–7. Consequently we apply a function that provides an
ACPD
6, 5457–5483, 2006Offline and online emissions and dry deposition in MESSy L. N. Ganzeveld et al. Title Page Abstract Introduction Conclusions References Tables Figures J I J I Back Close
Full Screen / Esc
Printer-friendly Version Interactive Discussion
EGU
asymptotic increase in LAI to a maximum of 7 for the maximum observed Normalized Differential Vegetation Index (NDVI) (Ganzeveld et al., 2002). In addition, we have con-sistently corrected the foliar density (leaf biomass in g m−2) which is used to calculate the biogenic VOC emissions. Interestingly, a relative increase in the simulated frac-tion of sunlit leaves partly compensates this decrease in foliar density. The budgets of
5
the monoterpene (C10H16) and ORVOC’s emissions of 143 and 255 TgC yr−1, that are calculated by EMDEP using ECHAM5’s surface temperature, agree reasonable well with the estimates by Guenther et al. (1995) of 127 and 260 TgC yr−1, respectively. This suggests that EMDEP’s larger isoprene emission flux, compared to the Guenther et al. (1995) inventory, is mostly due to differences between the EMDEP online
simu-10
lated surface and in-canopy radiation regime, using ECHAM5’s surface net radiation, compared to the offline approach by Guenther et al. (1995), and not so much due to differences in temperature. Note that the simulated isoprene emission budget is nearly a factor two larger compared global isoprene flux of 350 TgC yr−1by von Kuhlmann et al. (2003), which applied a global scaling factor to the online calculated emission fluxes
15
and which is a common approach widely applied in global scale atmospheric chemistry model analysis. This is generally being justified by the fact that use of the 500 TgC yr−1 inventory results in simulated tropical boundary layer isoprene concentrations that are significantly larger compared to observations. This misrepresentation is likely also due to the models representations of boundary layer mixing, dry deposition (of isoprene
20
and the oxidation products) and chemical destruction (von Kuhlmann et al., 2004) and not only a possible overestimation of emissions. Interestingly, a new inventory of the global isoprene emissions with the MEGAN model (Guenther et al., 2006), which in-corporates the newly acquired information on biological, physical and chemical drivers since the release of the Guenther et al. (1995) inventory, provides a global isoprene
25
emission budget of ∼530 TgC yr−1.
The LAI is also used in the calculation of the Canopy Reduction Factor (CRF), which provides estimates of the soil-biogenic NOxemissions comparable to those calculated with an explicit multi-layer canopy model implemented in ECHAM4 (Ganzeveld et al.,
ACPD
6, 5457–5483, 2006Offline and online emissions and dry deposition in MESSy L. N. Ganzeveld et al. Title Page Abstract Introduction Conclusions References Tables Figures J I J I Back Close
Full Screen / Esc
Printer-friendly Version Interactive Discussion
EGU
2002). Table 3 shows that the online simulated global soil NO flux of 12.4 TgN yr−1 is reduced by about 35% with maximum decreases in tropical forested regions up to about 75%. Pulsing, which is the enhancement in emissions in response to rainfall after a period of drought, enhances the soil NO emission by about 2 TgN yr−1whereas fertilizer application and animal manure contribute about 0.7 TgN yr−1. The latter is
5
about the half the contribution by fertilizers to global soil NO emissions inferred from a statistical modeling approach by Bouwman et al. (2002). This can be explained by the fact that the fertilizer application is corrected for a prescribed global distribution of cultivation intensity determining the timing of fertilizer application. Consequently, we apply in EMDEP a fractional fertilizer loss of 1.5% to arrive at a contribution by fertilizers
10
to global soil-biogenic NOxemissions of 1.5 TgN yr−1.
The global annual DMS emission flux, calculated in this simulation with the Liss and Merlivat (1986) parameterization for the piston velocity, is 17.3 TgS yr−1. This is about 6 TgS less compared to the number reported by Stier et al. (2005). This also reflects the sensitivity to the parameterization applied for the piston velocity (Nightingale, 2000)
15
that was used by Stier et al. (2005). Note that in addition to this major biogenic source of sulfur, terrestrial DMS and volcanic SO2 emissions, amounting to about 1 TgS yr−1 (Spiro et al., 1992) and 8 TgS yr−1 (Graf et al., 1997), respectively, are also included in EMDEP. The sea salt emission flux of 5906 Tg sea salt yr−1, calculated according to Schulz et al. (2004), is larger compared to the emissions budgets presented by
20
Stier et al. (2005) (5050 Tg yr−1). One possible explanation for this discrepancy are differences in the surface wind speed as the emissions were obtained with the T42L19 model resolution whereas Stier et al. (2005) applied an T63L31 (ECMWF) resolution. In addition, our emission budget reflects an ECHAM5 climatological simulation whereas the results by Stier et al. (2005) reflect emissions for a simulation where ECHAM5
25
has been nudged towards the ECMWF ERA40 reanalysis data. The nudging results in a slightly smaller sea salt emission burden compared to climatological simulations due to a relative decrease in the wind speeds. This has an even more pronounced impact on the simulated mineral dust emissions, which partly explains an calculated
ACPD
6, 5457–5483, 2006Offline and online emissions and dry deposition in MESSy L. N. Ganzeveld et al. Title Page Abstract Introduction Conclusions References Tables Figures J I J I Back Close
Full Screen / Esc
Printer-friendly Version Interactive Discussion
EGU
global annual emission flux according to our implementation of the scheme according to Balkanski et al. (2004) with EMDEP of 1432 Tg yr−1, about 680 Tg larger compared than that presented by Stier et al. (2005). This is consistent with other simulations of mineral dust emissions, calculated according to Tegen et al. (2002), which also showed a significant decrease in the nudged model simulations compared to a climatological
5
simulation with the same model resolution.
In Table 3 we not only present global emission burden for biogenic NOx, VOC, DMS and sea-salt and mineral dust aerosol mass for the T42L19 model resolutions but also include the budgets for the T21L19 (∼5.6◦) and T63L19 (∼1.8◦) model resolution. Note that for the T63 resolution, the 31 layer (L31) vertical structure is generally
recom-10
mended, but here we have consistently applied the L19 vertical resolution. In general the emissions increase with an increase in resolution from T21 to T63 with relative in-creases (T63-T21 relative to T42 emissions) up to about 10% for isoprene and DMS and about 20% for monoterpenes, ORVOC and sea salt, whereas soil-biogenic NOx emissions actually show a small decrease. These changes reflect differences in the
15
simulated net surface radiation, temperature, wind speed, precipitation and soil mois-ture for the different model resolutions.
The mineral dust emissions are extremely sensitive to the applied resolution sug-gesting that the implementation of the emission algorithm by Balkanski et al. (2004) in EMDEP should only be applied for the T42 resolution since only for this resolution it
20
produces emissions fluxes comparable to those reported by Tegen et al. (2002) in a climatological run with ECHAM5. For other resolutions, for example the T63 simulation we simulate a global emission strength >8000 Tg yr−1 mostly due to very large emis-sions in Pakistan and north of the Himalaya contributing >85% of the global emisemis-sions also due to simulated monthly mean 10 m wind speeds exceeding 20 m s−1.
Alterna-25
tive algorithms to simulate mineral dust emissions, e.g., the one by Tegen et al. (2002), potentially being less sensitive to the applied resolution will be implemented in EMDEP in the near future.
ACPD
6, 5457–5483, 2006Offline and online emissions and dry deposition in MESSy L. N. Ganzeveld et al. Title Page Abstract Introduction Conclusions References Tables Figures J I J I Back Close
Full Screen / Esc
Printer-friendly Version Interactive Discussion
EGU
4.1 Dry deposition and emission height profiles
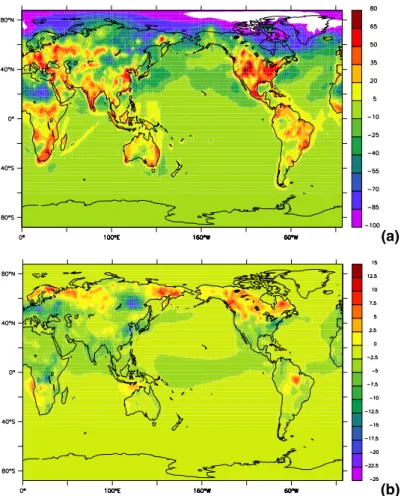
An important feature of the application of the emission inventory in OFFLEM is the consideration of emission height profiles for tracer transport calculations. To indicate the sensitivity of the simulated trace gas exchanges to the applied height profiles, we present in Figs. 1a and b the relative difference in annual mean SO2and O3dry
depo-5
sition fluxes between a simulation with ECHAM5/MESSy in which the precursors have been released at the surface and one applying the vertical redistribution of emissions up to 800m altitude, as described above (Table 1). These results reflect a simulation with a setup similar to an that used for an evaluation of ECHAM5/MESSy (J ¨ockel et al., 20062) including tracer transport, gas-phase chemistry (Sander et al., 2005) and
10
scavenging (Tost et al., 2006) except of a different vertical resolution (L19 versus L90), no nudging and using EMDEP instead of the submodels ONLEM and DRYDEP. The simulated SO2dry deposition fluxes resulting from emitting all SO2in the surface layer are up to 80% higher in the vicinity of the sources over the continents in low and middle latitudes, whereas at larger distances from the sources e.g., over the eastern Sahara
15
and Artic regions, large relative (but small absolute) decreases in dry deposition occur as a result of the decreased supply by long-range transport. Figure 1b shows a relative smaller sensitivity of O3 deposition to the vertical emissions profiles of the precursor gases CO, NOxand NMVOC’s compared to SO2. There are relative decreases >10% in O3 dry deposition in the main source regions with large technological and biomass
20
burning emissions when those emissions are emitted away from the surface whereas the more effective long-range transport of the precursor gases explains the increases in the O3deposition up to 15% in the northern hemisphere high latitude regions. The
2
J ¨ockel, P., Tost, H., Pozzer, A., Br ¨uhl, Ch., Buchholz, J., Ganzeveld, L., Hoor, P., Kerk-weg, A, Lawrence, M. G., Sander, R., Steil, B., Stiller, G., Tanarhte, M., Taraborrelli, D., van Aardenne, J., and Lelieveld, J.: The atmospheric chemistry general circulation model ECHAM5/MESSy1: Consistent simulation of ozone from the surface to the mesosphere, At-mos. Chem. Phys. Discuss., submitted, 2006.
ACPD
6, 5457–5483, 2006Offline and online emissions and dry deposition in MESSy L. N. Ganzeveld et al. Title Page Abstract Introduction Conclusions References Tables Figures J I J I Back Close
Full Screen / Esc
Printer-friendly Version Interactive Discussion
EGU
application of the emission height profiles results in a relative decrease in the global annual SO2 dry deposition flux up to about 30% compared to surface emissions sim-ulations associated with a significant decrease in surface layer concentrations. This results in a significant increase in the SO2 lifetime and it enhances the long-range transport of sulfur pollution. This sensitivity of dry deposition to the emission height
5
is also relevant to the evaluation of ECHAM5/MESSy, addressed in our first extensive model evaluation publication (J ¨ockel et al., 20062), which will also include a direct com-parison of observed and simulated surface concentrations and dry deposition fluxes.
5 Summary/conclusions
We have presented the state-of-the-art representation of surface reactive trace gas
10
and aerosol exchanges describing an anthropogenic and natural offline emission in-ventory, distributed with the first official release of MESSy, and MESSy’s submodel EMDEP. This includes a discussion of the mechanisms underlying the emissions and dry deposition calculations, global online calculated emission budgets with EMDEP and an assessment of the sensitivity of dry deposition to the emission height
pro-15
files. This emission height is included in the offline emission inventory that includes the EDGARv3.2-FT2000 technological and biomass burning emission and prescribed terrestrial and oceanic emissions. The large sensitivity of the simulated dry deposi-tion fluxes to the emission heights that are based on a limited amount of studies and expert assumptions, and therefore accompanied with large uncertainty, indicates the
20
priority of a better understanding and representation of the effective emission heights in models such as MESSy.
The online calculated gaseous and aerosol natural and biogenic emissions use the driver models micrometeorological and surface cover parameters complemented with land cover and land use properties inferred from satellite data and global scale
ecosys-25
tem and land use datasets.
im-ACPD
6, 5457–5483, 2006Offline and online emissions and dry deposition in MESSy L. N. Ganzeveld et al. Title Page Abstract Introduction Conclusions References Tables Figures J I J I Back Close
Full Screen / Esc
Printer-friendly Version Interactive Discussion
EGU
paction, interception and sedimentation as a function of the models micrometeorology and land cover and aerosol radius. Gaseous dry deposition is calculated online for many species in addition to those for which dry deposition is known to be an impor-tant sink based on scarcely available measurement data. The scheme can be easily extended to other species expected to be removed by dry deposition based on their
5
chemical and physical properties, using the approach proposed by Wesely (1989). However, it should be noted that recent studies indicate that first-order estimates of the surface uptake resistances according to that approach seem to result in a signifi-cant underestimation of dry deposition of a selection of oxygenated species, measured in the tropical forest of Costa Rica (Karl et al., 2004) and peroxides (Ganzeveld et al.,
10
2006). This suggests that the approach needs modification which, however, is severely limited by the availability of observational data. Actually, the implementation of these first-order estimates of dry deposition in models such as EMDEP can help obtain indi-cations about the potential relevance of the dry deposition process, and consequently provide suggestions to the experimental community on the priority of further research
15
focusing on dry deposition.
We have demonstrated the large impact of applying the EDGARv3.2-FT2000 rec-ommended emission heights; for example, on the SO2dry deposition flux. This is not only relevant to atmospheric chemistry with respect to a change in the lifetime and atmospheric burden but also to the evaluation of models such as ECHAM5/MESSy.
20
This evaluation relies on the comparison of observed and simulated concentrations and fluxes, including many surface observations, obviously being strongly affected by emission and deposition parameterisations. This underscores the need for improved and consistent representations of the spatial and temporal variability of surface ex-change processes in Earth system models, including e.g. diel cycles in technological
25
ACPD
6, 5457–5483, 2006Offline and online emissions and dry deposition in MESSy L. N. Ganzeveld et al. Title Page Abstract Introduction Conclusions References Tables Figures J I J I Back Close
Full Screen / Esc
Printer-friendly Version Interactive Discussion
EGU Appendix A
The emission and dry deposition calculations in EMDEP are included in three di ffer-ent sub-submodels idffer-entified by the names EMDEP XTSURF, EMDEP DRYDEP and EMDEP EMIS. The EMDEP XTSURF routines deal with the initialization of land cover and land use parameters, the tracer specific surface uptake resistances, and the actual
5
calculations of the gaseous and aerosol “big leaf” dry deposition velocities from those surface resistances. These dry deposition velocities are then subsequently applied in EMDEP DRYDEP to actually calculate the dry deposition fluxes, where alternative algorithms, e.g., based on prescribed deposition velocities, can also be included. In EMDEP EMIS the online emission are calculated from the driver model parameters
10
and the land cover and land use parameters initialized in EMDEP XTSURF. Note that the presented budgets reflect calculations with the EMDEP model, which is continu-ously further developed. Consequently differences in calculated emission and deposi-tion budgets between EMDEP and ONLEM and DRYDEP are to be expected. Further improvements in the online emission- and dry deposition calculations in EMDEP are
15
intended to be implemented later into ONLEM and DRYDEP, respectively, as well, after they have been thoroughly tested. One of the future extensions of EMDEP will be the release of a version that includes a multi-layer canopy model to study the role of in-canopy interactions between biogenic emissions, dry deposition, chemistry and turbu-lent transport, previously used to study global soil-biogenic NOxexchanges (Ganzeveld
20
et al., 2002).
A1 Adding a tracer to the dry deposition calculations
In order to include the explicit dry deposition calculations tracer specific properties need to set in the tracer definition. If the tracer is defined by the submodel MECCA (Sander et al., 2005) in the file tracdef.tex, the dry deposition calculation switch NDRYDEP has
25
to be set to ON. In addition, for gases the molecular mass, Henry law’s coefficient [mol l−1] and a reactivity coefficient must be defined. The latter has only three values
ACPD
6, 5457–5483, 2006Offline and online emissions and dry deposition in MESSy L. N. Ganzeveld et al. Title Page Abstract Introduction Conclusions References Tables Figures J I J I Back Close
Full Screen / Esc
Printer-friendly Version Interactive Discussion
EGU
with 0 reflecting a non-reactive gas (e.g., acetone), 0.1 for an intermediate reactive gas (e.g., PAN), and 1 for a reactive gas (e.g., monoterpenes). Otherwise, these tracer properties must be set by definition of the respective tracer being considered in the var-ious submodels. For aerosol dry deposition calculations information is required on the aerosol density [kg m−3] and the aerosol number and mass radii [m]. The aerosol dry
5
deposition code is programmed to simulate aerosol dry deposition for the implemen-tation of a modal aerosol model conducting the calculations for the number of modes that are characterized by a median or mean mode radius, the sigma and wet aerosol density. However, the model can easily be modified for application in a bin-resolving aerosol model or in a bulk aerosol model by simply defining representative bulk aerosol
10
properties. By default the code calculates Vdaerosolfor or a more computational efficient method using the modal mean number and mass radii but the option exists to calculate Vdaerosol integrating over the number- and mass size distributions.
A2 Integration in vertical diffusion scheme
The calculation of the concentration change due to surface exchanges can be done
15
according to two different approaches which allow studying the possible impact of op-erator splitting involving surface exchanges and vertical turbulent diffusion. In the de-fault set-up (set by the switch lturb emis in the EMDEP namelist) the calculated surface exchange fluxes [molecules m−2 s−1] are used as the lower boundary condition in the vertical diffusion scheme of ECHAM5 (parameter ZXTEMS, [mol mol−1 kg m−2s−1] for
20
tracer defined in volume mixing ratio). The alternative is to assign fluxes to the tracer tendency (parameter PXTTE, [mol mol−1s−1]).
Acknowledgements. We highly appreciate the support by L. Bouwman for providing the animal
manure data. In addition, the set-up of the emission datasets and algorithms used in EMDEP (and ONLEM) has greatly benefited from the help by the various colleagues who have de-25
veloped the algorithms: S. Kloster (DMS emissions), I. Tegen and Y. Balkanski (mineral dust emissions), and M. Schulz (sea salt emissions).
ACPD
6, 5457–5483, 2006Offline and online emissions and dry deposition in MESSy L. N. Ganzeveld et al. Title Page Abstract Introduction Conclusions References Tables Figures J I J I Back Close
Full Screen / Esc
Printer-friendly Version Interactive Discussion
EGU References
Andreae, M. O. and Merlet, P.: Emissions of trace gases and aerosols from biomass burning, Global. Biogeochem. Cycles, 15, 955–966, 2001.
Butler, T. M, Simmonds, I., and Rayner, P. J.: Mass balance inverse modelling of methane in the 1990’s using a Chemistry Transport Model, Atmos. Chem. Phys., 4, 2561–2580, 2004. 5
Bouwman, A. F., Lee, D. S., Asman, W. A. H., Dentener, F. J., van Der Hoek, K. W., and Olivier, J. G. J.: A global high-resolution emission inventory for ammonia, Global Biogeochem. Cy-cles, 11, 561–587, 1997.
Bouwman, A. F., Boumans, L. J. M., and Batjes, N. H.: Modeling global annual N2O and NO emissions from fertilized fields, Global Biogeochem. Cycles, 16(4), 1080, 10
doi:10.1029/2001GB001812, 2002.
Dentener, F., Kinne, S., Bond, T., Boucher, O., Cofala, J., Generoso, S., Ginoux, P., Gong, S., Hoelzemann, J. J., Ito, A., Marelli, L., Penner, J. E., Putaud, J.-P., Textor, C., Schulz, M., van der Werf, G. R., and Wilson, J.: Emissions of primary aerosol and precursor gases in the years 2000 and 1750, prescribed data-sets for AeroCom, (data available from 15
ftp://ftp.ei.jrc.it/pub/Aerocom/), Atmos. Chem. Phys. Discuss., 6, 2703–2763, 2006.
Dlugokencky, E. J., Steele, L. P., Lang, P. M., and Masarie, K. A.: The growth rate and distribu-tion of atmospheric methane, J. Geophys. Res., 99, 17 021–17 043, 1994.
Eyring, V., K ¨ohler, H. W., Van Aardenne, J., and Lauer, A.: Emissions from international shipping, Part I: The last 50 years, J. Geophys. Res., J. Geophys. Res., 110, D17305, 20
doi:10.1029/2004JD005619, 2006.
Galanter, M., Levy, H., and Carmichael, G. R.: Impacts of biomass burning on tropospheric CO, NOx, and O3, J. Geophys. Res., 105, 6633–6653, 2000.
Gallagher, M. W., Nemitz, E., Dorsey, J. R., Fowler, D., Sutton, M. A., Flynn, M., and Duyzer, J.: Measurements and parameterizations of small aerosol dry deposition velocities to grassland, 25
arable crops, and forest: Influence of surface roughness length on deposition, J. Geophys. Res., 107, doi:10.1029/2001JD000817, 2002.
Ganzeveld, L. and Lelieveld, J.: Dry deposition parameterization in a chemistry general circu-lation model and its influence on the distribution of reactive trace gases, J. Geophys. Res., 100, 20 999–21 012, 1995.
30
Ganzeveld, L., Lelieveld, J., and Roelofs, G.-J.: Dry deposition parameterization of sulfur oxides in a chemistry and general circulation, J. Geophys. Res., 103, 5679–5694, 1998.
ACPD
6, 5457–5483, 2006Offline and online emissions and dry deposition in MESSy L. N. Ganzeveld et al. Title Page Abstract Introduction Conclusions References Tables Figures J I J I Back Close
Full Screen / Esc
Printer-friendly Version Interactive Discussion
EGU
Ganzeveld, L., Lelieveld, J., Dentener, F. J., Krol, M. C., Bouwman, A. F., and Roelofs, G.-J.: The influence of soil-biogenic NOx emissions on the global distribution of reactive trace gases: the role of canopy processes, J. Geophys. Res., 107, doi:10.1029/2001JD001289, 2002.
Ganzeveld, L., Valverde-Canossa, J., Moortgat, G., and Steinbrecher, R.: Evaluation of Per-5
oxide Exchanges over a Coniferous Forest in a Single-Column Chemistry-Climate Model, Atmos. Environ., in press, 2006.
Guenther, A., Nicolas Hewitt, C., Erickson, D., Fall, R., Geron, C., Graedel, T., Harley, P., Klinger, L., Lerdau, M., McKay, W. A., Pierce, T., Scholes, B., Steinbrecher, R., Tallamraju, R., Taylor, J., and Zimmerman, P.: A global model of natural volatile organic compound 10
emissions, J. Geophys. Res., 100, 8873–8892, 1995.
Guenther, A., Karl, T., Harley, P., Wiedinmyer, C., Palmer, P. I., and Geron, C.: Estimates of global terrestrial isoprene emissions using MEGAN (Model of Emissions of Gases and Aerosols from Nature), Atmos. Chem. Phys. Discuss., 6, 107–173, 2006.
Graf, H. F., Feichter, J., and Langmann, B.: Volcanic degassing: Contribution to global sulphate 15
burden and climate, J. Geophys. Res., 102, 10 727–10 738, 1997.
Hummelshøj, P., Jensen, N. O., and Larsen, S. E.: Particle dry deposition to a sea surface, in: Precipitation scavenging and atmosphere-surface exchange, 2, edited by: Schwartz, S. E. and Slinn, W. G. N., 829–840, Hemisphere Publishing Corporation, Washington, 1992. J ¨ockel, P., Sander, R., Kerkweg, A., Tost, H., and Lelieveld, J.: Technical Note: The Modu-20
lar Earth Submodel System (MESSy) – a new approach towards Earth System Modeling, Atmos. Chem. Phys., 5, 433–444, 2005.
Karl, T., Potosnak, M., Guenther, A., Clark, D., Walker, J., Herrick, J., and Geron, C.: Ex-change processes of volatile organic compounds above a tropical rain forests: implica-tions for modeling tropospheric chemistry above dense vegetation, J. Geophys. Res., 109, 25
doi:10.1029/2004JD004738, 2004.
Kerkweg, A., Sander, R., Tost, H., and J ¨ockel, P.: Technical Note: Implementation of prescribed (OFFLEM), calculated (ONLEM), and pseudo-emissions (TNUDGE) of chemical species in the Modular Earth Submodel System (MESSy), Atmos. Chem. Phys. Discuss., 6, 5485– 5504, 2006a.
30
Kettle, A. J. and Andreae, M. O.: Flux of dimethylsulfide from the oceans: A comparison of updated data sets and flux models, J. Geophys. Res., 105, 26 793–26 808, 2000.
ACPD
6, 5457–5483, 2006Offline and online emissions and dry deposition in MESSy L. N. Ganzeveld et al. Title Page Abstract Introduction Conclusions References Tables Figures J I J I Back Close
Full Screen / Esc
Printer-friendly Version Interactive Discussion
EGU
of Air-Sea Exchange in Geochemical cycling, edited by: Buat-Menard, P., pp. 113–127, D. Reidel, Norwell, Mass., 1984.
Monahan, E., Spiel, D., and Davidson, K.: Oceanic whitecaps and their role in air-sea ex-change, chap. A model of marine aerosol generation via whitecaps and wave disruption, pp. 167–174, D., Reidel, Norwell, Massachusetts, 1986.
5
Nightingale, P. D., Malin, G., Law, C. S., Watson, A. J., Liss, P. S., Liddicoat, M., Boutin, J., and Upstill-Goddard, R. C.: In situ evaluation of sea-air exchange parameterization using novel conservative volatile tracers, Global Biogeochem. Cycles, 14, 373–378, 2000.
Olivier, J. G. H., van Aardenne, J. A., Dentener, F., Ganzeveld, L., and Peters, J. A. H. W.: Recent trends in global greenhouse gas emissions: regional trends and spatial distribution 10
of sources, Env. Sci., 2, 81–99, doi:10.1080/15693430500400345, 2005.
Roeckner, E., B ¨auml, G., Bonaventura, L., Brokopf, R., Esch, M., Giorgetta, M., Hagemann, S., Kirchner, L., Kornblueh, L., Manzini, E., Rhodin, A., Schlese, U., Schulzweida, U., and Tompkins, A.: The atmospheric general circulation model ECHAM5. Part I: Model descrip-tion, Report 349, Max Planck Institute for Meteorology, Hamburg, Germany, available from 15
http://www.mpimet.mpg.de, 2003.
Sander, R., Kerkweg, A., J ¨ockel, P., and Lelieveld, J.: Technical Note: The new comprehensive atmospheric chemistry module MECCA, Atmos. Chem. Phys., 5, 445–450, 2005.
Sellers, P. J., Mintz, Y., Sud, Y. C., and Dalcher, A.: A simple biosphere model (SiB) for use within general circulation models, J. Atmos. Sci., 43, 505–531, 1986.
20
Slinn, W. G. N.: Predictions for particle deposition to vegetative canopies, Atmos. Environ., 16, 1785–1794, 1982.
Spiro, P. A., Jacob, D. J., and Logan, J. A.: Global Inventory of Sulfur Emissions With 1◦×1◦ Resolution, J. Geophys. Res., 97, 6023–6036, 1992.
Stier, P., Feichter, J., Kinne, S., Kloster, S., Vignati, E., Wilson, J., Ganzeveld, L., Tegen, 25
I., Werner, M., Balkanski, Y., Schultz, M., and Boucher, O.: The aerosol-climate model ECHAM5-HAM, Atmos. Chem. Phys., 5, 1125–1156, 2005.
Tost, H., J ¨ockel, P., Kerkweg, A., Sander, R., and Lelieveld, J.: Technical Note: A new compre-hensive SCAVenging submodel for global atmospheric chemistry modelling, Atmos. Chem. Phys., 6, 565–574, 2006.
30
Van Aardenne, J. A., Dentener, F., Olivier, J. G. J., Peters, J. A. H. W., and Ganzeveld, L. N.: The EDGAR 3.2 Fast Track 2000 dataset (32FT2000), http://www.mnp.nl/edgar/model/
ACPD
6, 5457–5483, 2006Offline and online emissions and dry deposition in MESSy L. N. Ganzeveld et al. Title Page Abstract Introduction Conclusions References Tables Figures J I J I Back Close
Full Screen / Esc
Printer-friendly Version Interactive Discussion
EGU
Van der Werf, G. R., Randerson, J. T., Collatz, G. J., and Giglio, L.: Carbon emissions from fires in tropical and subtropical ecosystems, Global Change Biology, 9, 547–562, 2003. Von Kuhlmann, R., Lawrence, M. G., and Crutzen, P. J.: A model for studies of tropospheric
ozone and nonmethane hydrocarbons: Model descriptions and ozone results, J. Geophys. Res., 108, doi:10.1029/2002JD002893, 2003.
5
Von Kuhlmann, R., Lawrence, M. G., P ¨oschl, U., and Crutzen, P. J.: Sensitivities in global scale modeling of isoprene, Atmos. Chem. Phys., 4, 1–17, 2004.
Wanninkhof, R.: Relationship between wind speed and gas exchange over the ocean, J. Geo-phys. Res., 96, 2785–2796, 1992.
Wesely, M. L., Cook, D. R., and Hart, R. L.: Measurements and parameterization of particulate 10
sulfur dry deposition over grass, J. Geophys. Res., 90, 2131–2143, 1985.
Wesely, M. L.: Parameterization of surface resistances to gaseous dry deposition in regional-scale numerical models, Atmos. Environ., 23, 1293–1304, 1989.
Wesely, M. L. and Hicks, B. B.: A review of the current status of knowledge on dry deposition, Atmos. Environ., 34, 2261–2282, 2000.
15
Yienger, J. J. and Levy II, H.: Global inventory of soil-biogenic NOx emissions, J. Geophys. Res., 100, 11 447–11 464, 1995.
Zhang, L., Gong, S., Padro, J., and Barrie, L.: A size-segregated particle dry deposition scheme for an atmospheric aerosol model, Atmos. Environ., 35, 549–560, 2001.
ACPD
6, 5457–5483, 2006Offline and online emissions and dry deposition in MESSy L. N. Ganzeveld et al. Title Page Abstract Introduction Conclusions References Tables Figures J I J I Back Close
Full Screen / Esc
Printer-friendly Version Interactive Discussion
EGU Table 1. Emission height profiles for the EDGARv3.2-FT2000 emission source categories,
distinguishing 6 emission heights, 45, 140, 240 400 600 and 800 m, where the numbers in the columns reflect the percentage of the total emission flux assigned to the specific height. The info source EMEP indicates profiles based on the EMEP model whereas AA indicates that these profiles are based on an arbitrarily assumption.
Source category Source name 45 m 140 m 240 m 400 m 600 m 800 m Info source
B10 Industry 0 4 19 41 30 6 EMEP
B20 Power generation 0 0 8 46 29 17 EMEP
B30 Charcoal prod. 100 0 0 0 0 0 AA
B40 RCO 50 50 0 0 0 0 EMEP
F10 Industry 0 4 19 41 30 6 EMEP
F20 Power generation 0 0 8 46 29 17 EMEP
F30 OTS 0 4 19 41 30 6 EMEP
F40 RCO 50 50 0 0 0 0 EMEP
F51 Road transport 100 0 0 0 0 0 EMEP
F54 Non-Road transport 100 0 0 0 0 0 EMEP
F58 Inter. Shipping 50 50 0 0 0 0 AA
F60 Chem. Feedstock 100 0 0 0 0 0 AA
F70 Coal production 90 10 0 0 0 0 EMEP
F80 Oil production 90 10 0 0 0 0 EMEP
F90 Gas production 90 10 0 0 0 0 EMEP
I10 Iron and steel 90 10 0 0 0 0 EMEP
I20 Non-ferrous metals 90 10 0 0 0 0 EMEP
I30 Chemicals 90 10 0 0 0 0 EMEP
I40 Building materials 90 10 0 0 0 0 EMEP
I50 Pulp and paper 90 10 0 0 0 0 EMEP
I60 Food, bev, tobacco 90 10 0 0 0 0 EMEP
I70 Solvents 100 0 0 0 0 0 EMEP
I90 Misc. industry 100 0 0 0 0 0 EMEP
L10 Arable land 100 0 0 0 0 0 EMEP
L15 Rice cultivation 100 0 0 0 0 0 EMEP
L20 Animals 100 0 0 0 0 0 EMEP
L30 Animal waste man. 100 0 0 0 0 0 EMEP
L41 Deforestation 0 100 0 0 0 0 AA
L42 Savannah burning 0 100 0 0 0 0 AA
L43 Agric. waste burning 0 100 0 0 0 0 AA
L44 Vegetation fires 0 100 0 0 0 0 AA
L45 Deforestation indirect 0 100 0 0 0 0 AA
L50 Crop products 100 0 0 0 0 0 AA
L70 Indirect N2O 100 0 0 0 0 0 AA
W10 Landfills 100 0 0 0 0 0 AA
W20 Wastewater treatment 10 15 40 35 0 0 EMEP
W30 Human waste disposal 10 15 40 35 0 0 EMEP
W40 Waste incineration 10 15 40 35 0 0 EMEP
ACPD
6, 5457–5483, 2006Offline and online emissions and dry deposition in MESSy L. N. Ganzeveld et al. Title Page Abstract Introduction Conclusions References Tables Figures J I J I Back Close
Full Screen / Esc
Printer-friendly Version Interactive Discussion
EGU Table 2. Global annual offline emissions per source category and total emission flux for the
emission inventory and the one applied in MATCH.
Chemical Technological Biofuel Biomass burning Biogenic Total MATCH1 Compound NOx 31.4 2.5 9.3 0.02 43.1 32.43 CO 120.7 107.3 193.8 48.2 470.1 541 SO2 73.2 3.1 1.3 76.0 C2H4 3.3 4.4 4.1 10.7 22.6 25.1 C2H6 5.0 2.3 2.2 0.4 10.0 10.2 C3H6 1.7 2.0 1.9 3.0 8.5 9.6 C3H8 8.1 0.7 0.7 0.3 9.8 7.3 C4H10 59.9 0.1 0.9 0.3 62.1 40.4 CH3CHO 0.0 1.1 1.1 0.0 2.2 2.5 CH3COCH3 1.9 1.2 1.1 25.6 29.8 28.6 CH3COOH 0.0 2.6 2.5 1.4 6.5 7.2 CH3OH 1.2 2.5 2.3 23.2 29.1 28.7 HCHO 0.4 1.4 1.3 0.0 3.1 3.6 HCOOH 0.0 0.9 0.9 1.5 3.3 3.5 MEK 2.8 2.9 2.8 0.0 8.5 8.4 NH3 53.9 53.9 Units are in Tg C/N/S 1
von Kuhlmann et al. (2003)
2
Calculated online
3
Total technological and biomass burning, excluding the soil-biogenic, aircraft and lightning contribution
ACPD
6, 5457–5483, 2006Offline and online emissions and dry deposition in MESSy L. N. Ganzeveld et al. Title Page Abstract Introduction Conclusions References Tables Figures J I J I Back Close
Full Screen / Esc
Printer-friendly Version Interactive Discussion
EGU Table 3. Global annual online emissions calculated by EMDEP, applied in ECHAM5/MESSy,
as function of three different model resolutions and the relative difference between the high and coarse resolution simulations resembling an 1-year integration from 1 February 1987 until 31 January 1988. The budgets are based on a 25-h out-put frequency of the instantaneous emissions. Compound T42 T21 T63 T63-T21 [%]1 C5H10 607.1 556.2 626.4 12.6 C10H16 143.1 128.6 148.5 15.5 ORVOC’s 254.6 227.2 266.2 17.2 NOx, soil 12.4 12.7 12.3 –3.1 NOx, canopy 8.4 8.6 8.3 –3.5 DMS 17.3 16.3 17.6 8.0 Dust 14322 – – – Seasalt 5906 (64, 5842)3 5199 (56, 5143) 6258 (68, 6190) Units are in Tg C/N/S/dust/sea salt
1
Relative difference relative to T21 budget
2
The dust emissions appear to be highly resolution dependent and are only presented for the T42 resolution, the resolution for which the emission scheme has been developed
3
ACPD
6, 5457–5483, 2006Offline and online emissions and dry deposition in MESSy L. N. Ganzeveld et al. Title Page Abstract Introduction Conclusions References Tables Figures J I J I Back Close
Full Screen / Esc
Printer-friendly Version Interactive Discussion
EGU (a)
(b)
Fig. 1. Relative change in annual mean SO2(a) and O3(b) dry deposition fluxes due to emitting
all SO2and O3precursors in the surface layer instead of including the recommended emission heights for technological and biomass burning emissions according to EDGARv3.2-FT2000. The white areas in the Artic in (a) denote relative differences ≤100%.