HAL Id: hal-00298232
https://hal.archives-ouvertes.fr/hal-00298232
Submitted on 10 Jan 2007
HAL is a multi-disciplinary open access
archive for the deposit and dissemination of
sci-entific research documents, whether they are
pub-lished or not. The documents may come from
teaching and research institutions in France or
abroad, or from public or private research centers.
L’archive ouverte pluridisciplinaire HAL, est
destinée au dépôt et à la diffusion de documents
scientifiques de niveau recherche, publiés ou non,
émanant des établissements d’enseignement et de
recherche français ou étrangers, des laboratoires
publics ou privés.
stress indicator
F. T. Freund, A. Takeuchi, B. W. S. Lau, A. Al-Manaseer, C. C. Fu, N. A.
Bryant, D. Ouzounov
To cite this version:
F. T. Freund, A. Takeuchi, B. W. S. Lau, A. Al-Manaseer, C. C. Fu, et al.. Stimulated infrared
emission from rocks: assessing a stress indicator. eEarth, 2007, 2 (1), pp.7-16. �hal-00298232�
eEarth, 2, 7–16, 2007
www.electronic-earth.net/2/7/2007/ © Author(s) 2007. This work is licensed under a Creative Commons License.
eEarth
Stimulated infrared emission from rocks: assessing a stress indicator
F. T. Freund1,2, A. Takeuchi2,3, B. W. S. Lau2, A. Al-Manaseer4, C. C. Fu5, N. A. Bryant6, and D. Ouzounov71Ecosystems Science and Technology Branch, Code SGE, NASA Ames Research Center, Moffett Field, CA 94035-1000, USA
2Department of Physics, San Jose State University, San Jose, CA 95192-0106, USA 3Department of Chemistry, Niigata University, Ikarashi-ninotyo, Niigata 950-2181, Japan 4Department of Civil Engineering, San Jose State University, San Jose, CA 95192-0083, USA 5Department of Civil Engineering, University of Maryland, College Park, MD 20742, USA 6Jet Propulsion Laboratory, Org. 3880, Pasadena, CA 91109-8099, USA
7CEORS, George Mason University, Fairfax, VA 22030-4444, USA
Received: 16 May 2006 – Published in eEarth Discuss.: 24 July 2006
Revised: 7 November 2006 – Accepted: 13 December 2006 – Published: 10 January 2007
Abstract. To study the effect of stress-activated positive hole (p-hole) charge carriers on the infrared (IR) emission from rocks, we subjected a portion (∼10 vol.%) of a large (30×60×7.5 cm3)block of anorthosite, a nearly monomin-eralic (Ca-rich feldspar) igneous rock, to uniaxial deviatory stress up to failure. We measured the IR emission from a flat surface ≈40 cm from the stressed rock volume over the 800–1300 cm−1 (7.7–12.5 µm) range. Instantly, upon loading, the emission spectrum and intensity change. At first narrow bands appear at 930 cm−1(10.75 µm), 880 cm−1 (11.36 µm), 820 cm−1 (12.4 µm) plus additional narrow bands in the 1000–1300 cm−1 (7.7–10.0 µm) range. The 10.75–12.4 µm bands are thought to arise from vibrationally excited O-O stretching modes, which form when p-hole charge carriers, which spread from the stressed rock volume into the unstressed rock, recombine at the surface. They ra-diatively decay, giving rise to “hot” bands due to transitions between excited states. Before failure the broad emission bands at 1170 cm−1 and 1030 cm−1 (8.7 and 9.7 µm) also increase slightly in intensity, suggesting a small increase in temperature due to thermalization of the energy deposited into the surface through p-hole recombination. Stimulated IR emission due to hole-hole recombination and its follow-on effects may help understand the enhanced IR emissifollow-on seen in night-time satellite images of the land surface before major earthquakes known as “thermal anomalies”.
Correspondence to: F. T. Freund
1 Introduction
In this paper we describe a laboratory experiment that may help understand the cause for the non-stationary, transient areas of enhanced IR emission from the land surface, which have been recognized since the late 1980s and early 1990s in night-time satellite images and linked to impending earth-quake activity (Gornyi et al., 1988; Qiang et al., 1991, 1990; Srivastav et al., 1997). The reported increase in surface tem-peratures reach 2–4◦C, occasionally higher. Such areas of enhanced IR emission are referred to as “thermal anomalies”. The phenomenon of thermal anomalies has remained enig-matic (Cui et al., 1999; Srivastav et al., 1997; Tronin, 2000, 2002; Tronin et al., 2004). In many cases the reported in-crease in temperature seems to correlate poorly with meteo-rological ground data. The rapidity with which the thermal anomalies appear and disappear rules out that they are caused by a flow of Joule heat from a source deep below that would heat the rocks. Several other processes have been invoked to account for the reported temperature increase: (i) rising flu-ids that could lead to the emanation of warm gases (Gorny et al., 1998); (ii) rising well water levels and changing moisture contents in the soil (Chadha et al., 2003); (iii) diffuse CO2 emanation, causing a “local greenhouse” effect (Quing et al., 1991; Tronin, 1999, 2002); (iv) Near-ground air ionization due to enhanced radon emission leading to the condensation of water vapor from the atmosphere and, hence, to the re-lease of latent heat (Pulinets et al., 2005). However, at closer inspection, none of these explanations seem to be able to ad-equately account for characteristic features of the “thermal anomalies”.
Here we report on a laboratory experiment conducted to test a very different hypothesis: could it be that the enhanced
60 cm
Rock
11.5 cm Ø Piston Piston electrical insulation 3 0 c m BOMEM Spectrometer ~ 1 mRock
Fig. 1a. Schematic of the set-up used to measure the IR emission from the flat front face of a 60×30×7.5 cm3block of anorthosite, loaded over 40 cm away from the emitting rock surface.
IR emission from the Earth’s surface arises from electronic charge carriers from deep within the Earth’s crust when rocks are subjected to increasing stresses prior to large earth-quakes? We know that such electronic charge carriers are activated by stress and that they are highly mobile (Freund, 2002). We know that they diffuse rapidly to the surface where they become trapped (Freund et al., 2006; Takeuchi et al., 2006). The question that we seek to answer by our ex-periment is: do these electronic charge carriers recombine at the rock surface leading to a diagnostically distinct IR emis-sion in the region of the thermal infrared?
2 Experimental part
Our sample was a block of anorthosite from Larvik, Norway, available under the trade name “Blue Pearl”. Anorthosite is an igneous monomineralic feldspar rock composed mainly of Ca-rich plagioclase labradorite. The rock we used was coarse-grained with crystals up to 2–4 cm in size with a den-sity of 2.7 g/cm3and an unconstrained compressive strength of 181–187 MPa.
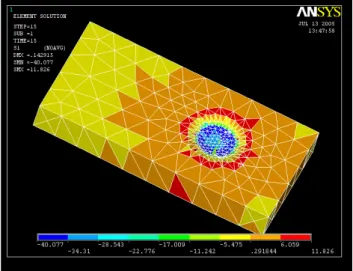
We uniaxially stressed a relatively small subvolume, 10– 12 vol.%, of an air-dry anorthosite slab, 60×30×7.5 cm3, via a pair of pistons (11.25 cm diameter), electrically insulated from the rock through 0.8 mm thick sheets of high density polyethylene with a resistivity of >1014 cm. We applied the load off-center as sketched in Fig. 1a, about one piston diameter away from the edges and about four piston diame-ters (>40 cm) away from the surface, which emitted the IR radiation measured during our experiment. Figure 1b depicts the distribution of the principal stress as obtained by finite element analysis. The off-center loading concentrated the stresses in the back portion of the slab and kept the emit-ting front surface of the slab essentially stress-free, especially during the early phase of the loading run when the absolute stresses are still relatively small. We applied the load at a
Fig. 1b. Finite analysis representation, using a variable grid size, of the stress distribution in the anorthosite block during asymmetric loading. Yellow to blue signify compressive stresses, yellow to red tensile stresses. The surface from where the IR emission is mea-sured (circular, 5 cm diameter, ∼20 cm2) is on the hidden surface on the upper left.
constant rate of 6.3 MPa/min up to failure, using a hydraulic SATEC press, model RD 2000 kN.
Emission spectra were recorded off a circular area, 5 cm diameter, from the flat front face of the rock, smooth “as re-ceived”, i.e. as cut with a diamond saw. We used a Bomen MB-100 FT-IR spectroradiometer equipped with a Peltier-cooled HgCdTe detector and two integrated blackbody emit-ters for internal calibration, one at ambient temperature, the other at 60◦C, collecting the IR radiation sequentially from the sample and the two blackbody emitters. This Bomen MB-100 has been used extensively for laboratory and field calibrations for NASA’s MODIS spectrometers currently fly-ing on the TERRA and AQUA satellites (Li et al., 1999; Wan et al., 1996).
During our experiment the laboratory was semi-darkened. The space between rock and spectroradiometer, about 1 m, was shielded from ambient light. The temperature in the lab-oratory was stable. As an additional precaution the move-ment of all personnel during the 36 min long run was re-stricted to avoid changes in the reflected IR radiation field.
The spectra were recorded over the wavenumber range 700–1400 cm−1(7.14–14.25 µm) at 2 cm−1resolution. Each FT-IR file consists of 25 scans off the rock surface plus 5 scans off the ambient temperature blackbody and 5 scans off the 60◦C blackbody emitters for temperature calibration. It took 40 s to acquire and store each file. The radiometric noise at the single scan level was ∼100 mK, improving to ∼50 mK upon averaging 25 scans and to ∼10 mK upon averaging 250 scans. The run lasted a total 2200 s (36 min 40 s), during which 250 scans or 10 files were recorded during the first 400 s (6 min 40 s) without applying a load.
F. T. Freund et al.: Stimulated infrared emission from rocks 9 20.75 20.80 20.85 20.90 20.95 800 900 1000 1100 1200 1300
R
a
d
ia
te
d
I
n
te
n
s
it
y
[
°
C
]
Wavenumbers [cm
-1]
9.7 µm 8.5 µm 10.75 µmAnorthosite
Pre-load spectrum Run #12Fig. 2. IR emission spectrum at room temperature (average of 10 files of 25 scans each) from the flat front surface of the anorthosite block before loading.
The IR flux emitted from the rock surface was calculated in brightness temperature TB with reference to the
built-in calibration emitter surfaces, usbuilt-ing the same algorithm as for MODIS calibration runs. TB is an energy scale widely
used in remote sensing, where the intensity at frequency ν is defined as Iν=Bν (TB)with Bν in units of [Joule s−1m−1
ster−1Hz−1] given as Bν≈2ν2kTB/c2, with k the Boltzmann
constant, TB the absolute temperature, and c the speed of
light. Expressing TB in terms of wavelength λ, we obtain
TB≈[λ4/2 kc] I
λ. This relation shows that, while TBdepends
on the fourth power of the wavelength of the emitted light, changes in the actual (Joule) temperature will cause smooth intensity changes over the entire spectral range.
3 Results
Figure 2 shows the pre-loading room temperature (300 K) IR emission spectrum of the anorthosite from 800 to 1300 cm−1 (7.7–12.5 µm), averaged from the 250 pre-loading scans (10 files). The spectrum has two maxima, around 1030 and 1170 cm−1 (9.7 and 8.5 µm, respectively), plus a smaller emission peak around 1110 cm−1(9.0 µm). These bands are characteristic of Si–O and Al–O stretching modes emitted from the first few µm of the rock surface (Johnson et al., 2002). This room temperature emission is caused by down-ward transitions of 3-dimensionally coupled Si–O and Al–O stretching modes, primarily from their populated first vibra-tionally excited states thermally at 300 K, e.g. from quantum number n=1, to the ground state n=0.
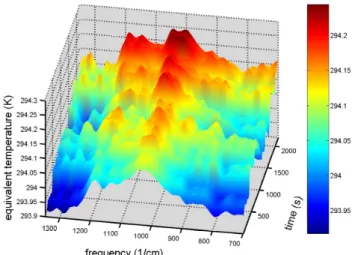
Fig. 3a. 3-D plot of the intensity evolution and spectral changes of the IR emission between 700–1350 cm−1(7.37–14.3 µm) from the front face of the anorthosite block before and during loading up to failure, plotted as a function of time during loading (for details see text). The color scale is given in degrees K and is meant to emphasize the changing intensities.
Fig. 3b. Difference plot of the intensity evolution and spectral changes of the IR emission from the front face of the anorthosite block obtained by subtracting each file recorded during loading from the average of the pre-load files. The color scale is given in degrees mK and is meant to emphasize the changing excess inten-sities.
Figure 3a shows a 3-D plot of the intensity variations over the 7.4–14.3 µm range (700 to 1350 cm−1)as a function of time. The intensity axis is given in units of brightness tem-perature, TB. The time axis is labeled in seconds. During
the first 6 min 40 s, as we acquired 250 pre-load scans (10 files) with no stress applied, the emitted IR intensity is con-stant. This is consistent with a stable ambient temperature environment in the laboratory and the absence of any other
293.9 294 294.1 294.2 294.2 294.3 294.4 294.5 50 60 70 80 90 100 800 900 1000 1100 1200 1300
In
te
n
s
it
y
[
K
]
D
if
fe
re
n
c
e
[
m
K
]
Wavenumber [cm
-1]
Anorthosite
IR Emission
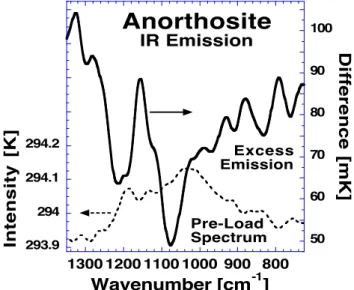
Pre-Load Spectrum Excess EmissionFig. 4. Total excess intensity emitted over the 7.37–14.7 µm range from the front face of the anorthosite block during loading (solid line) compared to the pre-load spectrum (dotted line).
perturbations. After 6 min 40 s we began to apply the load and immediately saw a change in the spectral signature, in particular new narrow emission bands, plus an overall crease in IR intensity. Upon increasing the load, the in-tensities fluctuate. Such fluctuations had already been ob-served during earlier IR emission experiments with granite (Freund et al., 2002b, 2003). The IR intensity fluctuations resemble current fluctuations observed during measurements of “battery currents”, which flow out of a stressed rock vol-ume through the unstressed rock (Freund et al., 2004, 2006). The difference spectra in Fig. 3b show the excess intensity emitted over the spectral range as a function of time. The difference spectra were obtained by subtracting the average of the first 250 pre-load scans (10 files) from each of the files acquired during loading up to failure. There are three out-standing features:
1. Narrow emission bands appear immediately upon load-ing, specifically three bands in the 800–950 cm−1range (10.5–12.5 µm) plus narrow bands at higher wavenum-bers (shorter wavelengths).
2. The intensity fluctuations as a function of time are synchronous across the entire spectral range, though the fluctuations of different bands are not evenly dis-tributed.
3. The excess intensity emitted during loading is concen-trated at wavelengths that are different from those of the two emission maxima in the pre-load emission spec-trum.
This last point is highlighted in Fig. 4 where we super-pose the pre-load 300 K spectrum and the excess IR
inten-sity integrated over the entire run. The narrow emission bands are preserved even after integration, in particular the three diagnostically significant bands in the 800–950 cm−1 (10.5–12.5 µm) range, plus a prominent narrow band around 1150 cm−1 (8.7 µm). While the pre-load spectrum exhibits intensity maxima at 1030 cm−1 and 1170 cm−1 (9.7 and 8.5 µm), the excess emission has minima near these same wavenumber/wavelength values.
During two earlier measurement sessions with granite we already had the opportunity of record the IR emission from the surface of a large block of rock stressed a distance away from the emitting surface. We observed similar spectral fea-tures, in particular narrow emission bands at the start of load-ing (Freund et al., 2002a, 2003). Granite contains about 1/3 quartz, 1/3 plagioclase feldspar and 1/3 potassium feldspar. Similar to the observation reported here, excess IR was emit-ted in narrow bands in the 800–950 cm−1 (10.5–12.5 µm) range plus some bands in the 1150 cm−1(8.7 µm) range. The present results confirm these earlier observations, though the narrow emission bands from granite occurred at slightly dif-ferent wavenumbers, within ∼10 cm−1, probably due to its more complex mineralogy.
4 Discussion
Rock fracture experiments as described in the literature are typically performed under conditions emulating ASTM C170-50 and DIN 52102 procedures, i.e. with cylindrical test samples loaded over their entire cross section (Brady and Rowell, 1986; Lockner, 1993; Rowell et al., 1981; Warwick et al., 1982; Yoshida and Ogawa, 2004).
Loading unconstrained cylindrical samples over their en-tire cross sections creates conditions that are very different from those described here and different from pre-earthquake conditions in the field. In the field, the rocks deep in the Earth’s crust are subjected to increasing stress, while obser-vations are made off the Earth’s surface, far from the stressed rock volume. In the experiment described here we subject a relatively small subvolume of the large rock sample to de-viatory stresses, thereby activating mobile electronic charge carriers. We thus create a gradient in the concentration of these charge carriers between the subvolume and the sur-rounding unstressed rock. No mechanical forces act on the surface from where the IR emission occurs. In the case of cylinders loaded over their entire cross section, the face bulges outward, leading to tensile stresses in the sur-face, which in turn lead to microfracturing. Microfractur-ing is known to cause visible and IR emission over a broad spectral range (Brady and Rowell, 1986) due to a number of physical processes that take place in the opening cracks such as electric discharges, electron and atom or molecule emis-sions, ionization and electronic excitations, etc. (Dickinson, et al., 1986). Only the stressed rock volume emits light dur-ing these processes and the spectral composition of this light
F. T. Freund et al.: Stimulated infrared emission from rocks 11
is very different from the narrow band IR emission reported here.
The experiment presented here was designed from the be-ginning in such a way that the stresses generated during load-ing would be confined to the back portion of the slab and would not extend to the surface that emitted the IR emission radiation. Because of the large distance between the emitting surface and the stressed rock volume, >40 cm, we can rule out that frictional heat generated in the stressed rock could diffuse to the emitting surface within 40 s, the time needed to acquire 25 scans with the Bomen FT-IR spectroradiometer and to convert them into one file. Hence, under our condi-tions, the IR emission from the front surface of the block, cannot be due to Joule heat diffusing from the stressed sub-volume to the emitting surface.
Another possibility is that, upon loading the subvolume, gases and possibly liquids contained in its pore space might be expelled and travel as a pressure wave through the pore space in the remainder of the rock, inducing rapid changes far from the stressed subvolume. However, we can discount this process on the basis of two arguments: (i) given the ge-ometry of our rock sample and stress distribution illustrated by Fig. 1b, such a pressure wave, if it forms, would more likely discharge through the near-by surfaces under tensile stress rather than travel to the surface furthest from the stress subvolume; (ii) even if the pressure wave arrives at the emit-ting surface, it would more likely cool the surface through adiabatic decompression than cause the emission of excess IR intensity in the form of specific narrow bands.
Neither diffusion of frictional heat to the rock surface nor the arrival of a pore gas pressure wave can account for ob-served changes in the IR emission characteristics. Hence we conclude that there must be another process capable of trans-porting energy rapidly from the stressed rock subvolume to the rock surface, over a distance of >40 cm, and of causing the observed changes, both spectral and intensitywise, in the IR emission.
A candidate for such a process, for which we have strong supporting evidence, is the flow of electronic charge carri-ers from the stressed subvolume to the rock surface. Such charge carriers have been shown to exist in igneous rocks such as anorthosite, albeit in a dormant, electrically inactive form (Freund, 2002; Freund et al., 2006, 2004). In the fol-lowing we briefly review what these charge carriers are and what is already known about them.
It is widely assumed in the geoscience community that oxygen anions in naturally occurring minerals are fixed in their 2-valence state. However, it has been shown some time ago that a reaction exists by which oxygen anions can change their valence from 2- to 1- (Freund and Wengeler, 1982; Martens et al., 1976). The reaction involves hydroxyl pairs, which are ubiquitous in all minerals that have crystallized in the presence of H2O, even those that are nominally anhy-drous. Hydroxyl pairs in the matrix of these nominally
an-hydrous minerals can split off H2while simultaneously con-verting their O2−to the 1- (peroxy) state (Freund, 1985).
A single O− in a matrix of O2−represents a defect elec-tron, resident in the valence band of otherwise insulating ma-terials, also known as a positive hole or p-hole for short. Nor-mally O−form pairs, which we call positive hole pairs, PHP. In oxide materials the PHPs form peroxy anions, O2−2 (Batllo et al., 1991; Freund et al., 1993). In silicate minerals they form peroxy links, O3X/OO\XO3 with X=Si4+, Al3+ etc. Peroxy links in fused silica have attracted a large amount of attention because, when present in fused silica optical fibers exposed to high energy γ - or x-rays in space, they lead to color centers with an intense, broad absorption in the visible and near-IR regions (Edwards and Fowler, 1982; Ricci et al., 2001). The same peroxy links in fused silica generate mobile p-hole charge carriers when heated (Freund, 1985). Minerals that crystallize in the presence of H2O invariably always in-corporate some “water” in the form of hydroxyl (Ingrin and Skogby, 2000; Wilkins and Sabine, 1973). Hydroxyl pairs in the matrix of these minerals are thought to convert to peroxy links (Freund, 1985). This makes all igneous and high-grade metamorphic rocks candidates for containing PHPs (Freund, 2003).
As long as the O− exist in the PHP or peroxy state, the p-holes are self-trapped and, hence, electrically inactive. When deviatory stresses are applied, the rocks begin to plas-tically deform through dislocations moving in large numbers through the mineral grains (Miguel et al., 2001; Moore and Lockner, 1995; Ohnaka, 1995). When moving dislocations intersect the PHPs, they instantly cause them to break apart and to release p-hole charge carriers (Freund et al., 2006).
As defect electrons in the valence band of the otherwise in-sulating silicate minerals the p-holes can move on the O 2sp-dominated levels close to the upper edge of the valence band by exchanging an electron with a neighboring O2−. Theo-retically the speed with which the p-holes could travel is on the order of 300 m/s, consistent with the group velocities in the range of 100–300 m/s measured experimentally (Freund, 2002). Because the valence band forms an energetic contin-uum the p-holes can jump grain boundaries. In experiments such as described here, where we stress a portion of a larger slab of rock, the p-holes can flow out of the stressed volume and into unstressed rock (Freund et al., 2006). When they reach the surface, they form a positive charge layer (Freund et al., 1993; King and Freund, 1984). Positive surface charges have also been observed during fracturing (Enomoto et al., 1993). Surface potentials measured under open circuit condi-tions can reach +1.5 V to +1.75 V. Charge densities on freshly fracture surfaces have been given as 10−5 Coulomb/m2 or 1013–1014 p-holes/m2 (Takeuchi et al., 2006; Takeuchi and Nagahama, 2002b). The charge carrier densities at the rock surface achieved under conditions such as in our experiment may be lower, but the measured values give an estimate, by order of magnitude, of the number of p-hole charge carriers available at the rock surface.
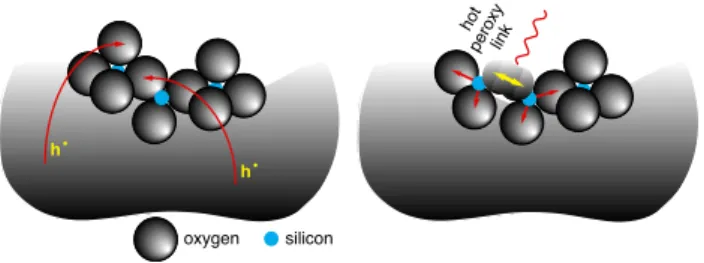
h• h• oxygen silicon hot pe roxy link
Fig. 5. Schematic representation of a mineral surface to illustrate the processes that may take place when p-holes (h) arrive at the surface (left). When the two p-holes recombine, recombination en-ergy is released, leading to a vibrationally highly excited O-O bond, which can de-excite radiatively by emitting IR photons character-istic of transitions the energy levels of the O–O bond, and non-radiatively by channeling energy into neighboring bonds (right).
Of particular interest to the IR emission is the fact that it costs energy to break a peroxy bond. This energy is expended in the stressed rock volume in the form of mechanical work dispensed during plastic deformation. If the p-holes recom-bine at the surface to restitute peroxy bonds, some of this energy will be regained. However, this recombination en-ergy will be deposited into the newly formed O−-O−bonds, causing them to be “born” in a vibrationally highly excited state.
To estimate the energies involved we need to know at least approximately the O-O bond energy. The energy needed to photodissociate a peroxy link in fused silica is relatively high, 9.4 eV (Nishikawa et al., 1990). By contrast, the acti-vation energy to thermally split a peroxy bond is much lower, on the order of 2.4 eV (Freund et al., 1993). The large dif-ference is due to the fact that, during photodissociation, elec-trons must be excited across the large band gap at the same k-value in reciprocal space. By contrast, thermal bond break-up can be achieved through excitation of vibrational modes irrespective of the k-value in reciprocal space. When a bond breaks during the passage of a dislocation, i.e. during me-chanical deformation, we expect the energy required to be similar to that of thermal break-up, i.e. around 2.4 eV. In ad-dition we note that the energy of the peroxy bond as well as the O-O bond distance depend only weakly on the surround-ing, i.e. they are closely the same for peroxy anions in the matrix of MgO and for peroxy links in matrix of fused silica. Without loss of generality we can extend this argument to silicate minerals and, by extension, to rocks (Freund, 2003). Hence, we adopt a value around 2.4 eV as the maximum en-ergy that can become available when p-holes recombine at our rock surface to form PHPs.
In Fig. 5 we represent the rock surface by three corner-linked SiO4 tetrahedra, two of which terminate with non-bonded oxygens. Typical distances between adjacent O2− are on the order of 2.8 ˚A. On the left we show two p-holes arriving at the surface and settling on two adjacent oxygen anions changing them from O2− to O−. On the right we
show these two O−snapping together to form the very short, ∼1.5 ˚A, O−–O−bond characteristic of peroxy links (Ricci et al., 2001).
If an energy up to 2.4 eV is released during p-hole recom-bination, the new O−-O− bond will be “born” in a vibra-tionally highly excited state. Due to its high frequency, such an excited state will be largely decoupled from the thermal vibrations of the surrounding matrix. To dissipate the ex-cess energy two decay channels are available: (i) radiative decay by emitting photons at the characteristic energies of transitions within the O-O vibrational manifold or (ii) non-radiative decay by channeling energy onto neighboring Si-O and Al-O bonds. Those neighboring bonds in turn become excited and will emit at their characteristic vibrational fre-quencies.
As mentioned above the room temperature emission spec-trum such as shown in Fig. 2 arises from downward transi-tions of vibrational modes from levels that are thermally ex-cited at the temperature of 300 K. The probability to populate the levels En above the ground state Eois given by a
Boltz-mann distribution, exp[−(En–E0)/kT] where k is the Boltz-mann constant and T the absolute temperature. We are in-terested in the IR emission around 1000 cm−1or 10 µm. In this wavenumber or wavelength range the energy levels are separated by ≈100 meV. However, the mean thermal energy available at 300 K, kT300K, is ≈25 meV. Hence, the proba-bility to populate the first excited level n=1 in the 10–12 µm region, is e−4≈2×10⁻²or ≈2%. To populate the second ex-cited level, n=2, ≈200 meV above E0, the probability drops to e−8≈10−4or ≈0.02% etc. Therefore, at thermal equilib-rium at 300 K, vibrational levels n=2 and higher are sparsely populated. In other words, nearly all IR intensity emitted at 300 K is due to downward transitions from the n=1 level to the n=0 ground level. If higher vibrational levels can be ex-cited by some other, non-thermal process, downward transi-tions will occur between the higher levels, for instance from n=2 to n=1 or n=3 to n=2, etc. Those emission bands are called “hot bands”.
Remarkable about the difference spectra in Fig. 3b is that they clearly show narrow emission bands appearing al-ready at the very beginning of loading. In particular we point to the three narrow bands toward the right. The band at 930 cm−1(10.75 µm) is consistent with the fundamental stretching mode of the O−-O− bond, arising from n=1 to n=0 transitions of peroxy links. The energy of this transi-tion for O3Si/OO\SiO3in amorphous SiO2 has been deter-mined by high level quantum-mechanical calculations to be 920–930 cm−1 (10.75–10.87 µm) (Ricci et al., 2001). The energies of “hot” transitions, from n=2 to n=1 and from n=3 to n=2, have not yet been calculated, However, they are ex-pected to lie at slightly lower wavenumbers (longer wave-length) due to the asymmetry of the potential describing the O-O bond.
The energy V as a function of interatomic distance r of a diatomic oscillator such as O-O can be described by a Morse
F. T. Freund et al.: Stimulated infrared emission from rocks 13
potential, V(r)=Dc{1–exp[–α(r-r0)/r0]}, where Dcis the
dis-sociation energy, r0the equilibrium distance, and α an ad-justable constant. The Morse potential is a parabola that opens asymmetrically to one side. The eigenvalues, which can be obtained by solving the Schr¨odinger equation for the system, show a sequence of energy levels ever more narrowly spaced the higher the level n of vibrational excitation. If the narrow band at 930 cm−1 in Figs. 3a, b is the fundamental arising from n=1 to n=0 transitions, then the narrow bands at 870 cm−1(11.5 µm), and 810 cm−1(12.35 µm) are con-sistent with “hot” bands arising from n=2 to n=1 and n=3 to n=2 transitions respectively. In other words, these bands come from suprathermal transitions and suggest emissions that involve vibrationally excited states higher than n=2.
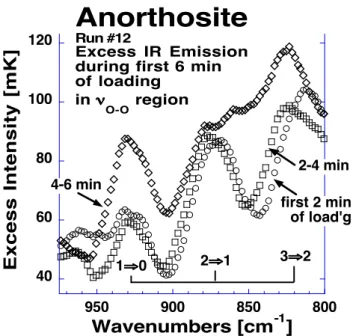
The intensity evolution of the three bands at 930 cm−1 (10.75 µm), 870 cm−1(11.5 µm), and 810 cm−1(12.35 µm) is plotted in Fig. 6 for the first three 2-min intervals after be-ginning of loading. The bands at 810 cm−1(12.35 µm) and 870 cm−1(11.5 µm), which we assign to hot transitions, ex-hibit high intensities in the beginning. Later the fundamental at 930 cm−1(10.75 µm) gains intensity in relative and abso-lute terms, while the hot bands seem to merge.
The narrow bands in the 1000–1200 cm−1 (8.3–10 µm) range in Fig. 3b display a similar intensity evolution as a function of time and load. They are consistent with the con-cept shown in Fig. 5 depicting (on the right) that the vi-brationally excited O−-O− bond channels energy onto its Si-O neighbors, probably through combination with phonon modes. This causes those neighboring bonds to become ex-cited and emit at their own characteristic frequencies.
In Fig. 4 we integrated the excess intensity emitted over the course of the experiment, from the beginning of load-ing to failure of the rock. The excess intensity curve ex-hibits narrow maxima around 1150 and 1300 cm−1(7.7 and 8.7 µm, respectively) but minima close to where the 300 K spectrum has its broad emission maxima. This suggests that the energy gained by p-hole recombination at the surface is primarily used to excite local oscillators. While they give rise primarily to non-thermal emissions, they do not excite the pool of 3-dimensionally coupled lattice modes, i.e. they do not “heat” the surface. This is consistent with the state-ment made above that vibrationally highly excited levels are largely decoupled from the lattice modes that vibrate at their fundamental frequencies at 300 K. As a result the excess en-ergy deposited during p-hole recombination into the newly born O−-O−bonds is mainly radiated off as narrow-band IR
photons at 930 cm−1 (10.75 µm), 870 cm−1(11.5 µm), and 810 cm−1 (12.35 µm) and others at lower wavenumbers or longer wavelengths, which we did not measure in our exper-iment. A fraction of this energy is used to selectively excite next-nearest neighbor Si–O and Al–O bonds.
As this process continues, the next-nearest neighbor Si–O and Al–O bonds will in turn “kick” their neighbors and trans-fer energy to them so that they transition from their ground state n=0 to the first excited state n=1. In other words, the
40 60 80 100 120 800 850 900 950
E
x
c
e
s
s
I
n
te
n
s
it
y
[
m
K
]
Wavenumbers [cm
-1]
first 2 min of load'g 2!1 1!0 3!2 2-4 minAnorthosite
Run #12 Excess IR Emission during first 6 min of loadingin "
O-O region
4-6 min
Fig. 6. Evolution of the IR emission bands in the spectral range expected to contain the O-O fundamental and “hot bands” during the first 6 min of loading, broken down in 2 min intervals.
energy deposited into local O-O vibrations will eventually flow into the 3-dimensionally coupled lattice vibrations, i.e. thermalize and thereby cause the overall energy, kT, in a thin surface layer to increase. As Figs. 3a, b indicate, this ther-malization and increase in kT are most pronounced shortly before failure of the rock.
Hence, the observations presented here support our propo-sition that the emission spectrum of the anorthosite rock dur-ing stressdur-ing is at first dominated by non-thermal processes, giving rise to the series of narrow emission bands that include “hot” bands. The “hot” bands can be described as “stimu-lated IR luminescence” due to exothermal p-hole recombi-nation at the surface. Later, as more and more p-holes arrive at the rock surface and recombine, the energy deposited into the O-O bonds begins to spread out and thermalize. This causes an overall, albeit small, increase in kT, i.e. an increase in the actual temperature of a thin surface layer.
To estimate how much energy can be radiated during p-hole recombination we need to know (i) how many p-p-holes arrive at the surface and (ii) how much energy is released per p-hole recombination event.
(i) For a surface across a dielectric contrast from ε=10 to
ε=1 theory predicts the build-up of a surface poten-tial on the order of +0.4 V (King and Freund, 1984). Pulse-like values as high as +12 V to +17 V have been observed experimentally during crack formation (Enomoto et al., 1993; Freund et al., 2004). Steady state surface potentials reach values up to +0.1 V to +1.5 V depending on the geometry of the capacitive sensor, im-plying charge carrier densities of ≈10−5Coulomb m−2,
equivalent to ≈1013 charges m−2 (Freund, 2002; Fre-und et al., 2006; Takeuchi et al., 2006; Takeuchi and Nagahama, 2002a, b).
(ii) We can estimate how many p-hole recombination events are needed to produce a 0.15 K increase of radiation temperature. The activation energy for breaking a per-oxy bond is ≈2.4 eV (Freund, 2003). If this energy were to be fully regained during p-hole recombination, each recombination event would release 2.4 eV, equivalent in terms of thermal energy kT to ≈10 000 K. This means that ≈105 recombination events spread over a surface area of 20 cm2(the size of our emitting surface) would suffice to increase the radiative temperature by 0.1 K.
Our emitting surface of 20 cm2contains ≈1016O2−anions. Accepting a charge carrier density of ≈10−5Coulomb m−2 or ≈1013 charges m−2 (Takeuchi and Nagahama, 2002b), such a surface of 20 cm2 will reach a surface potential of 1 V when ≈1010 p-holes have arrived. Since we estimated that as few as ≈105recombination events per unit time are needed to increase the radiative temperature of our emitting surface by 0.1 K, only a very small fraction of the p-holes, which reach the surface, ≈10−5, need to participate at any time in the IR emission process.
Such an order-of-magnitude estimate gives us confidence that the proposed mechanism for the observed increase in ra-diative temperature lies within the limit of our basic assump-tions. We note that the rock surface, which emitted the IR ra-diation in our experiment, was smooth. If it had been rougher by a geometric factor of about 10, the radiative IR flux would probably have increased by approximately the same factor to an equivalent temperature around 2 K, closer to the 2–4◦C temperature increases reported for the “thermal anomalies” before major earthquakes.
5 Conclusions
We have presented here just one experiment conducted under specific laboratory conditions with a block of monomineralic anorthosite. Our paper necessarily leaves many questions un-addressed. However, we have demonstrated that, by stressing a small subvolume of the rock far away from the emitting sur-face, the IR emission changes with respect to both, spectral composition and intensity. The changes are consistent with a fundamental process, never before described, that involves vibrationally highly excited states of O-O bonds at the rock surface. The most convincing indicator of such a process is the appearance of distinct narrow band emissions at the be-ginning of our experiment. Subsequently, as more and more energy is deposited into the surface layer through the recom-bination of more p-holes, an overall temperature increase oc-curs, presumably due to thermalization of the vibrationally excited O-O states.
It is reasonable to assume that this energy, which first causes localized vibrationally excited states and then heats up the surface through thermalization, can be transferred across the rock-air interface to the air. Such a secondary or ter-tiary process would be consistent with the suggestions made by a number of authors that the “thermal anomalies” as de-rived from satellite data arise in the near-ground air (Dey and Singh, 2003; Parnell, 2002; Tronin, 2002; Tronin et al., 2004).
When we apply stress over 40 cm away from the emitting rock surface and observe within 40 s or less changes in the IR emission, we can say with confidence that both, the IR intensity and IR spectrum, are consistent with (i) the flow of p-hole charge carriers from the stressed rock volume to the emitting surface and (ii) an exothermal recombination of p-holes to form positive hole pairs, PHP. It is consistent with a radiative decay of the vibrationally excited O-O bonds and with the channeling of some of their excess energy onto neighboring Si–O and Al–O bonds and eventual thermaliza-tion. The surface that emits the IR radiation is clearly too far from the stressed rock volume for frictional heat to reach the surface within such a short time.
Obviously, the areas of the Earth where “thermal anoma-lies” are observed are much more complex that the surface of the rock sample that we studied in the laboratory. Their surfaces are formed mainly of sedimentary deposits, soil and sand, rarely bare rocks. Preliminary laboratory studies (un-published) have provided evidence that p-holes are capable of propagating through layers of soil and sand separating two blocks of rock and through layers of water.
The experiment described here and its interpretation sug-gest that p-holes provide a physically plausible mechanism to transport energy rapidly over macroscopic distances, from deep within the Earth’s crust to the surface. At least a part of this energy is released at the surface following conver-sion into IR photons of specific wavelengths. Though fur-ther experiments are obviously needed to address these and many other questions raised by the study presented here, it appears probable that the recombination of p-hole charge car-riers at the Earth’s surface is the primary driver behind the pre-earthquake “thermal anomalies” identified in satellite im-ages.
Acknowledgements. This work would not have been possible
without support from Z. Wan and his coworkers Y. Zhang and Q. Zhang, ICESS, University of California at Santa Barbara, who brought their BOMEN radiospectrometer and other radiometric equipment three times to our laboratory. They helped us perform the experiments but do not necessarily subscribe to our interpre-tation of the results. We thank Y. Fei, Geophysical Laboratory, Carnegie Institution of Washington, and M. Jhabvala, NASA Goddard Space Flight Center, for help during the early phase of this project. We thank two anonymous reviewers for their thoughtful comments. We acknowledge financial support by a grant from the NASA Ames Research Center Director’s Discretionary Fund. B. W. S. Lau was supported by a grant from the National Geospatial
F. T. Freund et al.: Stimulated infrared emission from rocks 15
Agency (NGA). A. Takeuchi acknowledges support from the Japan Society for the Promotion of Science (JSPS) for Young Scientists. Edited by: J.-P. Valet
References
Batllo, F., LeRoy, R. C., Parvin, K., Freund, F., and Freund, M. M.: Positive hole centers in MgO – correlation between magnetic susceptibility, dielectric anomalies and electric conductivity, J. Appl. Phys., 69, 6031–6033, 1991.
Brady, B. T. and Rowell, G. A.: Laboratory investigation of the electrodynamics of rock fracture, Nature, 321, 488–492, 1986. Chadha, R. K., Pandey, A. P., and Kuempel, H. J.: Search for
earth-quake precursors in well water levels in a localized seismically active area of Reservoir Triggered Earthquakes in India, Geo-phys. Res. Lett., 30, 69–71, 2003.
Cui, C., Zhang, J., Xiao, Q., Liu, Q., Luo, D. J., and Lu, Q.: Moni-toring the thermal IR anomaly of Zhangbei earthquake precursor by satellite Remote sensing technique, paper presented at ACRS, 1999.
Dey, S. and Singh, R. P.: Surface latent heat flux as an earthquake precursor, Nat. Hazards Earth Syst. Sci., 3, 749–755, 2003, http://www.nat-hazards-earth-syst-sci.net/3/749/2003/.
Dickinson, J. T., Jensen, L. C., McKay, M. R., and Freund, F.: The emission of atoms and molecules accompanying fracture of single-crystal magnesium oxide, J. Vac. Sci. Technol., 4, 1648– 1652, 1986.
Edwards, A. H. and Fowler, W. B.: Theory of the peroxy-radical defect in a-SiO2., Phys. Rev. B Solid State, 26, 6649–6660, 1982. Enomoto, Y., Akai, M., Hashimoto, H., Mori, S., and Asabe, Y.: Exoelectron emission: Possible relation to seismic geo-electromagnetic activities as a microscopic aspect in geotribol-ogy, Wear, 168, 135–142, 1993.
Freund, F.: Conversion of dissolved “water” into molecular hydro-gen and peroxy linkages, J. Non-Crystalline Solids, 71, 195–202, 1985.
Freund, F.: Charge generation and propagation in rocks, J. Geody-namics, 33, 545–572, 2002.
Freund, F., Freund, M. M., and Batllo, F.: Critical review of electri-cal conductivity measurements and charge distribution analysis of MgO, J. Geophys. Res., 98, 22 209–22 229, 1993.
Freund, F. T., Jhabvala, M., La, A., Shu, P., Tsay, S., Ouzounov, D., and Fei, Y.: Mid-infrared luminescence observed during rock de-formation, paper presented at Spring Meeting, Amer. Geophys. Union, Washington, D.C., 2002a.
Freund, F. T., Ouzounov, D., Freund, M. M., Wan, Z., Zhang, Q., Zhang, Y., Jhabvala, M., La, A., McClare, M., Velle, A. M., Fei, Y., and Tsay, S.: Mid-Infrared radiation, electric charges and acoustic emission during rock deformation, paper presented at Fall Meeting, Amer. Geophys. Union, Washington, D.C., 2002b. Freund, F. and Wengeler, H.: The infrared spectrum of OH– compensated defect sites in C-doped MgO and CaO single crys-tals, J. Phys. Chem. Solids, 43, 129–145, 1982.
Freund, F. T.: On the electrical conductivity structure of the stable continental crust, J. Geodynamics, 35, 353–388, 2003.
Freund, F. T., Ouzounov, D., Wan, Z., Zhang, Y., Zhang, Q., Post, R., Keefner, J., Mellon, J., and Al-Manaseer, A.: Stimulated IR emission from the surface of rocks during deformation, paper
presented at American Geophysical Union, Fall Meeting 2003, AGU, San Francisco, CA, 2003.
Freund, F. T., Takeuchi, A., Lau, B. W. S., Post, R., Keefner, J., Mel-lon, J., and Al-Manaseer, A.: Stress-induced changes in the elec-trical conductivity of igneous rocks and the generation of ground currents, Terrestrial, Atmospheric and Oceanic Sciences (TAO), 15, 437–468, 2004.
Freund, F. T., Takeuchi, A., and Lau, B. W.: Electric currents streaming out of stressed igneous rocks – A step towards un-derstanding pre-earthquake low frequency EM emissions, Phys. Chem. Earth, 31, 389–396, 2006.
Gornyi, V. I., Salman, A. G., Tronin, A. A., and Shilin, B. B.: The Earth’s outgoing IR radiation as an indicator of seismic activity, Proc. Acad. Sci. USSR, 301, 67–69, 1988.
Ingrin, J. and Skogby, H.: Hydrogen in nominally anhydrous upper-mantle minerals: concentration levels and implications, Euro-pean J. Mineralogy, 12, 543–570, 2000.
Johnson, J. R., H¨orz, F., Lucey, P. G., and Christensen, P. R.: Ther-mal infrared spectroscopy of experimentally shocked anorthosite and pyroxenite: Implications for remote sensing of Mars, J. Geo-phys. Res., 107, 5073–5086, 2002.
King, B. V. and Freund, F.: Surface charges and subsurface space charge distribution in magnesium oxide containing dissolved traces of water., Phys. Rev., B29, 5814–5824, 1984.
Li, Z.-L., Becker, F., Stoll, M., Wan, Z., and Zhang, Y.: Channel selection for soil spectrum reconstruction in 8–13 µm region, J. Geophys. Res., 104, 22 271–22 286, 1999.
Lockner, D.: The role of acoustic emission in the study of rock fracture, Int. J. Rock Mechanics Mining Sci., 30, 883–899, 1993. Martens, R., Gentsch, H., and Freund, F.: Hydrogen release during the thermal decomposition of magnesium hydroxide to magne-sium oxide, J. Catalysis, 44, 366–372, 1976.
Miguel, M. C., Vespignani, A., Zapperi, S., Weiss, J., and Grass, J.-R.: Intermittent dislocation flow in viscoplastic deformation, Nature, 410, 667–671, 2001.
Moore, D. E. and Lockner, D. A.: The role of microcracking in shear-fracture propagation in granite, J. Struct. Geol., 17, 95– 114, 1995.
Ohnaka, M.: A shear failure strength law of rock in the brittle-plastic transition regime, Geophys. Res. Lett., 22, 25–28, 1995. Parnell, J.: Fluid Seeps at Continental Margins: towards an
Inte-grated Plumbing System,Geofluids, 2, 57–65, 2002.
Pulinets, S. A, Ouzounov, D., Ciraolo, L., et al.: Thermal, atmo-spheric and ionoatmo-spheric anomalies around the time of the Colima M7.8 earthquake of 21 January 2003, Ann. Geophys., 24, 835– 849, 2006,
http://www.ann-geophys.net/24/835/2006/.
Qiang, Z.-J., Xu, X.-D., and Dian, C.-D.: Thermal infrared anomaly – precursor of impending earthquakes, Chinese Sci. Bull., 36, 319–323, 1991.
Qiang, Z. J., Xu, X. D., and Dian, C. G.: Abnormal infrared ther-mal satellite-forewarning of earthquakes, Chinese Sci. Bull., 35, 1324–1327, 1990.
Quing, Z., Xiu-Deng, X., and Chang-Gong, D.: Thermal in-frared anomaly- precursor of impending earthquakes, Chinese Sci. Bull., 36, 319–323, 1991.
Ricci, D., Pacchioni, G., Szymanski, M. A., Shluger, A. L., and Stoneham, A. M.: Modeling disorder in amorphous silica with embedded clusters: The peroxy bridge defect center, Phys. Rev.
B, 64, 224 104–224 108, 2001.
Rowell, G. A., Brady, B. T., Yoder, L. P., and Hanson, D. R.: Pre-cursors of laboratory rock failure, in: Fracture Mechnanics for Ceramics, Rocks, and Concrete, edited by: Freiman, S. W. and Fuller, E. R., pp. 196–220, ASTM, Philadelphia, PA, 1981. Srivastav, S. K., Dangwal, M., Bhattachary, A., and Reddy, P. R.:
Satellite data reveals pre-earthquake thermal anomalies in Killari area, Maharashtra, Current Sci., 72, 880–884, 1997.
Takeuchi, A., Lau, B. W., and Freund, F. T.: Current and surface potential induced by stress-activated positive holes in igneous rocks, Phys. Chem. Earth, 31, 240–247, 2006.
Takeuchi, A. and Nagahama, H.: Interpretation of charging on frac-ture or frictional slip surface of rocks, Phys. Earth Planet. Inter., 130, 285–291, 2002a.
Takeuchi, A. and Nagahama, H.: Surface charging mechanism and scaling law related to earthquakes, J. Atmos. Electricity, 22, 183– 190, 2002b.
Tronin, A. A. (Ed.): Satellite thermal survey application for earth-quake prediction, 717–746 pp., Terra Sci. Publ., Tokyo, Japan, 1999.
Tronin, A. A.: Thermal satellite data for earthquake research, paper presented at IGARSS 2000, IEEE 2000 international geoscience and remote sensing symposium. Taking the pulse of the planet: the role of remote sensing in managing the environment, IEEE, Honolulu, HI, 2000.
Tronin, A. A.: Atmosphere-lithosphere coupling: Thermal anoma-lies on the Earth surface in seismic processes, in: Seismo-Electromagnetics: Lithosphere-Atmosphere-Ionosphere Cou-pling, edited by: Hayakawa, M. and Molchanov, O. A., 173–176, Terra Scientific Publ., Tokyo, 2002.
Tronin, A. A., Molchanov, O. A., and Biagi, P. F.: Thermal anoma-lies and well observations in Kamchatka, Int. J. Rem. Sens., 25, 2649–2655, 2004.
Wan, Z., Snyder, W., and Zhang, Y.: Validation of land-surface tem-perature retrieval from space, paper presented at IGARSS ’96: Remote Sensing for a Sustainable Future, Geoscience and Re-mote Sensing Symposium, IGARSS, Lincoln, NE, 1996. Warwick, J. W., Stoker, C., and Meyer, T. R.: Radio emission
associated with rock fracture: Possible application to the great Chilean earthquake of May 22, 1960, J. Geophys. Res., 87, 2851–2859, 1982.
Wilkins, R. W. T. and Sabine, W.: Water contents of some nomi-nally anhydrous silicates, Amer. Mineral., 58, 508–516, 1973. Yoshida, S. and Ogawa, T.: Electromagnetic emissions from dry
and wet granite associated with acoustic emissions, J. Geophys, Res., 109, B09204, doi:10.1029/2004JB003092, 2004.