1
Climate Ready Boston?: Identifying indicators to evaluate the City of Boston’s
efforts to implement its climate change adaptation initiatives
by Kara Runsten B.A. in Public Policy
Stanford University Stanford, California (2013)
Submitted to the Department of Urban Studies and Planning in partial fulfillment of the requirements for the degree of
Master in City Planning at the
MASSACHUSETTS INSTITUTE OF TECHNOLOGY June 2018
© 2018 Kara Runsten. All Rights Reserved
The author hereby grants to MIT the permission to reproduce and to distribute publicly paper and electronic copies of the thesis document in whole or in part in any medium now known or hereafter created.
Author___________________________________________________________________ Department of Urban Studies and Planning May 22, 2018 Certified by _______________________________________________________________ Professor Lawrence Susskind Department of Urban Studies and Planning Thesis Supervisor Accepted by______________________________________________________________ Professor of the Practice, Ceasar McDowell
Chair, MCP Committee Department of Urban Studies and Planning
2
Climate Ready Boston?: Identifying indicators to evaluate the City of Boston’s
efforts to implement its climate change adaptation initiatives
by Kara Runsten
Submitted to the Department of Urban Studies and Planning on May 22, 2018 in partial fulfillment of the requirements for the Degree of Master in City Planning
Abstract
As a leader in municipal climate change adaptation, the City of Boston has recently updated its climate projections, completed a climate vulnerability assessment, and identified several resilience initiatives. To understand whether these initiatives are leading to a less vulnerable, more resilient Boston, I offer a set of indicators the City can use to start monitoring and evaluating its adaptation efforts.
To create these indicators, I analyzed Boston’s vulnerability assessment and resilience plans to understand the types of hazards, risks, and actions the City intends to emphasize. I also
interviewed the authors of six recently published indicator frameworks for urban resilience developed by other cities, federal agencies, and nongovernmental groups. I combine the results of these inquiries into an explicit set of 20 indicators that Boston can use with its 2018 Climate
Action Plan (CAP), and update regularly thereafter. For each indicator, I identify a specific proxy metric and data source and include details on data collection, available scales, and limitations. Because many of my indicators are high-level and citywide, I also include sub-metrics that the City may use for a more in-depth analysis on the impacts of preparedness actions. Finally, I present several key findings for Boston and other cities thinking about creating, publishing, and maintaining their own set of indicators.
In addition to helping the city government monitor its efforts, the indicators I provide can be used by Boston citizens to hold elected and appointed officials accountable for their promises to create a more resilient city. Boston has taken a leadership role on climate change issues by positioning itself to be among the first cities (in the U.S. and internationally) to publish a monitoring and evaluation framework it will use to track the success of its adaptation efforts. Thesis Supervisor: Lawrence Susskind
3
Acknowledgments
I would like to thank my advisor Professor Larry Susskind and my reader Alison Brizius for their support in my endeavor to use this thesis to connect academia to practice. I have learned so much from their thoughtful input and hope the ideas put forth will prove useful in the City’s upcoming Climate Action Plan update. I would also like to thank Mia Mansfield for being a wonderful mentor and encouraging me in the thesis writing process. Finally, I am grateful to my family and friends and everyone I met in the 6th floor lounge of Building 9 during my residency there.
4
Table of Contents
Definitions………...………5
Part I: Introduction and Background…...7
Part II: The Boston Context……….……….…….20
Part III: Methodological Approach………30
Part IV: Overview of Boston’s Vulnerability Assessment………34
Part V: Review of Existing Adaptation Indicator Frameworks………...………..38
Part VI: Suggested Indicators and Metrics for Boston………..69
Part VII: Key Findings and Conclusion………...…113
References………128
Interviews……….134
Appendix A: Interview Guide……….……….135
5
Definitions
Adaptation: “The process of adjustment to actual or expected climate and its effects, in order to moderate harm or exploit beneficial opportunities” (Intergovernmental Panel on Climate Change [IPCC], 2012).
Adaptive Capacity: “The combination of the strengths, attributes, and resources available to an individual, community, society, or organization that can be used to prepare for and undertake actions to reduce adverse impacts, moderate harm, or exploit beneficial opportunities” (IPCC, 2012).
Evaluation: The “use of social research methods to systematically investigate the effectiveness of social intervention programs” (Rossi, Lipsey, and Freeman, 2004)
Exposure: “The presence of people; livelihoods; environmental services and resources;
infrastructure; or economic, social, or cultural assets in places that could be adversely affected” (IPCC, 2012).
Hazard: “The potential occurrence of a natural or human-induced physical event that may cause loss of life, injury, or other health impacts, as well as damage and loss to property, infrastructure, livelihoods, service provision, and environmental resources” (IPCC, 2012).
Indicator: A quantitative or qualitative variable that measures a particular phenomenon or attribute (adapted from U.S. Agency for International Development [USAID], 2009).
Metric: A standard of measurement (Merriam-Webster, 2018). For the purposes of this thesis, a metric is a proxy measure that is used to operationalize a higher-level indicator.
Monitoring: The consistent, periodic measurement of process and outcome results over time. Resilience: For the purposes of this thesis, the terms “resilience,” “adaptation,” and
“preparedness” will be used interchangeably; however, readers should note that resilience often is defined to encompass more than the response to climate change events and stresses. The Rockefeller Foundation’s 100 Resilient Cities program defines it as “the capacity of individuals, communities, institutions, businesses, and systems within a city to survive, adapt, and grow no matter what kinds of chronic stresses and acute shocks they experience” (100 Resilient Cities, n.d.)
6 Risk management (outcome) indicator: An indicator that measures the proximal and distal effects of implementing resilience actions. It is often only able to be measured after a shock or compounding number of chronic stressors.
Risk reduction (process) indicator: An indicator that monitors the progress in implementing resilience actions taken in anticipation of the worsening effects of climate-related hazards. Sensitivity: “The conditions, circumstances, and drivers that make people vulnerable to natural and economic stressors” (IPCC, 2012).
Vulnerability: “The degree to which a system is susceptible to, or unable to cope with, adverse effects of climate change, including climate variability and extremes” (IPCC, 2001). For the purposes of this thesis, vulnerability is the opposite of resilience.
7
Part I: Introduction and Background
The state of adaptation planning in the U.S.
With increasing numbers of high-profile extreme weather events (including recent hurricanes Harvey and Irma being felt in Houston and the southeast and Winter Storm Grayson along the Eastern seaboard), U.S. cities’ ability to adapt to climate change impacts is more important than ever. In recent years, cities have begun to come to terms with the fact that there is a certain amount of climate change that is locked into the system from past accumulation of emissions, even if every city in the world were able to reduce its emissions today. This realization has spurred at least 75 U.S. cities to focus more seriously on adaptation (or resiliency) planning (Innovation Network for Communities, 2017).
Likely impacts of climate change on U.S. communities include flooding, extreme temperatures, drought, wildfires, and severe storms, among others. In the last 10 to 15 years, interest in climate change adaptation has skyrocketed. It has become a major topic in international negotiations (as well as on the state and city-levels), a target of billions of dollars of funding from development agencies, and a source of new projects and initiatives in the nongovernmental organization sector (Vogel et al., 2016). Studies have shown that cities with greater commitment from elected
leaders, higher municipal expenditure per capita, and high levels of public awareness of climate change are more likely to start adaptation planning (Shi, Chu, & Debats, 2015).
While there have been many studies and reports about the factors that lead to a city’s decision to engage in climate adaptation planning as well as how to craft climate adaptation plans and programs, there has been less research on how to define and evaluate the success of adaptation
8 efforts (Hansen et al., 2013). The lack of research in this area is often attributed to the relative newness of the field and the fact that many city adaptation plans are either currently being developed or have only recently been initiated. Indeed, “there are no widely accepted and used measures for cities to monitor progress in adaptation and to create accountability for
implementation” (Innovation Network for Communities, 2017).
Thus, few cities have begun to evaluate their climate change adaptation work. New York City, recognizing that it is on the forefront of this research, published adaptation targets and indicators in its OneNYC strategic plan, even though it is still figuring out how to operationalize some of them. Many of the New York City indicators are also not backed up by consistent data. Other cities, like Chula Vista, California have published metrics with their plans, but do not appear to be utilizing them because of time and resource constraints (Plovnick, 2016).
In addition to these city-led evaluation efforts, there are a number of frameworks for assessing urban adaptation initiatives that have been developed by entities like Arup/100 Resilient Cities, the Notre Dame Global Adaptation Initiative (ND-GAIN), the Environmental Protection Agency (EPA), the Urban Sustainability Directors Network (USDN), and U.S. Green Building Council (USGBC)/STAR Communities. Many of these frameworks have recently been launched or are still under development, but they offer insight into how a city might go about monitoring and evaluating its progress.
9
Overview of monitoring and evaluation
In their seminal text on the subject, Rossi, Lipsey, and Freeman (2004) describe program evaluation as the “use of social research methods to systematically investigate the effectiveness of social intervention programs.” Evaluations gauge program performance and assess
performance against relevant standards. Possible purposes of evaluation include identifying ways to improve programs, increasing accountability to funders and the public, and generating new knowledge.
The first social programs to be targeted by rigorous evaluation were in the fields of education and health. The topic of evaluation received a large boost from many major federal and private programs launched after World War II that provided “urban development and housing,
technological and cultural education, occupational training, and preventive health activities” (Rossi, Lipsey, & Freeman, 2004). Federal agencies and private foundations also made large contributions in family planning, health, and rural development in the Global South. Investment in these programs increased funders’ desires to understand their impacts; and thus, program monitoring and evaluation became more widespread (Rossi, Lipsey, & Freeman, 2004).
According to Rossi, Lipsey, and Freeman (2004), there are several contextual factors that should guide the design of an evaluation, including the particular program and circumstances, the purpose and audiences, and the political and organizational environment. Evaluation should provide information on important issues in a timely and meaningful way and communicate it in a form appropriate for its audiences. It should provide information that will be both “useful and used.” The authors caution that relatively new programs, like climate change adaptation
10 initiatives, are among the most difficult to evaluate because expected outcomes are often long-term and/or ill-defined. Thus, it will likely be hard to detect any impact on social conditions in the first few years.
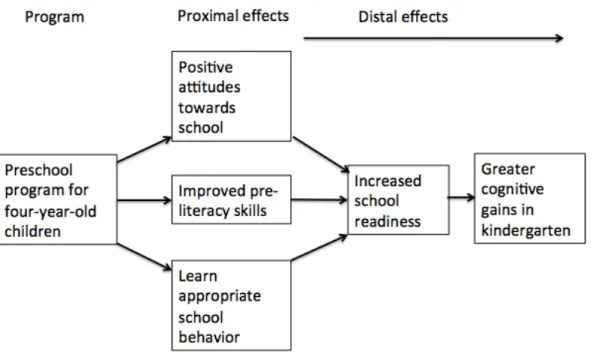
Because of this, it is important to distinguish between process and outcome evaluation. Process evaluation is designed to show how effectively a program is being operated and how well it achieves its intended goals. It might address such questions as how many people are participating in a program and whether it is reaching its intended audience. Outcome evaluation, on the other hand, is designed to show how well a program produces a particular improvement in a set of social circumstances. Outcomes can be both “proximal” (near-term) and “distal” (long-term) as demonstrated in Figure 1.
11 While proximal outcomes are often not the ultimate goals of a program, they can be important signals of what is to come. If these immediate outcomes are not showing success, this is often a strong sign that long-term outcomes will not be reached by the program as it currently stands (Rossi, Lipsey, & Freeman, 2004). Because the effects of many climate change hazards will largely be felt long-term, assessment of the implementation of adaptation efforts may be
dominated in the near-term by process and proximal outcome evaluation, while at the same time identifying indicators for distal outcomes that may describe impacts. Program monitoring, or the periodic measurement of process and outcome results over time, will facilitate both process and outcome evaluation in the long-term by providing consistent and reliable data from which to draw conclusions.
The process of monitoring and evaluation necessitates the identification of appropriate indicators, orquantitative or qualitative variables that provide reliable means to measure a particular phenomenon or attribute (USAID, 2009). While the definitions of metrics and
indicators are often disputed, for the purposes of this thesis metrics are the particular quantitative proxy measures that are used to operationalize higher-level indicators. Available metrics are constrained by available data sets. In terms of defining process and outcome indicators, it can be useful to look at an example from the parallel field of climate mitigation. A common outcome indicator for a mitigation program is reduction in greenhouse gas emissions and a common metric associated with this indicator is tons of carbon dioxide emitted (J. Cleveland, personal communication, November 30, 2017). An example of a process indicator is the amount of renewable energy installed, which might be approximated by the megawatts of solar installed citywide (Plovnick, 2016).
12 In this thesis, process indicators are specifically called “risk reduction” indicators. These
indicators monitor the progress in implementing resilience actions taken in anticipation of the worsening effects of climate-related hazards (e.g., the number of trees planted to reduce the risks of extreme heat). These actions are designed to “reduce risk by reducing exposure and sensitivity or increasing recovery potential and adaptive capacity to prepare for expected climatic changes or events” (EPA, 2017). On the other hand, I call outcome indicators “risk management” indicators. These indicators measure the proximal and distal effects of implementing resilience actions (e.g., the prevalence of heat-related illness).
Also important are context indicators, or “indicators which may be useful for understanding the background situation or context related to a specific issue” that “are typically not under the direct control or influence of the entity seeking to use them” (Arup, 2014). Indicators that measure the frequency and intensity of climate hazards are important context indicators because they show how the climate is changing, which provides important information for interpreting the risk reduction and risk management metrics.
In terms of what constitutes a good indicator, Doran (1981) coined the widespread SMART principles that he originally proposed to evaluate corporate goal-setting but can equally be used to craft robust indicators and metrics in the adaptation arena. SMART refers to:
• Specific- target a clear and well-defined attribute
• Measurable- quantify (or qualitatively describe) the attribute • Assignable- specify who will do it
13 • Time-related- specify when results can be generated
Embedded in this list of criteria is the importance of creating indicators that are robust as well as practical. Identifying available (or low-cost) data sets and parties that will be able to collect and monitor the metrics associated with indicators can be just as (or more) important than identifying the most appropriate or robust measure. Additionally, programs related to complex problems may require bundles of indicators, as one indicator that adequately describes the whole phenomenon or attribute may be impossible to locate (Plovnick, 2016).
Sustainable development indicators
Another topic that has been researched longer than climate adaptation (and that has some of the same barriers that make it hard to evaluate) is sustainable development. Researchers have been struggling to develop a set of widely agreed upon indicators of sustainability since that concept first became popular in the latter part of the 20th century. There is still substantial debate on the set of indicators that ought to be used. Parris and Kates (2003) conducted a study of some of the more than 500 efforts to measure sustainable development and concluded that no indicator sets are universally accepted. Bossel (1999) notes the problems in developing sustainability
indicators start with the issue of adequately defining “sustainable development.” In a parallel fashion, the concepts of “vulnerability” and “resilience” have many different meanings in today’s literature on climate change adaptation (Gallopín, 2006; Downing et al., 2005). For the purpose of this study, and for the sake of simplicity, my thesis assumes that resilience is the flip side of vulnerability (IPCC, 2001).
14 Meadows (1998), who explores the creation of sustainable development indicators in particular, notes that most groups that publish lists of characteristics of good indicators include such items as clear in value, clear in content, compelling, policy-relevant, feasible, sufficient, timely, appropriate in scale, democratic, supplementary, participatory, hierarchical, physical, leading, and tentative. She notes that strict adherence to these high standards makes it almost impossible to come up with indicators. Instead, she suggests making the task manageable by concentrating on just ten indicators that seem important, and subsequently refining this set. In addition,
Moldan, Janoušková, and Hák (2012) emphasize the importance of setting targets and measuring the distance to those targets as a key component in developing sustainability indicators.
While no indicator frameworks for sustainability are universally accepted, there are several frameworks that have caught on more than others, depending on which scale of measurement is desired. The Global Reporting Initiative and the Carbon Disclosure Project provide a framework for organizations and cities to report on climate change and carbon emissions indicators. The USGBC has two rating programs related to sustainability that are particularly widespread in the United States. While both measure and score sustainability, the Leadership in Energy and Environmental Design (LEED) system rates buildings, while the STAR Communities system rates communities.1 In addition, several city sustainability plans like the Sustainable DC Plan
include specific targets to be tracked via indicators (Plovnick, 2016).
1 The STAR Community Rating System includes climate change adaptation as one of its subsections. See Part V of
15
Current municipal efforts to create climate adaptation indicators
While adaptation programs, and thus efforts to evaluate them are relatively new, the increasing numbers of academic papers and evaluation frameworks in recent years highlight their
importance and popularity. Ford, Berrang-Ford, Lesnikowski, Barrera, and Heymann (2013) develop a typology of methods to track adaptation at the national level. They highlight the need for evaluation, noting “As adaptation financing increases and initiatives are developed, the need to monitor and evaluate progress on climate change adaptation is being increasingly recognized, as a means of evaluating the effectiveness of adaptation support, informing governance at various levels on adaptation needs, justifying funding allocation, and communicating to the public on adaptation.” Similarly, Preston, Westaway, Dessai, and Smith (2009) suggest that climate change adaptation evaluation is important to ensure reductions in vulnerabilities, learn and adaptively manage, and promote accountability.
Climate adaptation experts agree that municipal evaluation of these efforts is lacking. Vogel et al. (2016) conducted 17 intensive case studies of cities taking climate preparedness actions and found that while monitoring and evaluation is often touted as a key piece of these planning efforts, most cities do not have a formal evaluation system, and none are comprehensive in nature. A report by the USDN (2016) identified that a number of nongovernmental groups are developing adaptation indicators, but that they lack “consistent, organized input from urban adaptation practitioners.” Plovnick (2016) analyzed climate adaptation plans in nine large coastal cities, finding that only two included indicators in their climate adaptation plans, and only one is actually reporting on them. Of the 37 indicators from these two cities, only five are risk
16 management (outcome) oriented. The rest are risk reduction (process) indicators that measure the degree to which city actions are underway.
While most published city plans in the U.S. do not include adaptation indicators, New York City’s OneNYC plan is a notable exception. This indicator set appears to be particularly
promising for cities looking to select and track their own measures because it contains indicators that have been approved by a municipality despite data limitations and other constraints common to cities.
Other non-municipal attempts to create indicator frameworks like those generated by 100 Resilient Cities and Arup’s recently released City Resilience Index, ND-GAIN’s Urban Adaptation Assessment, USDN’s guide to selecting urban adaptation indicators, EPA’s Multi-Sector Evaluation Tool for Identifying Resilience Opportunities, and USGBC/STAR
Communities’ sustainability rating system may also provide promising indicators and metrics for cities to consider.
Plovnick (2016) identifies three categories that these non-governmental and city-driven
frameworks fit into. These include top-down frameworks, which involve external evaluation of city efforts; bottom-up frameworks where cities conduct the analysis with proscribed or
internally developed metrics, and guiding frameworks that give cities instructions on how to craft their own indicators. I gained insight from analyzing examples from each type of
17 communicated a desire to develop indicators specific to the local context, suggesting that the latter two types of frameworks are most relevant for my purposes.
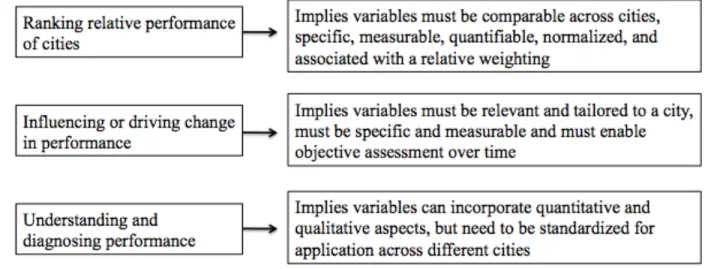
These three types of frameworks map onto what Arup (2014) considers the three primary motivations for developing adaptation indicator sets (see Figure 2). Top-down frameworks are often motivated by the desire to rank relative performance of cities, whereas bottom-up and guiding frameworks are often motivated by the desire to understand and influence performance. City-born indicator sets like NYC’s (that fit into the bottom-up framework category) are almost always related to the second motivation listed in Figure 2 (i.e., influencing change), with measures “tailor-made to their needs” (Arup, 2014). Julie Wormser, Principle of North Cambridge Consulting and long-time City of Boston partner on climate preparedness issues, emphasized the importance of this motivation, noting that developing indicator sets that “drive action” should be the main focus of the City’s efforts on climate change adaptation monitoring and evaluation (J. Wormser, personal communication, January 10, 2018).
18
Challenges to climate adaptation monitoring and evaluation
There are several barriers to developing adaptation indicators identified in the literature on the subject. These include a lack of agreement over what defines success, long time-horizons and shifting baselines, potential for maladaptation, invalid measures, and resource constraints (Plovnick, 2016; USDN, 2016; Ford, Berrang-Ford, Lesnikowski, Barrera, & Heymann, 2013; Pringle, 2011). Each are explained in more detail below.
Defining success
Terms like “vulnerability” and “resilience” have different meanings to different groups and localities. Definitions can vary based on the hazards facing a particular community as well as community values. Without common definitions of what constitutes a resilient city, it is hard to figure out what measures will indicate success. This, combined with the relative newness of monitoring and evaluation of these efforts, means that practitioners and academics do not have a robust list of potential indicators for cities to use.
Long time-horizons and shifting baselines
The impact of many adaptation initiatives might not be discernible for a long period of time. The success of many measures to combat sea level rise, for example, might not be apparent until a major storm event or until sea levels have risen by a significant amount. Conditions will also change over time (i.e., baselines will shift) because climate change is a dynamic phenomenon. Knowing what success means in the face of constantly changing climate hazards is a difficult task.
19 Potential for maladaptation
Because urban systems are complex, it can be hard to detect if adaptation initiatives have unintended negative impacts (e.g., disproportionately burdening communities of color).
Invalid measures
Metrics are proxies for the phenomenon or characteristic that one would like to measure, which means they may not accurately reflect the success of a program. For example, measuring the number of feet of flood mitigation barriers installed may not accurately reflect a reduction in flood risk if the barriers are not in the appropriate locations to block flood pathways.
Resource constraints
Just because a community discovers a robust indicator to track a particular measure of success does not mean that it is feasible to monitor with the resources it has available. Robustness must be balanced against practicality in terms of staff capacity, money, data availability, and time.
It will be important to keep these barriers in mind when crafting a set of indicators for the City of Boston to use in monitoring and evaluating implementation of its climate adaptation initiatives.
20
Part II: The Boston Context
Overview of Boston’s climate change adaptation efforts
In recent years, under the direction of Mayor Martin J. Walsh who took office in 2014, the City of Boston has been ramping up its climate change preparedness efforts, which began during Mayor Thomas Menino’s administration. Imagine Boston 2030, the City’s first comprehensive plan in 50 years, is perhaps Mayor Walsh’s signature achievement of his first term. This document outlines the key goals that Boston would like to accomplish leading up to its 400th birthday, including “encouraging continued economic growth, becoming more affordable and equitable, and preparing for climate change” (City of Boston, 2017f).
In support of the latter goal, Boston has been working to reduce its greenhouse gas emissions and become more resilient since a 2007 executive order that instigated action (City of Boston, 2007). In 2011, Boston released its first plan dedicated to addressing these issues entitled A Climate of Progress (City of Boston, 2011). The 2014 Climate Action Plan (CAP) Update continues this work. These efforts are housed in the Environment Department and branded as Greenovate Boston.
As part of this climate action work, the City launched an effort specifically aimed at climate adaptation and preparedness called Climate Ready Boston (CRB). A chart that describes how CRB fits within all of the City of Boston’s planning processes can be seen in Figure 3 below. This image makes it clear that the purpose of CRB is to operationalize the City’s high-level climate preparedness goals identified in Imagine Boston 2030 and the 2014 Climate Action Plan Update.
21 Figure 3: Relationship between the City’s climate work and other efforts (image adapted from Greenovate Boston)
CRB released its full foundational report in December 2016, which includes updated climate projections, a vulnerability assessment (discussed further in Part IV), five overarching goals, and 39 recommended resilience initiatives to address these vulnerabilities (City of Boston, 2016b). While overall project management is situated within the Environment Department, the report identifies at least 10 other City departments that will be involved in carrying out the
recommendations. For example, the Boston Public Health Commission (BPHC) is tasked with conducting outreach campaigns to facilities serving vulnerable populations, the Boston Planning and Development Agency (BPDA) is tasked with crafting new development guidelines for resilient buildings, the Office of Emergency Management (OEM) is tasked with creating a new heat emergency plan, and the Boston Water and Sewer Commission (BWSC) is tasked with developing design guidelines for green infrastructure. The Office of Workforce Development, Office of Economic Development, Office of Resilience and Racial Equity, Department of Parks
22 and Recreation, Boston Transportation Department, and the Office of Neighborhood Services also play key roles in carrying out actions. Finally, the report recommends that the City coordinate with state-level agencies like the Massachusetts Department of Transportation and private communications and energy companies, especially related to matters of infrastructure resilience.
In recognition of climate change as a cross-cutting issue, several other City departments have incorporated climate preparedness as a key component of their planning documents. Released in July 2017, Resilient Boston (created with the support of the Rockefeller Foundation’s 100 Resilient Cities program) focuses on racial equity and identifies several actions related to the intersection of equity with climate readiness (City of Boston, 2017h). Released in March 2017, the Go Boston 2030 Vision and Action Plan, the citywide transportation plan, identifies the need for analysis of climate impacts when issuing City transportation contracts (City of Boston, 2017e). Finally, many of the BPDA’s neighborhood planning processes are beginning to
incorporate climate impacts and preparedness into their thinking. The final drafts for the Dot Ave and JP/Rox plans include actions for resiliency, and the Glover's Corner plan emphasizes climate as a main consideration (City of Boston, 2018b).
City data collection and monitoring efforts
In addition to the proliferation of planning documents, the City has also started to explore tracking its performance in new ways and publishing open source data on its website. Launched in April 2017, the “Analyze Boston” webpage currently houses about 130 data sets (City of Boston, 2017a). It includes data collecting efforts like CityScore that tracks key performance
23 metrics, including time taken to fill potholes and emergency services response time (City of Boston, 2018a).
Additionally, the Imagine Boston 2030 webpage includes a “metrics dashboard” which is meant to be updated annually with measures related to the goals in the report. For example, in the area of “walkability” the goal is to “increase Walk Score® rankings by neighborhood, including reducing the number of households classified as car-dependent by half” (City of Boston, 2017g). The dashboard displays Boston’s current Walk Score® and includes informative maps and charts.
The “Reduce Emissions” section of this dashboard presents the current overarching goals for climate change mitigation in both Imagine Boston 2030 and the 2014 CAP update, namely to reduce emissions by half by 2030 (from 2005 levels) and become carbon neutral by 2050. More specific mitigation goals, targets, and metrics are included in the 2014 CAP update (see Figure 4).
24 Figure 4: 2014 CAP update progress and targets by sector (City of Boston, 2014a)
One of the sections on the dashboard also attempts to address adaptation. The identified goal is to “reduce economic loss and number of people exposed to climate-related flooding,” and it includes baseline metrics from the CRB vulnerability assessment on the number of people, percent of land, and economic value of property exposed at nine inches of sea level rise (City of Boston, 2017g). It is unclear how the City plans to update these numbers year to year; the analysis that went into producing them is quite extensive and involves multiple data sets that would need to be revised. Also, exposure “by definition does not consider site-specific
conditions such as structure elevations and flood elevations, but simply identifies structures that may be exposed to a number of flood impacts such as structural damage, contents loss, property
25 value degradation, and access issues” (City of Boston, 2016a). Thus, these numbers do not include benefits from site-specific adaptation measures. When developing the dashboard, there were conversations about including additional indicators that might provide more insight into adaptation progress, including amount of tree canopy and economic recovery time after a severe weather event, but these were left off the final product because of data limitations and/or the fact that the metric values might not change from year-to-year (e.g., there might be a year without an extreme weather event) (M. Mansfield, personal communication, January 12, 2018).
Previous attempts to develop indicators for Boston’s climate adaptation efforts
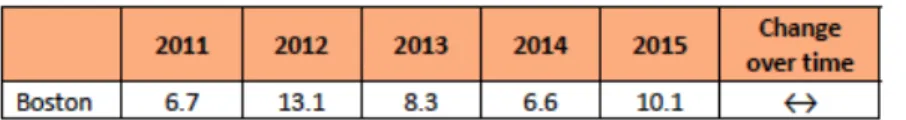
In recent years, there have been efforts related to how Boston, specifically, might establish indicators to evaluate its progress on climate adaptation. In 2014, a Fellow in the Environment Department conducted a study that resulted in a memo on this topic. The Fellow identified the need for multiple indicators because of the complex impacts of climate change on many sectors. As such, she identified several indicators under nine categories (Deas, 2014). These indicators are listed in Table 1 below.
Table 1: List of indicators from a memo drafted for the City of Boston Department of Environment (Deas, 2014)
Category Indicator
Government leadership Number of City plans referencing climate change preparedness. Education and public
outreach
Number of individuals pledging to make key preparedness measures in their homes and businesses.
Critical services • Water and wastewater: Volume of combined sewer overflows.
• Energy facilities: Percentage of electricity generated within the year floodplain able to remain online after a
500-26 year flood event.
• Liquid fuels: Percentage of gas stations with quick-connects for generators.
• Telecommunications: Percentage of Boston’s
telecommunication system transitioned to fiber optics or coaxial cables.
• Transportation infrastructure: Number of or percentage of transportation assets adapted for climate change resilience. • Food systems: Number of grocery stores or food markets per
square mile, with special attention to low-income neighborhoods.
• Natural systems and green infrastructure: Square miles of green space or vegetative cover.
Building stock Number of renovations or new construction that incorporate resilience measures.
Coastal risks and flooding Funding secured for flood protection projects.
Heat risks Percentage or number of buildings with cool or green roofs. Emergency management-
the public sector response
Number of emergency workers undergoing City coordinated hazards training.
Emergency management- the private sector
response
Number of businesses with disaster continuity plans.
Public health Percentage of adults who meet current federal physical activity guidelines or percentage of population with medical insurance.
In January 2015, SeaPlan and the Boston Harbor Association, in collaboration with the City of Boston, released a report called Draft Climate Adaptation Indicators Framework for the City of Boston, MA. The report identifies six high-level indicators and potential ways to think about measuring them (see Table 2).
27 Table 2: List of indicators from Draft Climate Adaptation Indicators Framework for the City of
Boston, MA (Lipsky & Starbuck, 2015)
Indicator 1 The degree to which planning, capacity and coordination to effectively prepare for and respond to climate change and extreme weather events is in place. Climate change is mainstreamed into city plans and programs. Finances and resources are available to adequately address climate change and related events. Government is able to continue operating and providing critical services during climate-related events.
Indicator 2 The degree to which information and data are available and used to adequately address climate change and related events.
Indicator 3 The degree to which the public and specific stakeholders are aware of and provide input into preparing for climate change and related events.
Indicator 4 The degree to which Boston residents are vulnerable to climate-related health risks and have access to needed services and amenities.
Indicator 5 The degree to which natural ecosystems in Greater Boston are able to withstand impacts of climate change and related events. Green/gray infrastructure is expanded to address climate vulnerabilities. Protective infrastructure (e.g., ecosystem
components and coastal infrastructure - dikes, levees and seawalls) exist and are adequate to protect against climate-related events and risks.
Indicator 6 The degree to which public/private buildings and utilities are adequately prepared to withstand climate change and climate-related events.
Despite these efforts, the City has not yet actively pursued implementing any of these indicators and did not include any indicators or metrics in the 2016 CRB report. Boston’s Environment Department leadership notes that previous evaluative studies have limitations that make them hard for the City to implement. For example, some prioritized comprehensiveness over practicality and/or went beyond locally appropriate concerns and considerations (C. Spector, personal communication January 24, 2018). Others did not identify data sources. There has been significant progress made by the City in assessing vulnerability and crafting and implementing
28 resilience actions in the past couple years, meaning that a reassessment of previously developed indicator sets to determine their applicability and connectedness to current efforts is needed. In an interview, Commissioner of the Environment Carl Spector outlined several key
considerations that those developing indicators for Boston’s adaptation initiatives should keep in mind. Overall, indicators should be both meaningful and relatively easy to track, implying that data should either already be tracked or be readily attained. He also emphasized the importance of developing a small set of indicators to start with, trying them out for a few years, and then re-evaluating them based on this experience. He noted that more indicators could be added over time to build toward a comprehensive set, but that efforts right now should be focused on identifying a few that are “reasonable places to start” and explaining why they are reasonable. Finally, he pointed out that setting targets is not the priority at this stage, unless there are very clear standards already developed in the literature (e.g., EPA quality standards). Identifying the general direction that the quantitative variable should move is important (e.g., number of flood protection measures should increase), and targets can be added in later once the city has more information from implementing resilience actions and metrics (C. Spector, personal
communication, January 24, 2018).
Renewed interest in adaptation indicators
There is renewed interest in the topic of indicators at City Hall. As mentioned previously, the Environment Department is currently readying itself to update its CAP. This update will need to report on progress toward implementing the City’s climate adaptation initiatives since the last update in 2014 and since the 2016 CRB report. The last CAP update in 2014 noted the following:
“Unlike climate change mitigation, where the total amount of greenhouse gases emitted serves as the overriding measure of progress, there is no single indicator that measures
29 climate preparedness. The City will continue to monitor measures of risk, including sea-level averages, average annual temperature, number of days over 90 degrees Fahrenheit, and precipitation patterns. Some useful metrics are available in specific areas, such as the size of the city’s tree canopy, the proportion of impermeable pavement, and the number of people who have participated in outreach programs. The City is working with local researchers and other cities to understand and develop better indicators of urban and community preparedness that can be used to establish more concrete goals” (City of Boston, 2014a).
Furthermore, Action 2.32 (one of 28 actions identified in the “climate preparedness” section of the plan) is dedicated to establishing preparedness indicators (see Figure 5).
Figure 5: Action 2.32 (City of Boston, 2014a)
As referenced above, the sections of the 2014 CAP pertaining to mitigation identify specific targets, goals, and metrics while there is no such information in the climate adaptation section. I think it is reasonable to assume that the public will expect adaptation indicators to be included in the next CAP update. In this thesis, I move a step farther than previous studies developed for the City by recommending specific indicators and metrics and connecting them to existing data sets with an eye toward practicality of implementation.
30
Part III: Methodological Approach
To create a set of indicators for the City of Boston to include in the next CAP update, I took a four-pronged approach that included reviewing Boston’s climate vulnerability assessment, analyzing major frameworks in the field and interviewing experts associated with these frameworks, ensuring that each of the City’s five resilience goals from the CRB report is well-represented, and identifying potential data sets. These steps are further outlined below.
First, I used the City of Boston’s vulnerability assessment, along with interviews with City staff and other Boston resiliency experts (i.e., funders, advocates, and consultants) to ascertain the City’s main climate vulnerabilities and resilience goals, gather information about past efforts to identify metrics, and glean advice for how to increase the likelihood of the City adopting the indicators I recommend through this report.
Next, I undertook an analysis of six indicator frameworks developed by cities and other groups (see Figure 6). I selected these frameworks based on their focus on the city level, their
popularity, their potential application to Boston, and their representativeness of the three types of frameworks discussed in Part I (top-down, bottom-up, and guiding). In a study conducted by Plovnick (2016), New York City is the only large coastal city in the U.S. that currently publishes indicators related to climate change adaptation (through annual updates to its OneNYC
comprehensive plan). As a peer city to Boston, reviewing this framework was a high priority because of its ability to identify the types of indicators that a large coastal city might be able to publish and track. Boston officials were involved in the development of USDN’s report
31 Identifying Resilience Opportunities, and USGBC/STAR Communities’ rating system, which made these prime candidates to include. Finally, City officials mentioned interest in learning more about the City Resilience Index (developed by Arup and the Rockefeller Foundation’s 100 Resilient Cities) and ND-GAIN’s Urban Adaptation Assessment.
Figure 6: Six indicator frameworks reviewed
All of these indicator frameworks are less than five years old, emphasizing the newness of this line of inquiry and its current importance to cities. USGBC/STAR Communities’ rating system is the oldest; its first city was certified city in 2013. ND-GAIN’s assessment is the newest, with its online platform expected to roll out later this year, although pilot assessments have already been completed in several cities (P. Regan, personal communication, January 11, 2018). I conducted semi-structured interviews with staff members involved in each of these projects to identify how they constructed the evaluation framework, why they chose the specific indicators they did, and how they went about measuring them, although specifics varied by interview (see Appendix A
32 for an interview guide). Through these conversations, I was able to compile a list of important considerations as I developed a set of indicators for Boston.
I also compiled a spreadsheet of all the indicators listed in each framework and categorized them based on the structure of the City’s vulnerability assessment, first by risk and then by association with people, infrastructure, buildings, and economy (see Appendix B).2 Many indicators applied
to more than one hazard, so they were included in more than one place. Indicators related to education & engagement and information & governance were listed separately because they were not hazard-specific. This categorization exercise helped me uncover the overlap between Boston’s climate risks as identified in the vulnerability assessment and those indicators selected by the six frameworks reviewed. Subthemes emerged within each of the categories and are identified in the spreadsheet. I gave indicators included by multiple frameworks more weight in my final recommendation process, and I identified how many of the frameworks included such a measurement in my description of the indicator in Part VI of this thesis. One caveat is that because many of these frameworks were developed through reviewing other indicator sets, replication across frameworks may indicate a prevalence of groupthink in the field rather than totally independent valuation of each indicator.
Next, I re-categorized promising indicators based on the five goal areas identified in the CRB report (which closely resemble the categories in the vulnerability assessment): updated climate projections, prepared and connected communities, protected shores, resilient infrastructure, and
2 Indicators from Lipsky & Starbuck (2015) and Deas (2014) are also included, along with suggested metrics
identified (though not published) via Imagine Boston 2030. Hazard risk indicators from Susskind, Rumore, and Field (2015) are also included.
33 adapted buildings. This re-categorization was necessary to match the structure of the CAP update and ensure that each of Boston’s goals is well represented with both risk management and risk reduction indicators.
Finally, I conducted research online and through conversations with City staff to understand which indicators from the list above might already have data sets (or proxy data sets) associated with them. If data does not exist but seems relatively easy to collect based on existing City activities or processes, I included the indicator and identified how that data might be collected in Part VI.
34
Part IV: Overview of Boston’s Vulnerability Assessment
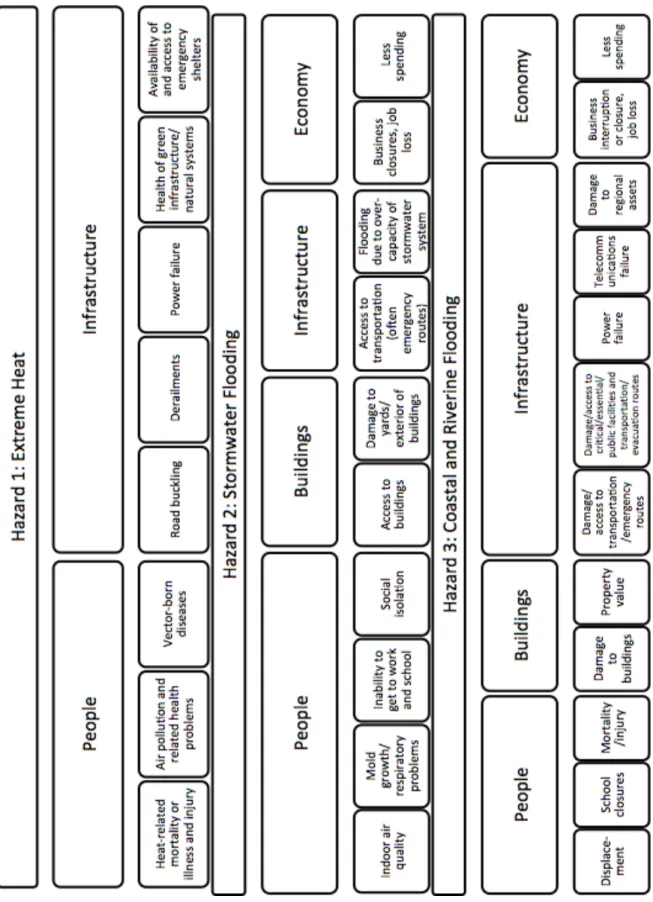
Boston’s vulnerability assessment identifies three main climate hazards: extreme heat, stormwater flooding, and coastal/riverine flooding. Each of these hazards impacts people, buildings, infrastructure, and economy in different, but often overlapping, ways.
Extreme heat is a chronic stress that the city experiences every year, and, as such, may be particularly amenable to monitoring and evaluation. Climate change will cause average
temperatures to rise and increase the duration, frequency, and intensity of extreme heat events. Boston residents can expect the number of days above 90 degrees Fahrenheit to as much as quadruple (from 11 to as many as 40 days) by 2030. The urban heat island (UHI) effect, or the higher temperatures observed in densely developed areas, creates differentiated risks of extreme heat throughout Boston, with neighborhoods with little tree canopy often at greatest risk. The vulnerability assessment is careful to point out, however, that the whole city will be exposed to the impacts of extreme heat to some extent. It identifies negative health impacts (e.g., mortality and illness) and infrastructure problems (e.g., road buckling and train derailment) as key
vulnerabilities that climate change will exacerbate in the future. The vulnerability assessment did not analyze heat risks to buildings and the economy because of a lack of available data (City of Boston, 2016b).
Stormwater flooding due to increased precipitation is another key hazard for Boston. Rainfall could increase by 20 percent by 2060, which would mean water levels exceeding the height of city curbs during storms. Due to limited data, the vulnerability assessment only assessed frequent stormwater flooding, or 10-year, 24-hour events. The assessment asserts that the existing
35 stormwater system struggles to convey the current 10-year, 24-hour precipitation event, much less those of greater intensity (City of Boston, 2016b). Evidence of this was recently experienced during Winter Storm Grayson, where many places in South Boston experienced flooding due to stormwater system problems (City of Boston, 2018c). Upgrades to the system combined with green infrastructure solutions will be needed to combat stormwater flooding and reduce the risks associated with it (e.g., decreased access to buildings and transportation) (City of Boston,
2016b).
Finally, coastal and riverine flooding is a grave risk for Boston and is “expected to lead to the most significant climate hazard consequences” (City of Boston, 2016b). According to the assessment, sea levels could rise to three feet or more during the second half of this century, meaning more daily nuisance flooding as well as more flooding during extreme weather events (e.g., the one percent annual chance coastal storm). Vulnerabilities associated with this hazard include such risks as displacement due to home loss, physical damage to buildings, power failure, and business interruption or closure, among others (City of Boston, 2016b). The vulnerabilities mentioned in the assessment are summarized in Figure 7 below.
36 F igu re 7 : S um m ar y of ha za rds a nd vul ne ra bi li tie s ide nt if ie d in the C R B r epor t
37 The indicators I suggest in Part VI are informed by this analysis. The risk management indicators included in my suggested list are proxies for many of the risks identified in Figure 7. The risk reduction indicators, on the other hand, primarily measure progress on implementing the 39 resilience actions included in the CRB report that address these vulnerabilities. All are related to the City’s overarching resilience goals: updated climate projections, prepared and connected communities, protected shores, resilient infrastructure, and adapted buildings.
38
Part V: Review of Existing Adaptation Indicator
Frameworks
I conducted an analysis of six existing indicator sets to aid in producing my suggested set for Boston. These frameworks fit into the three categories discussed in Part I, namely top-down, bottom-up, and guiding. An overview of each framework is included below along with guidance I gleaned from their creators about crafting an indicator set for Boston.
Top-down frameworks
Top-down frameworks are not created with specific city goals and circumstances in mind. Instead, a group picks a set of indicators to apply to many different cities and the final result is often a ranking of the cities examined. These features can be disempowering to cities hoping to make progress in this arena; thus, they should not be the primary assessment tools utilized to understand performance. Nevertheless, some of the indicators and other components of these frameworks may be applicable to a specific municipality, so reviewing them can be helpful to cities crafting their own assessments.
ND-GAIN’s Urban Adaptation Assessment
Overview
ND-GAIN, originally known for its country index that ranks nations based on their
vulnerabilities and readiness to adapt, is in the process of expanding that work to the city level via the Urban Adaptation Assessment (UAA) (ND-GAIN, 2018). Recognizing a need to measure cities’ capacity to take on adaptation action in addition to understanding climate risks, the
ND-39 GAIN team developed a framework to understand these complex concepts and hopes to apply it to 278 cities in the U.S. with populations above 100,000 people (see Figure 8).
Figure 8: Urban Adaptation Assessment components (ND-GAIN, 2018)
In a nutshell, ND-GAIN sees risk as a function of climate hazard (e.g., inland flooding measured through monthly maximum consecutive 5-day precipitation), sensitivity (e.g., percent of area that is impervious surface), adaptive capacity (e.g., percent of population with health insurance), and exposure (e.g., percent of population living in flood plains). These types of risks are measured by a variety of metrics (see Figure 9) and aggregated into a score that ranks cities on their overall vulnerability and readiness to adapt. The scores will be updated annually and reported out on a publically available website. The project is still under development, but the team hopes to release the first iteration soon (P. Regan, personal communication, January 11, 2018).
40 Figure 9: ND-GAIN’s draft framework with indicators (ND-GAIN, 2018)
41 Notre Dame political science professor Patrick Regan, who is Associate Director of the
Environmental Change Initiative and oversees the UAA, emphasizes that the UAA is not designed to measure success of cities’ adaptation actions.
“...if somebody in Boston says ‘so has our adaptation strategy been effective?’ you might look at changes over time in some of our indicators, but we don’t have any behaviors that we call adaptation. We are really making the assumption, and I think the literature is making the assumption, that if we were better on these indicators under conditions of climate stress, we would have some better outcome. You could get to those better indicators in a multitude of ways that are unrelated to the political decision to adapt to the expectation of future climate change.”
He notes, however, that some of the indicators included could be improved through adaptation actions, like increasing the amount of tree canopy or the number of hospital beds.
Lessons for Boston
Because the indicators in the UAA are designed to measure current risk conditions and readiness to adapt rather than success of adaptation actions, the approach is quite different from the one Boston needs. Boston has a solid understanding of its risks as a result of the extensive
vulnerability assessment that was undertaken as part of the planning process. However, many of the metrics in the UAA might be applicable to helping Boston understand if those risks are declining based on its actions (e.g., property damage per capita and per hazard occurrence), and some of them might be applicable to measuring the actions themselves, particularly those identified as “adaptive capacity” metrics (e.g., percent of land covered by tree canopy). Additional insights from this framework are listed below.
42 Pay attention to the distribution of risks across the city
One unique piece of the UAA will be its “sub-city” analysis. Available for each city via the web platform that will house the index, the viewer will be able to see the data included in the
assessment spatially. This can help decision-makers understand, for example, if hospital beds are accessible to at-risk areas, rather than just the total number of hospital beds in the city. One could also toggle on demographic data to “see where the distribution of adaptation efforts would have the highest pay off from a social equity point of view” (P. Regan, personal communication, January 11, 2018).
Focus on theory over correlation
In the process of cutting down the original list of over 60 indicators to about half that amount, Regan emphasized that his main decision criterion was a theoretical argument.
“I would always say does it make theoretical sense? ...Tell me about a logical argument that says if you have more of x you’d have less of y. And I think that’s the strongest way to go. If I was standing up in front of a group of people giving a talk about this, I’d want a good reason for every indicator and the good reason would not be high correlation.” He also noted that the team had to make tough decisions on reasonable proxy indicators when they could not get data for the particular indicator they desired to include.
Match your precision to your audience
Regan said that some of the experts the UAA team worked with were concerned about the precision of the data included in the assessment. He notes, “The level of precision should be consistent with the level of precision in the usage.” Because the main audience of the UAA is decision-makers, precision is not as important a factor as it would be for a hydrologist
43 developing models of water flow, for example (P. Regan, personal communication, January 11, 2018).
Bottom-up frameworks
Bottom-up frameworks include both those developed by groups that give cities a proscribed set of indicators to measure on their own and those directly developed by a city. Arup and 100 Resilient Cities’ City Resilience Index, EPA’s Multi-Sector Evaluation Tool for Identifying Resilience Opportunities, and USGBC/STAR Communities’ rating system are all examples of the former. The indicator set used in NYC’s OneNYC plan is an example of the latter. These frameworks provide many potential indicators and metrics that could be applied to the Boston context.
100 Resilient Cities and Arup’s City Resilience Index
Overview
Arup, with the support of The Rockefeller Foundation’s 100 Resilient Cities program, started the process of creating the City Resilience Index (CRI) in 2013. With four dimensions (Leadership & Strategy, Health & Wellbeing, Economy & Society, and Infrastructure & Ecosystems), 12 goals (e.g., minimize human vulnerability), 52 high-level indicators (e.g., protection of
livelihoods following a shock), 156 qualitative and 156 quantitative variables, the tool takes an extremely comprehensive approach to all aspects of resiliency, which includes but goes far beyond climate change adaptation (see Figure 10). The process for creating the index included a “literature review, 14 city case studies and primary data from six cities globally which focused on identifying the multitude of factors that contribute to a city’s ability to be able to function in
44 the event of an extreme event or chronic stresses” (Arup, 2016b). Recognizing the importance of a bottom-up approach, CRI “is a way for cities to self-assess how resilient they are” (S.
Nadkarny, personal communication, February 20, 2018).
45 Data limitations proved a significant hurdle both while crafting the indicators and metrics for the tool and while implementing the tool in the five pilot cities (Hong Kong, China; Liverpool, England; Arusha, Tanzania; Concepción, Chile; and Shimla, India) during the summer and fall of 2015. Arup (2016) notes that the researchers were unable to “identify existing metrics that were directly relevant based on what is measured already” for approximately half of the 156 variables. In those cases, Arup relied on in-house experts to craft appropriate metrics (S. Nadkarny,
personal communication, February 20, 2018). Related to the difficulty in crafting these metrics was pilot cities’ inability to match data sets to them. Hong Kong, described as having a strong data culture, did not have data for 32 percent of the metrics and Liverpool had no data for 56 percent. The magnitude of the data availability problem is illustrated in the fact that in addition to the qualitative and quantitative resilience profile outputs, a third output for the assessment is a quantitative data availability profile, detailing where cities lacked adequate measures. Arup (2016) describes the problem this way:
“In addition to not being familiar with the quantitative metrics beforehand, the roots of this challenge generally laid in a lack of understanding regarding whether data existed (especially between different sectors or departments), and – where data did exist – who might actually have it.”
Lessons for Boston
Based on conversations with Boston City staff who emphasized starting with a handful of indicators, the 156 that the CRI delivers is a magnitude unlikely to be practical for Boston at the current time. Additionally, because the CRI definition of resilience extends beyond climate change and is meant to be widely applicable to a range of cities around the world, only a portion of the indicators in the CRI are relevant for the project in Boston. Finally, it is likely that Boston would have similar difficulties as CRI’s pilot cities in finding existing data sets that are routinely
46 updated to measure many of the indicators included in this framework. Despite this, there are several key lessons Boston can take away from the CRI.
Tie monitoring and evaluation to existing planning benchmarks
Arup is currently in phase three of the CRI project, which is focused on making the tool scalable and sustainable. One goal of this phase is to understand from cities how often it would be helpful for them to repeat the CRI assessment. So far, feedback from cities suggests that assessments should “align with existing planning benchmarks in the city like starting a new development plan cycle or a change in the administration that has a different spatial planning policy.” Additionally, Arup suggests that cities may want to monitor a subset of these metrics between full assessments (S. Nadkarny, personal communication, February 20, 2018).
Focus on capacity
The CRI frames resilience as “capacity,” which focuses on a review of performance beyond just evaluation “in the moment” of a shock or stress (S. Nadkarny, personal communication,
February 20, 2018). To that end, CRI does not try to measure resilience outcomes that “can only be truly measured based on actual performance following an extreme event, or during chronic stresses.” Instead, it focuses on the “likelihood of a city being resilient in the event of any acute shock or chronic stress” (Arup, 2016b). Because of this, many of the risk management indicators included measure vulnerability based on the overall performance of the system (e.g., average length of electrical interruptions (hours per year per customer)) rather than the performance of the system only during times of stress (e.g., average length of electrical interruptions after a shock) (Arup, 2016a). This is an important approach to keep in mind when crafting metrics for
47 Boston, since many shock-related climate change outcomes may be hard to measure in the near-term.
Include qualitative information to supplement quantitative data
Several of the indicator frameworks reviewed include qualitative indicators as well as
quantitative ones. CRI staff note that they deemed it necessary to include both because of the problem with “leading” versus “lagging” indicators. Quantitative indicators are lagging because “certain changes to practices, mechanisms, and policies don’t necessarily show an outcome until much later” (S. Nadkarny, personal communication, February 20, 2018). Qualitative indicators, on the other hand, are leading because they help assess whether the mechanisms are in place to lead to a particular resilience outcome. Each variable in the CRI has both a qualitative and quantitative indicator to try to catch both leading and lagging information. Qualitative
information could theoretically help cities find a problem before it shows up in the quantitative data. Nadkarny illustrates an example of the importance of collecting both kinds of information:
“...There was a city in north India where we did the pilot and on a particular indicator related to the city’s ecosystem the city scored a five on the quantitative side but a two on the qualitative side. One of the things that was influencing the high score on the
quantitative side was just how much forest cover was present within city boundaries. If I was seeing it as a snapshot in time I would say this is fantastic; the city is in the 80th percentile and above of cities around the world. But when you speak to stakeholders who are familiar with what direction policies and processes are taking, they give it a score of two because they are concerned that a new land use policy is going to lead to
deforestation. So the qualitative response is recorded not just as a score but a rationale to the score, and that gives you some indication of where you could expect improved or unimproved outcomes down the line.”
Understand the limitations of assessment
48 “...data are not going to tell you what to do, which seems to be an unfortunate jump that some cities tend to make. If you have a fever, the thermometer is going to tell you what your temperature is, but it’s not going to tell you what pills to take… A data-driven approach doesn’t mean that you don’t consult stakeholders, that you don’t follow
transparent, inclusive processes of planning. It doesn’t mean that it gives you shortcuts to anything, but it makes whatever outcomes you are looking at more robust, more
thoughtful.”
Bridging the gap from reporting metrics to identifying course corrections will be a key step for Boston after it begins to consistently monitor adaptation indicators.
EPA’s Multi-Sector Evaluation Tool for Identifying Resilience Opportunities
Overview
In 2017, EPA released a report entitled Evaluating Urban Resilience to Climate Change: A Multi-Sector Approach. The tool created through this report, since named the Multi-Sector Evaluation Tool for Identifying Resilience Opportunities (METRO), contains quantitative and qualitative indicators to help cities understand areas where they should focus on improving their resilience. It identifies indicators in eight municipal management sectors affected by climate change, including (1) water, (2) energy, (3) transportation, (4) people (public health and
emergency response), (5) economy, (6) land use/land cover, (7) the natural environment, and (8) telecommunications. The tool contains 88 quantitative indicators and 169 qualitative indicators (see Figure 11 for examples) that are intended to reveal the city’s “ability to reduce exposure and sensitivity to and recover and learn from gradual climatic changes or extreme climate events” (i.e., the report’s working definition of resilience). Each indicator is assigned an importance score as well as a resilience score. For the quantitative indicators this resilience score is based on thresholds established in the literature, when available. Indicators assigned high importance scores and low resilience scores in a city are identified through the tool as “critical areas of
49 focus” and are represented in the upper right-hand corner of the quadrant plots for the city (see Figure 12) (EPA, 2017).
50 Figure 12: Example of how the EPA tool prioritizes action areas through a quadrant plot (EPA, 2017)
Two communities, Washington, DC and Worcester, MA, have used the tool so far, and lessons from each case study are included in the report. Specific challenges to implementing the tool included gathering city-specific knowledge, data availability and quality, and threshold-setting for quantitative indicators.
Lessons for Boston
The main purpose of this tool is to use indicators to identify and prioritize sectors that need resilience improvements within a city, and Boston can learn a lot from this approach when trying