Comparison of gene expression patterns among
Leishmania braziliensis clinical isolates showing a di
fferent
in vitro susceptibility to pentavalent antimony
V. ADAUI1,2, K. SCHNORBUSCH2,3, M. ZIMIC4, A. GUTIÉRREZ4, S. DECUYPERE2, M. VANAERSCHOT2,3, S. DE DONCKER2, I. MAES2, A. LLANOS-CUENTAS1, F. CHAPPUIS5, J. ARÉVALO1,4and J.-C. DUJARDIN2,3*
1
Instituto de Medicina Tropical Alexander von Humboldt, Universidad Peruana Cayetano Heredia, Lima, Peru 2
Unit of Molecular Parasitology, Department of Parasitology, Institute of Tropical Medicine Antwerp, Antwerp, Belgium 3
Department of Biomedical Sciences, Faculty of Pharmaceutical, Biomedical and Veterinary Sciences, University of Antwerp, Antwerp, Belgium
4
Laboratorios de Investigación y Desarrollo, Facultad de Ciencias y Filosofía, Universidad Peruana Cayetano Heredia, Lima, Peru
5
Hôpitaux Universitaires de Genève, Department of Community Medicine, Geneva, Switzerland
(Received 5 May 2010; revised 16 June 2010; accepted 18 June 2010; first published online 3 August 2010)
S U M M A R Y
Introduction. Evaluation of Leishmania drug susceptibility depends on in vitro SbVsusceptibility assays, which are labour-intensive and may give a biased view of the true parasite resistance. Molecular markers are urgently needed to improve and simplify the monitoring of SbV-resistance. We analysed here the gene expression profile of 21 L. braziliensis clinical isolates in vitro defined as SbV-resistant and -sensitive, in order to identify potential resistance markers.Methods. The differential expression of 13 genes involved in SbVmetabolism, oxidative stress or housekeeping functions was analysed during in vitro promastigote growth.Results. Expression profiles were up-regulated for 5 genes only, each time affecting a different set of isolates (mosaic picture of gene expression). Two genes, ODC (ornithine decarboxylase) and TRYR (trypanothione reductase), showed a significantly higher expression rate in the group of SbV-resistant compared to the group of SbV -sensitive parasites (P < 0·01). However, analysis of individual isolates showed both markers to explain only partially the drug resistance.Discussion. Our results might be explained by (i) the occurrence of a pleiotropic molecular mechanism leading to the in vitro SbV resistance and/or (ii) the existence of different epi-phenotypes not revealed by the in vitro SbVsusceptibility assays, but interfering with the gene expression patterns.
Key words: Leishmania (Viannia) braziliensis, antimony resistance, gene expression profiling, promastigotes, clinical isolates.
I N T R O D U C T I O N
Protozoan parasites of the genus Leishmania cause a broad spectrum of diseases, collectively known as leishmaniasis, that occur predominantly in tropical and subtropical regions. It is estimated that world-wide there is an annual incidence of 1·5–2 million new cases, with up to 350 million people at risk of infection (Murray et al.2005). Chemotherapy is the main control strategy for leishmaniasis and penta-valent antimonials (SbV) remain the mainstay, but their efficacy is threatened by the emergence of drug-resistant Leishmania parasites, as described in several endemic regions (Lira et al.1999; Hadighi et al.2006; Rojas et al.2006; Yardley et al.2006).
The in vitro intracellular amastigote-macrophage model is currently considered the gold standard for
susceptibility testing of Leishmania clinical isolates (Vermeersch et al.2009). But the screening entails a complex, labour-intensive and time-consuming pro-tocol, which involves in vitro infection of primary macrophages with an infective stage of Leishmania parasites (metacyclic promastigotes, axenic amasti-gotes, or ex vivo amastigotes), 3–7 days SbVexposure and the final step of microscopical evaluation of the different infections (Neal and Croft, 1984; Vermeersch et al. 2009). In view of this scenario, research is needed to identify molecular markers that would by-pass these limitations and would improve the epidemiological surveillance of SbV-resistance in thefield. These markers are not yet available, due to the limited knowledge of the molecular and biochemical mechanisms underlying resistance to SbV, especially in clinical isolates.
Even if intracellular amastigotes may be considered as the clinically relevant stage, the current proto-cols to study their gene expression require ex-treme care to ensure reproducibility of the results
* Corresponding author: Institute of Tropical Medicine, Unit of Molecular Parasitology, Nationalestraat 155, Antwerp B-2000, Belgium. Tel: + 32 3 2476355. Fax: + 32 3 2476359. E-mail: [email protected]
(Decuypere et al.2008) and are not adapted to the study of a large number of isolates. In contrast, promastigotes can be easily cultivated and harvested with minimal risk of affecting their biological state under well-controlled in vitro conditions (Decuypere et al.2008). Furthermore, molecular changes during promastigote differentiation serve as pre-adaptations for parasite transmission and initial infection stages in the vertebrate host (Sacks, 1989; Saxena et al. 2003). Hence, a time-course analysis of gene ex-pression changes throughout the promastigote growth cycle may show differences in molecular adaptations of parasites to intracellular life. Our previous study on L. donovani clinical isolates indi-cated that promastigote expression-curves could indeed reveal molecular features distinguishing iso-lates with different in vitro SbVsusceptibility pheno-types (Decuypere et al.2008). Moreover, considering that the in vitro growth rates could vary among different isolates, expression-curves are advisable to guarantee a reliable molecular comparison of identical developmental stages among various isolates under study.
In the present work, we aimed to compare the gene expression patterns of 21 L. braziliensis clinical
isolates showing 2 different phenotypes of in vitro SbV susceptibility (respectively sensitive and resist-ant). Promastigotes were used, as this life-stage can be easily cultured for high-throughput applications. We used real-time quantitative PCR (qPCR) to assess the RNA expression profiles of 13 genes encoding proteins with roles in SbV metabolism, oxidative stress or housekeeping functions and compared mol-ecular data to the 2 in vitro defined SbVphenotypes. M A T E R I A L S A N D M E T H O D S
Parasites and in vitro culture
In total, 21 L. braziliensis isolates were obtained from confirmed cutaneous or mucosal leishmaniasis patients recruited at the Institute of Tropical Medi-cine Alexander von Humboldt in Lima, Peru, within the framework of LeishNatDrug-R, a multicentre study on SbV treatment failure in leishmaniasis. Isolates were essentially obtained before treatment of patients, typed by PCR-RFLP analysis of hsp70 and cpb genes (Garcia et al. 2005) and tested as intracellular amastigotes for their in vitro suscepti-bility to SbV (Yardley et al.2006) (see Table 1for Table 1. Geographical origin, in vitro SbVand SbIIIsusceptibility data of Peruvian Leishmania braziliensis isolates included in the study and corresponding clinical data: disease (CL, cutaneous leishmaniasis, ML, mucosal leishmaniasis) and treatment outcome (TF, treatment failure; C, cure)
International Code L. braziliensis Geographical origin (state, province) A.I. SbV¥ A.I. SbIII¥ Disease Treatment ouctome SbV-sensitive isolates
MHOM/PE/01/PER005/0 Loreto, Ucayali 1 ND CL TF
MHOM/PE/03/PER130/0 Cusco, Echarate 1 0 CL TF
MHOM/PE/03/PER163/0 Huánuco, Leoncio Prado 2 0 CL C
MHOM/PE/03/PER186/0 Junín, Satipo 2 1 CL C
SbV-resistant isolates
MHOM/PE/01/PER002/0 Madre de Dios, Tambopata 6 2 CL TF
MHOM/PE/01/PER006/1 Junín, Satipo 6 + ND CL TF
MHOM/PE/01/PER012/1 Cusco, Calca 6 + ND CL TF
MHOM/PE/01/PER014/0 Junín, Satipo 6 + ND CL TF
MHOM/PE/02/PER015/0 Ucayali, Coronel Portillo 6 + 2 CL TF
MHOM/PE/02/PER016/0 Huánuco, Puerto Inca 6 + ND CL C
MHOM/PE/02/PER067/0 Cusco, La Convención 6 + ND CL TF
MHOM/PE/02/PER086/0 Pasco, Oxapampa 6 + 0 CL TF
MHOM/PE/02/PER094/0 Huánuco, Puerto Inca 6 2 CL C
MHOM/PE/02/PER104/0 Madre de Dios, Tambopata 6 + 6+ CL TF
MHOM/PE/02/PER122/0 Madre de Dios, Tambopata 6 + ND CL C
MHOM/PE/03/PER157/0 Madre de Dios, Tambopata 6 + 2 CL C
MHOM/PE/03/PER182/0 Ayacucho, La Mar 6 5 CL C
MHOM/PE/03/PER201/0 Loreto, Requena 6 1 ML C
MHOM/PE/03/PER215/0 Ucayali, Coronel Portillo 6 2 ML C
MHOM/PE/03/PER231/0 Junín, Satipo 5 2 ML C
MHOM/PE/03/PER260/0 Madre de Dios, Tahuamanu 6 2 ML C
¥
The in vitro SbVor SbIIIsusceptibility of a tested isolate was expressed as an‘activity index’ (A.I.), i.e. as the ratio of the ED50(50% effective dose) of that tested isolate to the ED50of the WHO reference L. braziliensis strain MHOM/BR/75/ M2903. Isolates with an A.I. of 0–2 were considered sensitive to SbVor SbIII(0, more sensitive than the reference strain M2903), while isolates with an A.I. of 3 or higher were considered resistant. Data shown were reported by Yardley et al. 2006.
184 V. Adaui and others
https:/www.cambridge.org/core/terms. https://doi.org/10.1017/S0031182010001095
summary of isolate features). Promastigote forms were grown at 24 °C in a biphasic medium consisting of rabbit blood agar overlaid with medium 199 (M199; Sigma) containing 20% heat-inactivated fetal bovine serum (FBS; Lonza Bioscience), 25 mM Hepes (pH 7·4), 100 units/ml penicillin and 100μg/ml streptomycin (Lonza). Growth curves were initiated by inoculating 3 × 10⁶ parasites/ml in 5 ml of M199-20% FBS. Two independently grown cultures and corresponding harvests at 24 h log phase), 72 h (late-log phase), 120 h (early-stationary phase) and 168 h (late-(early-stationary phase) time-points were performed in parallel for each isolate (biological replicates). RNA sampling proto-cols used here were described previously (Decuypere et al. 2005). All studied isolates showed similar growth behaviour during in vitro culture, thereby allowing synchronization of the promastigote growth cycle among isolates. The in vitro passage numbers (post-isolation from patients) were: (i) in the group of SbV-sensitive isolates: mean ± standard deviation (S.D.): 20·5 ± 5·9; (ii) in the group of SbV-resistant isolates: mean ±S.D.: 19·9 ± 4·5. There was no stat-istically significant difference in the mean passage number between isolate groups (P = 0·9, t-test). Previous work of our group showed that the in vitro SbV-resistant phenotype was stable far beyond these passage numbers (Laurent et al.2007, and unpub-lished results).
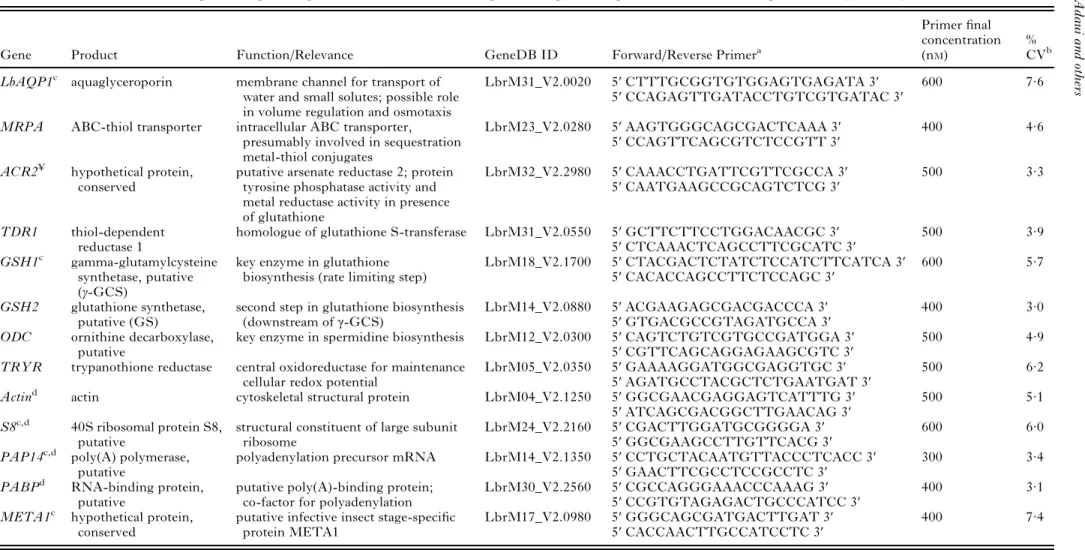
RNA isolation and real-time quantitative PCR Total RNA was isolated, analysed and reverse tran-scribed as detran-scribed before (Decuypere et al.2005). The resulting cDNA was diluted 10-fold, and 2μl was used as template in 25μl of SYBR Green-based quantitative PCR (qPCR) reactions on the iCycler (Bio-Rad), as previously described (Decuypere et al.2005), with only the modification that ampli-fication was done for 34 cycles. We analysed 13 genes. First, a set of 8 genes putatively involved in SbV metabolism and/or implicated in laboratory-induced resistance (Ashutosh et al. 2007). This set includes genes with predicted function in transport (LbAQP1, MRPA), thiol biosynthesis/redox meta-bolism (GSH1, GSH2, ODC, TRYR) and cellular reduction (ACR2, TDR1). Secondly, 2 genes result-ing from a differential screen of L. braziliensis SbV-resistant and -sensitive isolates and putatively involved in RNA poly(A)-tail metabolism (PABP, PAP14) (Decuypere,2007). Thirdly, 2 genes coding for housekeeping functions: Actin (cytoskeleton func-tion) and S8 (ribosomal funcfunc-tion). Fourthly, the META1 gene, up-regulated in the infective meta-cyclic stage of distinct Leishmania species (Uliana et al.1999; Gamboa et al.2007), was analysed using primers and conditions reported elsewhere (Gamboa et al.2007).
Full-length gene sequences in L. major and L. infantum genome databases were used as queries for BLAST searches in the L. braziliensis genome database (GeneDB, http://www.genedb.org/). Pri-mers (Table 2) were designed with Primer3 (Rozen and Skaletsky,2000) and tested for specificity using NCBI BLAST (http://www.ncbi.nlm.nih.gov/ BLAST).
Data analysis and statistics
Analysis was performed on duplicate biological samples that were each assayed in triplicate. The arithmetic average threshold cycle (Ct) was used for data analysis. For each primer set, reaction efficiency estimates were derived from standard curves gen-erated by serial dilutions of a cDNA pool of a promastigote sample. Efficiencies ranged between 1·84 and 2·07 and correlation coefficients were 50·997 (iCycler 3.1 software, Bio-Rad).
The Ct values of each qPCR run were imported as Excel files into qBasePlus (Biogazelle NV, Zulte, Belgium), a software for real-time PCR data analysis based on the geNorm method (Vandesompele et al. 2002) and qBase technology (Hellemans et al.2007). Four genes (ACR2, GSH2, PAP14 and TDR1) showed the most stable expression in our sample panel (geNorm stability mean M-value and mean coefficient of variation lower than 0·35 and 15%, respectively) and data were normalized to their geo-metric mean. The analysis of 13 genes in 168 samples (21 parasite isolates × 4 time-points in duplicate harvests) could be performed as one integrated ex-periment by performing inter-plate calibrations (based on 3 cDNA samples included in each qPCR run for that purpose). Overall, 1084 out of 1092 data points did not differ by more than 20% in CV (coefficient of variation) of normalized relative quantities between biological replicates, demon-strating the reproducibility of our methodology (Table 2).
The fold change of gene expression between log- and stationary-phase promastigotes (time-points 24 h and 72 h vs 120 h and 168 h of the growth curves, respectively) was determined for each parasite isolate, further called FC-PRO. The linear component of the variability of the expression level of each gene during in vitro growth was modelled in a multiple linear regression. Predictors tested were the examined time-points during in vitro promastigote growth and the SbV susceptibility of the studied isolates. The significance of the regression coefficient corres-ponding to the SbV-susceptibility was used to test difference in intercepts (change in baseline or initial gene expression level) between the SbV-sensitive (further called SbV-S) and SbV-resistant (further called SbV-R) isolates. The interaction between the examined time and the SbV susceptibility was
Table 2. Genes selected for expression profiling of Leishmania braziliensis: primer sequences, qPCR conditions and reproducibility of assays
Gene Product Function/Relevance GeneDB ID Forward/Reverse Primera
Primerfinal concentration (nM)
% CVb LbAQP1c aquaglyceroporin membrane channel for transport of
water and small solutes; possible role in volume regulation and osmotaxis
LbrM31_V2.0020 5′ CTTTGCGGTGTGGAGTGAGATA 3′ 600 7·6
5′ CCAGAGTTGATACCTGTCGTGATAC 3′ MRPA ABC-thiol transporter intracellular ABC transporter,
presumably involved in sequestration metal-thiol conjugates
LbrM23_V2.0280 5′ AAGTGGGCAGCGACTCAAA 3′ 400 4·6
5′ CCAGTTCAGCGTCTCCGTT 3′ ACR2¥ hypothetical protein,
conserved
putative arsenate reductase 2; protein tyrosine phosphatase activity and metal reductase activity in presence of glutathione
LbrM32_V2.2980 5′ CAAACCTGATTCGTTCGCCA 3′ 500 3·3
5′ CAATGAAGCCGCAGTCTCG 3′
TDR1 thiol-dependent reductase 1
homologue of glutathione S-transferase LbrM31_V2.0550 5′ GCTTCTTCCTGGACAACGC 3′ 500 3·9 5′ CTCAAACTCAGCCTTCGCATC 3′
GSH1c gamma-glutamylcysteine synthetase, putative (γ-GCS)
key enzyme in glutathione biosynthesis (rate limiting step)
LbrM18_V2.1700 5′ CTACGACTCTATCTCCATCTTCATCA 3′ 600 5·7 5′ CACACCAGCCTTCTCCAGC 3′
GSH2 glutathione synthetase, putative (GS)
second step in glutathione biosynthesis (downstream ofγ-GCS)
LbrM14_V2.0880 5′ ACGAAGAGCGACGACCCA 3′ 400 3·0
5′ GTGACGCCGTAGATGCCA 3′ ODC ornithine decarboxylase,
putative
key enzyme in spermidine biosynthesis LbrM12_V2.0300 5′ CAGTCTGTCGTGCCGATGGA 3′ 500 4·9 5′ CGTTCAGCAGGAGAAGCGTC 3′
TRYR trypanothione reductase central oxidoreductase for maintenance cellular redox potential
LbrM05_V2.0350 5′ GAAAAGGATGGCGAGGTGC 3′ 500 6·2
5′ AGATGCCTACGCTCTGAATGAT 3′
Actind actin cytoskeletal structural protein LbrM04_V2.1250 5′ GGCGAACGAGGAGTCATTTG 3′ 500 5·1
5′ ATCAGCGACGGCTTGAACAG 3′ S8c,d 40S ribosomal protein S8,
putative
structural constituent of large subunit ribosome
LbrM24_V2.2160 5′ CGACTTGGATGCGGGGA 3′ 600 6·0
5′ GGCGAAGCCTTGTTCACG 3′ PAP14c,d poly(A) polymerase,
putative
polyadenylation precursor mRNA LbrM14_V2.1350 5′ CCTGCTACAATGTTACCCTCACC 3′ 300 3·4 5′ GAACTTCGCCTCCGCCTC 3′
PABPd RNA-binding protein, putative
putative poly(A)-binding protein; co-factor for polyadenylation
LbrM30_V2.2560 5′ CGCCAGGGAAACCCAAAG 3′ 400 3·1
5′ CCGTGTAGAGACTGCCCATCC 3′ META1c hypothetical protein,
conserved
putative infective insect stage-specific protein META1
LbrM17_V2.0980 5′ GGGCAGCGATGACTTGAT 3′ 400 7·4
5′ CACCAACTTGCCATCCTC 3′
GeneDB ID, gene Accession number on GeneDB (http://www.genedb.org/); Product, predicted gene function based on orthologues in the different TriTrypDB organisms [annotation from GeneDB and TriTrypDB (http://tritrypdb.org/tritrypdb/) databases].
a
Leishmania-specific primer sets.
b
Mean coefficient of variation [CV=(standard deviation/mean)*100] of normalized relative quantities between biological replicates (calculated across all measurements).
c
Primers and qPCR conditions as reported previously (Gamboa et al. 2007).
d
Primers developed by Decuypere (2007).
¥
Potential orthologous gene and protein sequences in L. major (LmjF32.2740 at GeneDB) are annotated as ACR2 and Sb(V)-As(V) reductase (LmACR2) at GenBank (Accession
numbers: AY567836.1, AAS73185.1, respectively). 186
V . Adaui and others https:/www.cambridge.org/core/terms . https://doi.org/10.1017/S0031182010001095 Downloaded from https:/www.cambridge.org/core
. University of Basel Library
, on
30 May 2017 at 17:39:32
included, and the significance of the regression coefficient corresponding to the interaction term was used to test difference in slopes (change in gene expression level along time) between the SbV-S and SbV-R isolates. To increase the strength of the evidence, a significance level of 0·01 was considered. To achieve biological significance we only considered cases where the slope ratio or the intercept ratio (between the SbV-S and SbV-R groups) was52, as recommended elsewhere (McCarthy and Smyth, 2009).
A multiple logistic regression to model the SbV susceptibility using the ODC and TRYR slopes (gene expression rate) and intercepts (baseline gene expression level) as predictors for all the isolates was performed. A linear score to estimate the probability of SbV-resistance was developed based on the best regression model. An isolate was predicted to be SbV-resistant if the probability was greater than the best cutoff (Pr-cutoff). A Receiver Operating Charac-teristic curve (ROC) was calculated and the Pr-cutoff was estimated in order to maximize the Youden’s J-index (Sensitivity + Specificity−1) (Youden, 1950). The 95% Confidence Intervals (CI) for the estimated sensitivity and specificity were calculated for proportions following a binomial
distribution. All the analysis was performed using the statistical software Stata 10 (StataCorp).
R E S U L T S
Gene expression profiling throughout the promastigote growth cycle of L. braziliensis isolates
In order to assess for each gene the extent of expression regulation during in vitro promastigote growth/differentiation of L. braziliensis, we examined the fold change in mRNA abundance from log- to stationary phase (FC-PRO) in all isolates. The expression level of 8 genes did not change signi fi-cantly during the promastigote growth cycle (FC-PRO <2), a pattern common to all 21 isolates. Genes in this category include: ACR2, Actin, GSH2, MRPA, PABP, PAP14, S8 and TDR1. Five genes showed a significant up-regulation of expression (FC-PRO 52), each of them in a different set of isolates, hereby providing a‘mosaic’ picture of gene expression in the present sample (Fig. 1). Three of these genes showed significant up-regulation in very few isolates: GSH1 (2 isolates, both SbV-R), META1 (4 isolates– one SbV-S and 3 SbV-R) and ODC (4 isolates, all SbV-R). The last two genes, LbAQP1
Fig. 1. Gene expression and phenotype mosaic. Schematic representation of the significantly modulated gene expression (highlighted in black if FC-PRO52, see Materials and Methods section) in the 21 isolates here studied. Schematic representation of the phenotype diversity: (i) in vitro SbVsusceptibility (grey if resistant), (ii) in vitro SbIIIsusceptibility (grey if resistant; N, not available), (iii) clinical form (grey if ML, otherwise CL) and (iv) treatment outcome (grey if failure, otherwise cure).
and TRYR, showed a FC-PRO52 in more than 50% of the isolates (19/21 isolates for LbAQP1; 12/21 isolates for TRYR). The isolates showing growth-dependent changes in LbAQP1 corresponded to the 4 SbV-S isolates and 15/17 SbV-R isolates. As for TRYR, 3/4 SbV-S isolates and 9/17 SbV-R isolates showed modulated expression during promastigote growth. Interestingly, when other phenotypes associ-ated with the parasites were taken into consideration, it appeared that 9/10 isolates from patients with treatment failure showed a significant up-regulation of TRYR expression during growth, vs 3/11 from cured patients (Fig. 1).
Comparison of gene expression profiles during promastigote growth between L. braziliensis isolates, in relation to the in vitro SbVsusceptibility
Next, we compared the gene expression patterns between SbV-S and SbV-R L. braziliensis isolates. We did a multiple linear regression in order to identify genes showing differential expression be-tween these 2 groups of isolates. We did not find significant differences in the baseline expression level (intercept); only the slopes were informative, hereby further validating the importance of analysing gene expression curves. A significant difference was observed between SbV-S and SbV-R isolates in slopes for 2 genes, ODC and TRYR (Table 3). The change in expression level along time (slope) of both genes in the group of SbV-R isolates was significantly higher than that in the group of SbV-S isolates (P < 0·01) (Table 3,Fig. 2). For the rest of the examined genes, the slopes of the expression curves were similar between the 2 groups of SbV-S and SbV-R isolates (Table 3).
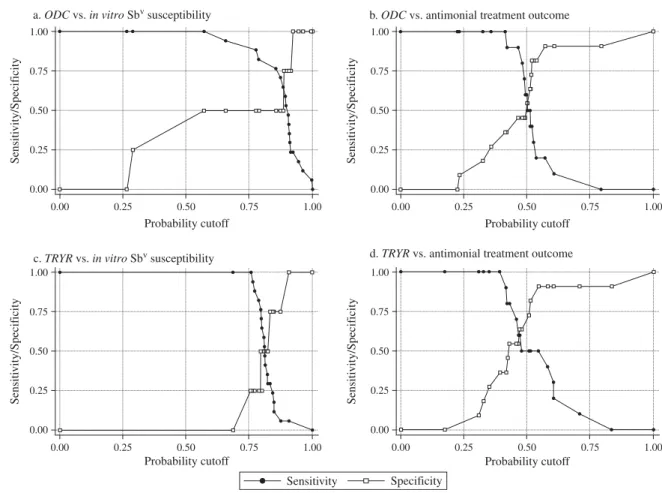
Focusing on ODC and TRYR genes, we also assessed the slopes of the expression curves of indi-vidual isolates (Fig. 3A,B) and calculated the sen-sitivity and specificity of each marker by comparison to the in vitro phenotype of SbV-susceptibility. The best logistic model to predict SbV-resistance only included the expression rate (slope) of ODC gene (P = 0·06). Based on the Pr-cutoff that maxi-mized the Youden’s J index, the sensitivity and specificity of the ODC expression rate to detect SbV -resistance was 100% (95% CI: [100%, 100%]) and 50% (95% CI: [28%, 71%]) respectively. Reciprocally, specificity of 100% was associated with a sensitivity of 24%. The sets of sensitivity/specificity and their relationship are shown inFig. 4a. The assay efficacy, measured by Youden’s J index, was 0·5, and the area under the ROC curve was 0·72. With regard to data of TRYR, the logistic model to predict SbV -resistance did not achieve statistical significance (P = 0·61). Based on the Pr-cutoff that maximized the Youden’s J index, the sensitivity and specificity of the TRYR expression rate to detect SbV-resistance
was 76% (95% CI: [51%, 92%]) and 50% (95% CI: [44%, 65%]) respectively (Fig. 4c). The assay efficacy, measured by Youden’s J index, was 0·26, and the area under the ROC curve was 0·53.
Comparison of gene expression profiles during promastigote growth between L. braziliensis isolates, in relation to the treatment outcome
Finally, we analysed among individual isolates the sensitivity and specificity of ODC and TRYR slope values in comparison to the antimonial treatment outcome. With regard to data of ODC and TRYR, Table 3. Comparison of slope and intercept
parameters of modelled expression levels of examined genes between SbV-sensitive and SbV-resistant Leishmania braziliensis isolates
Gene SbV-S isolates (n = 4) Slope/ Intercept§ SbV-R isolates (n = 17) Slope/ Intercept§ Slope/ Intercept difference SbV-S vs. SbV-R isolates P-value ACR2 0·0011 −0·0004 0·0410 0·9284 0·9857 0·2400 Actin −0·0014 −0·0033 0·3990 1·0556 1·3199 0·0690 LbAQP1 0·0122 0·0087 0·2910 0·0921 0·2699 0·4230 GSH1 0·0047 0·0050 0·4230 0·6191 0·5966 0·8220 GSH2 0·0004 −0·0004 0·3450 0·9506 1·0091 0·2670 META1 0·0083 0·0010 0·0430 0·4905 0·7126 0·3450 MRPA 0·0015 0·0011 0·7080 0·8588 0·9118 0·4920 ODC 0·0029 0·0092 0·0010 0·6869 0·4715 0·0850 PABP 0·0006 0·0006 0·9960 1·0421 0·9760 0·5400 PAP14 0·0002 0·0011 0·1720 1·0495 0·9214 0·0050 S8 −0·0009 0·0004 0·4050 1·0409 1·0644 0·8180 TDR1 −0·0015 −0·0006 0·4420 1·0946 1·1209 0·7120 TRYR 0·0038 0·0121 0·0000 0·5116 0·3703 0·2410
SbV-S, in vitro sensitive to pentavalent antimony; SbV-R, in vitro resistant to pentavalent antimony; n, number of isolates in each group.
§ Shown are the slopes (first line in italics) and the inter-cepts (second line) derived from multiple linear regression analysis of the variability of the expression level of each gene during promastigote growth/differentiation. Genes for which (i) statistically significant comparisons (P<0·01) between the groups of SbV-S and SbV-R isolates and (ii) ratio between slopes or intercepts was52 (see Materials and Methods section) are highlighted in bold text.
188 V. Adaui and others
https:/www.cambridge.org/core/terms. https://doi.org/10.1017/S0031182010001095
the logistic model to predict treatment outcome did not achieve statistical significance (P=0·291 for ODC, and P = 0·229 for TRYR). Based on the Pr-cutoff that maximized the Youden’s J index, the sensitivity and specificity of the ODC expression rate to detect antimonial treatment failure was 100% (95% CI: [100%, 100%]) and 36% (95% CI: [15%, 57%]) respectively (Fig. 4b). The assay efficacy, measured by Youden’s J index, was 0·36, and the area under the ROC curve was 0·6364. With regard to data of TRYR, the sensitivity and specificity of the TRYR expression rate to detect antimonial treatment fail-ure was 50% (95% CI: [28%, 71%]) and 90% (95% CI: [77%, 100%]) respectively (Fig. 4d). The assay
efficacy, measured by Youden’s J index, was 0·41, and the area under the ROC curve was 0·70.
D I S C U S S I O N
The present paper is, to our knowledge, the first to report results of the molecular characterization of clinical isolates of L. braziliensis in the context of in vitro SbV susceptibility. Our targeted approach focused on the analysis of expression profiles of genes putatively involved in SbV metabolism and/ or implicated in laboratory-induced resistance (Ashutosh et al. 2007) in the present collection of L. braziliensis isolates, naturally SbV-resistant or
Fig. 2. Differential expression rate of genes ODC and TRYR between SbV-sensitive (n = 4) and SbV-resistant (n = 17) Leishmania braziliensis isolates. The relative expression levels of each gene [re-scaled relative to the sample with the lowest expression] and the estimated linear regression lines are shown for each group of isolates. The 2 independent biological replicates analysed at each time-point for a given isolate are labelled with the same symbol. Time-points during in vitro promastigote growth/differentiation: 24 h, parasites harvested at early-log phase; 72 h, parasites harvested at late-log phase; 120 h, parasites harvested at early-stationary phase; 168 h, parasites harvested at late-stationary phase.
-sensitive. It allowed assessment of the extent and types of variability in gene expression patterns that occur under a natural context.
Herein, we first analysed the gene expression patterns throughout the promastigote growth cycle of L. braziliensis isolates, independently of their in vitro SbVsusceptibility. This revealed for 8 genes a striking picture of non-modulated transcript pat-terns during the growth cycle. In the 5 remaining genes (GSH1, META1 and ODC, LbAQP1 and TRYR), there was a ‘mosaic’ of up-regulated ex-pression among the studied isolates. In the context of stage-related gene expression, the META1 gene deserves specific attention. Indeed, it has already been shown to be up-regulated in the infective metacyclic stage of distinct Leishmania species (Uliana et al.1999; Gamboa et al.2007), but in the present study, less than 25% of isolates exhibited a significantly higher expression in late-stationary phase (FC-PRO 52). Even if all our isolates were infective (as demonstrated by the in vitro suscepti-bility assays undertaken in macrophages, Yardley et al.2006; Rijal et al.2007), further work is needed to determine (i) if this low proportion of META1 expression up-regulation reflects variations in the level of metacyclogenesis among our isolates as
reported elsewhere (Da Silva and Sacks, 1987) or (ii) if the validity of META1 as a metacyclogenesis marker should be questioned.
In a second stage, we analysed the gene expression patterns in the context of the in vitro SbVresistance as defined by the reference biological assays. Two genes, ODC and TRYR, showed a significantly different change in expression level (slope of the expression curve) between the 2 groups of in vitro SbV-S and SbV-R isolates. However, analysis of individual slopes revealed an overlap in the distribution of slopes, with a direct impact on the sensitivity and specificity of the respective markers. High sensitivity was generally accompanied by low specificity and vice-versa. Taking an arbitrary cut-off with the highest specificity, ODC slopes provided the best performances among the genes studied, but this corresponded to a sensitivity of 24% only. In other words, when using this marker under stringent con-ditions, it could only identify a fourth of the in vitro SbVresistant isolates of the present sample.
The low sensitivities of ODC and TRYR markers by comparison to the in vitro-defined SbV suscepti-bility could be explained in different ways. First, different mechanisms of resistance might have been selected by different L. braziliensis subpopulations. Thus, in a subpopulation of L. braziliensis isolates, alteration of ODC gene expression might be linked with resistance, a phenomenon reported in metal-resistant laboratory mutants (Haimeur et al. 1999). In another L. braziliensis subpopulation, other gene (s) would be involved, like TRYR, also reported in L. donovani to be related with resistance (Mandal et al. 2007; Mittal et al. 2007). In other subpopu-lations, other genes not detected yet could be in-volved. The hypothesis of a pleiotropic response of the parasite to drug pressure is supported by previous observations in L. donovani (Decuypere, 2007; Laurent et al. 2007). Analysis of additional genes possibly involved in antimony resistance might provide a clue to this question, but with the avenue of new high-throughput sequencing technologies, it would be more powerful in a next exploration stage to address the whole genome or transcriptome than to pursue with targeted, and hereby possibly biased, studies (Dujardin,2009). Later, the most robust (set of) markers could be assembled in a simple monitor-ing tool.
Secondly, it is possible that molecular adaptations in L. braziliensis promastigote stages could be di ffer-ent than in L. donovani, impeding the discrimination of SbV-resistant and -sensitive isolates by gene expression studies. Our previous study on Nepalese L. donovani clinical isolates indicated that pro-mastigote expression-curves could reveal molecular features distinguishing isolates with different in vitro SbV susceptibility phenotypes (Decuypere et al. 2008). The comparative genomic analysis of L. major, L. infantum and L. braziliensis (Peacock
Fig. 3. Distribution of slopes corresponding to the gene expression profile of individual isolates resistant or sensitive to SbV, for ODC (A) and TRYR (B). The horizontal line denotes the mean of slope values in each group of isolates.
190 V. Adaui and others
https:/www.cambridge.org/core/terms. https://doi.org/10.1017/S0031182010001095
et al.2007; Smith et al. 2007) showed the presence of a putative RNAi machinery in the latter species, which might have an effect on gene expression regulation. In line with this, the comparison of the organization of the H locus conserved repeats between L. braziliensis and L. major resistant mutants did not show amplified episomal molecules in L. braziliensis (Dias et al. 2007). Furthermore, we cannot exclude that point mutations in important functional sites could be also related to resistance in L. braziliensis.
Thirdly, the antimony susceptibility phenotype definition, as currently established by the in vitro macrophage-amastigote assays, should also be con-sidered. Indeed, different epi-phenotypes to which the parasites could have developed specific adap-tations might remain hidden in the in vitro SbV susceptibility assays, but interfering with the gene expression patterns. For instance, (i) the variable adaptation to the macrophage effectors in the im-munological context of the clinical infection (absent in the in vitro susceptibility assays) or (ii) the resistance to the reduced form of the drug, SbIII(Yardley et al.2006; Rijal et al.2007). These epi-phenotypes would explain the incongruences between the parasites’ in vitro SbV resistance and chemotherapy failure reported elsewhere (Yardley
et al. 2006; Rijal et al. 2007) and illustrated in Table 1. More specifically, half of the parasites isolated before treatment from patients who later showed a definitive cure were found in vitro to be resistant to SbV. Interestingly, the P-value of the logistic model for TRYR results was much lower in the context of treatment outcome (0·229) than in the context of in vitro SbVresistance (0·61). This is in line with the observations made when classifying the isolates according to the significant up-regulation (FC-PRO52) of TRYR expression during growth: (i) 9/10 and 3/11 in isolates from patients with treatment failure and success respectively and (ii) 9/17 and 3/4 in isolates respectively SbV-resistant and sensitive. In a parallel study of Brazilian isolates, using the same protocol as here described, we did notfind any informative difference in L. braziliensis isolates from SbV treatment failure, but sample size was much smaller than in the present study (Torres et al. 2010). However, analysis of 25 L. guyanensis isolates revealed an overexpression of GSH1 in promastigotes of strains from treatment failure, hereby further validating our methodology (Torres et al. 2010). In the present study, GSH1 was not as discriminative in L. braziliensis and this could reflect differences between species or geographical popu-lations (Arevalo et al.2007).
1.00 0.75 0.50 0.25 0.00 0.00 0.25 0.50 0.75 1.00 Sensiti vity/Specif icity 1.00 0.75 0.50 0.25 0.00 0.00 0.25 0.50 0.75 1.00 Sensiti vity/Specif icity 1.00 0.75 0.50 0.25 0.00 0.00 0.25 0.50 0.75 1.00 Sensiti vity/Specif icity 1.00 0.75 0.50 0.25 0.00 0.00 0.25 0.50 0.75 1.00 Sensiti vity/Specif icity
Probability cutoff Probability cutoff
Probability cutoff Probability cutoff a. ODC vs. in vitro Sbv susceptibility b. ODC vs. antimonial treatment outcome
c. TRYR vs. in vitro Sbv susceptibility d. TRYR vs. antimonial treatment outcome
Sensitivity Specificity
Fig. 4. Sensitivity/Specificity curves calculated from the multiple logistic regression model using the ODC or TRYR slopes as predictors of in vitro SbVsusceptibility (a, c) or antimonial treatment outcome (b, d) for all the isolates.
Further work with larger cohorts would be needed to verify these trends. Special attention could also be paid to the analysis of parasites isolated after treatment failure (in the present study, most of them were isolated before treatment), as drug pressure could also affect or select the expression pattern of several genes.
Variation in the gene expression of ODC and TRYR might thus contribute to explain only a small part of the variation in phenotype of in vitro SbV susceptibility in the present sample of L. braziliensis isolates. Further work is needed to identify a marker or a set of markers of SbVresistance as well as the best parasite stage in which to apply it. This molecular exploration should take into account a phenotype definition that may be more complex than that revealed by the in vitro SbV biological assays. Certainly, a second step in our exploration should consider the amastigote stages. Indeed, this latter model already implied overexpressed genes in SbV -resistant L. donovani isolates (Decuypere et al.2005; Mukherjee et al. 2007). However, this life stage is extremely sensitive to minimal disturbance of the parasite’s environment during harvesting, hence extreme care is needed to ‘freeze’ gene expression levels instantly (Decuypere et al.2008). In that sense, axenic amastigotes might represent an interesting biological compromise between promastigotes and intracellular amastigotes, but axenization is not straightforward for some species and for clinical isolates.
A C K N O W L E D G E M E N T S
This work was supported by the European Commission
(INCO-DEV contracts LeishNatDrug-R–
ICA4-CT-2001-10076, and LeishEpiNetSA–
INCO-CT2005-015407); and the Directorate-General for Development Cooperation of the Belgian Government (framework agreement 02– project 95501, and framework agreement 03– project 95502).
R E F E R E N C E S
Ashutosh, Sundar, S. and Goyal, N. (2007). Molecular mechanisms of antimony resistance in Leishmania. Journal of Medical Microbiology56, 143–153. Arevalo, J., Ramirez, L., Adaui, V., Zimic, M.,
Tulliano, G., Miranda-Verastegui, C., Lazo, M., Loayza-Muro, R., De Doncker, S., Maurer, A., Chappuis, F., Dujardin, J. C. and Llanos-Cuentas, A. (2007). The influence of Leishmania (Viannia) species on the response to antimonial treatment of patients with American Tegumentary Leishmaniasis. Journal of Infectious Diseases195, 1846–1851.
Da Silva, R. and Sacks, D. L. (1987). Metacyclogenesis is a major determinant of Leishmania promastigote virulence and attenuation. Infection and Immunity55, 2802–2806.
Decuypere, S. (2007). Antimonial treatment failure in anthroponotic visceral leishmaniasis: towards improved
tools and strategies for epidemiological surveillance and disease control. Ph.D. thesis. University of Antwerp, Antwerp, Belgium.
Decuypere, S., Rijal, S., Yardley, V., De Doncker, S., Laurent, T., Khanal, B., Chappuis, F. and
Dujardin, J. C. (2005). Gene expression analysis of the mechanism of natural Sb(V) resistance in Leishmania donovani isolates from Nepal. Antimicrobial Agents and Chemotherapy49, 4616–4621.
Decuypere, S., Vanaerschot, M., Rijal, S., Yardley, V., Maes, L., De Doncker, S., Chappuis, F. and Dujardin, J. C. (2008). Gene expression profiling of Leishmania (Leishmania) donovani: overcoming technical variation and exploiting biological variation. Parasitology135, 183–194.
Dias, F. C., Ruiz, J. C., Lopes, W. C., Squina, F. M., Renzi, A., Cruz, A. K. and Tosi, L. R. (2007). Organization of H locus conserved repeats in Leishmania (Viannia) braziliensis correlates with lack of gene amplification and drug resistance. Parasitology Research 101, 667–676.
Dujardin, J. C. (2009). Structure, dynamics and function of Leishmania genome: resolving the puzzle of infection, genetics and evolution? Infection, Genetics and Evolution9, 290–297.
Gamboa, D., Van Eys, G., Victoir, K., Torres, K., Adaui, V., Arevalo, J. and Dujardin, J. C. (2007). Putative markers of infective life stages in Leishmania (Viannia) braziliensis. Parasitology134, 1689–1698. Garcia, A. L., Kindt, A., Quispe-Tintaya, K. W.,
Bermudez, H., Llanos, A., Arevalo, J., Bañuls, A. L., De Doncker, S., Le Ray, D. and Dujardin, J. C. (2005). American tegumentary leishmaniasis: antigen-gene polymorphism, taxonomy and clinical pleomorphism. Infection, Genetics and Evolution5, 109–116.
Hadighi, R., Mohebali, M., Boucher, P., Hajjaran, H., Khamesipour, A. and Ouellette, M. (2006).
Unresponsiveness to Glucantime treatment in Iranian cutaneous leishmaniasis due to drug-resistant
Leishmania tropica parasites. PLoS Medicine3, e162. Haimeur, A., Guimond, C., Pilote, S.,
Mukhopadhyay, R., Rosen, B. P., Poulin, R. and Ouellette, M. (1999). Elevated levels of polyamines and trypanothione resulting from overexpression of the ornithine decarboxylase gene in arsenite-resistant Leishmania. Molecular Microbiology 34, 726–735.
Hellemans, J., Mortier, G., De Paepe, A., Speleman, F. and Vandesompele, J. (2007).
qBase relative quantification framework and software for management and automated analysis of real-time quantitative PCR data. Genome Biology8, R19. Laurent, T., Rijal, S., Yardley, V., Croft, S., De
Doncker, S., Decuypere, S., Khanal, B., Singh, R., Schönian, G., Kuhls, K., Chappuis, F. and
Dujardin, J. C. (2007). Epidemiological dynamics of antimonial resistance in Leishmania donovani: genotyping reveals a polyclonal population structure among naturally-resistant clinical isolates from Nepal. Infection, Genetics and Evolution7, 206–212.
Lira, R., Sundar, S., Makharia, A., Kenney, R., Gam, A., Saraiva, E. and Sacks, D. (1999). Evidence that the high incidence of treatment failures in Indian
192 V. Adaui and others
https:/www.cambridge.org/core/terms. https://doi.org/10.1017/S0031182010001095
kala-azar is due to the emergence of antimony-resistant strains of Leishmania donovani. The Journal of Infectious Diseases180, 564–567.
Mandal, G., Wyllie, S., Singh, N., Sundar, S.,
Fairlamb, A. H. and Chatterjee, M. (2007). Increased levels of thiols protect antimony unresponsive
Leishmania donovanifield isolates against reactive oxygen species generated by trivalent antimony. Parasitology 134, 1679–1687.
McCarthy, D. J. and Smyth, G. K. (2009). Testing significance relative to a fold-change threshold is a TREAT. Bioinformatics25, 765–771.
Mittal, M. K., Rai, S., Ashutosh, Ravinder, Gupta, S., Sundar, S. and Goyal, N. (2007). Characterization of natural antimony resistance in Leishmania donovani isolates. American Journal of Tropical Medicine and Hygiene76, 681–688.
Mukherjee, A., Padmanabhan, P. K., Singh, S., Roy, G., Girard, I., Chatterjee, M., Ouellette, M. and Madhubala, R. (2007). Role of ABC transporter MRPA, gamma-glutamylcysteine synthetase and ornithine decarboxylase in natural antimony-resistant isolates of Leishmania donovani. Journal of Antimicrobial Chemotherapy59, 204–211.
Murray, H. W., Berman, J. D., Davies, C. R. and Saravia, N. G. (2005). Advances in leishmaniasis. Lancet366, 1561–1577.
Neal, R. A. and Croft, S. L. (1984). An in-vitro system for determining the activity of compounds against the intracellular amastigote form of Leishmania donovani. Journal of Antimicrobial Chemotherapy14, 463–475.
Peacock, C. S., Seeger, K., Harris, D., Murphy, L., Ruiz, J. C., Quail, M. A., Peters, N., Adlem, E., Tivey, A., Aslett, M., Kerhornou, A., Ivens, A. and others. (2007). Comparative genomic analysis of three Leishmania species that cause diverse human disease. Nature Genetics39, 839–847.
Rijal, S., Yardley, V., Chappuis, F., Decuypere, S., Khanal, B., Singh, R., Boelaert, M., De Doncker, S., Croft, S. and Dujardin, J. C. (2007). Antimonial treatment of visceral leishmaniasis: are current in vitro susceptibility assays adequate for prognosis of in vivo therapy outcome? Microbes and Infection9, 529–535. Rojas, R., Valderrama, L., Valderrama, M.,
Varona, M. X., Ouellette, M. and Saravia, N. G. (2006). Resistance to antimony and treatment failure in human Leishmania (Viannia) infection. The Journal of Infectious Diseases193, 1375–1383.
Rozen, S. and Skaletsky, H. (2000). Primer3 on the WWW for general users and for biologist programmers. Methods in Molecular Biology132, 365–386.
Sacks, D. L. (1989). Metacyclogenesis in Leishmania promastigotes. Experimental Parasitology69, 100–103. Saxena, A., Worthey, E. A., Yan, S., Leland, A.,
Stuart, K. D. and Myler, P. J. (2003). Evaluation of differential gene expression in Leishmania major Friedlin procyclics and metacyclics using DNA microarray analysis. Molecular and Biochemical Parasitology129, 103–114.
Smith, D. F., Peacock, C. S. and Cruz, A. K. (2007). Comparative genomics: from genotype to disease phenotype in the leishmaniases. International Journal for Parasitology37, 1173–1186.
Torres, D. C., Adaui, V., Alves, M. R.,
Romero, G. A. S., Arevalo, J., Cupolillo, E. and Dujardin, J. C. (2010). Gene expression profiling in Leishmania braziliensis and Leishmania guyanensis clinical isolates with different treatment outcome from Brazil. Infection Genetics and Evolution May 15 (Epub ahead of print).
Uliana, S. R., Goyal, N., Freymüller, E. and Smith, D. F. (1999). Leishmania: overexpression and comparative structural analysis of the
stage-regulated meta 1 gene. Experimental Parasitology 92, 183–191.
Vandesompele, J., De Preter, K., Pattyn, F., Poppe, B., Van Roy, N., De Paepe, A. and Speleman, F. (2002). Accurate normalization of real-time quantitative RT-PCR data by geometric averaging of multiple internal control genes. Genome Biology3, research0034.I-0034.II.
Vermeersch, M., da Luz, R. I., Toté, K.,
Timmermans, J. P., Cos, P. and Maes, L. (2009). In vitro susceptibilities of Leishmania donovani promastigote and amastigote stages to antileishmanial reference drugs: practical relevance of stage-specific differences. Antimicrobial Agents and Chemotherapy 53, 3855–3859.
Yardley, V., Ortuño, N., Llanos-Cuentas, A.,
Chappuis, F., De Doncker, S., Ramirez, L., Croft, S., Arevalo, J., Adaui, V., Bermudez, H., Decuypere, S. and Dujardin, J. C. (2006). American tegumentary leishmaniasis: Is antimonial treatment outcome related to parasite drug susceptibility? The Journal of Infectious Diseases194, 1168–1175.
Youden, W. J. (1950). Index for rating diagnostic tests. Cancer3, 32–35.