HAL Id: hal-02325041
https://hal.archives-ouvertes.fr/hal-02325041
Submitted on 22 Oct 2019
HAL is a multi-disciplinary open access
archive for the deposit and dissemination of
sci-entific research documents, whether they are
pub-lished or not. The documents may come from
teaching and research institutions in France or
abroad, or from public or private research centers.
L’archive ouverte pluridisciplinaire HAL, est
destinée au dépôt et à la diffusion de documents
scientifiques de niveau recherche, publiés ou non,
émanant des établissements d’enseignement et de
recherche français ou étrangers, des laboratoires
publics ou privés.
Network
Laurianne Vagharchakian, Ghislaine Dehaene-Lambertz, Christophe Pallier,
Stanislas Dehaene
To cite this version:
Laurianne Vagharchakian, Ghislaine Dehaene-Lambertz, Christophe Pallier, Stanislas Dehaene. A
Temporal Bottleneck in the Language Comprehension Network. Journal of Neuroscience, Society for
Neuroscience, 2012, 32 (26), pp.9089-9102. �10.1523/JNEUROSCI.5685-11.2012�. �hal-02325041�
Behavioral/Systems/Cognitive
A Temporal Bottleneck in the Language Comprehension
Network
Laurianne Vagharchakian,
1,2,3Ghislaine Dehaene-Lambertz,
1,2,3Christophe Pallier,
1,2,3and Stanislas Dehaene
1,2,3,4 1Institut National de la Sante´ et de la Recherche Me´dicale, Cognitive Neuroimaging Unit, F91191 Gif-sur-Yvette, France,2Commissariat a` L’E´nergieAtomique et aux E´nergies Alternatives, NeuroSpin Center, F91191 Gif-sur-Yvette, France,3Universite´ Paris XI, 91405 Orsay, France, and4Colle`ge de France,
75231 Paris, France
Humans can understand spoken or written sentences presented at extremely fast rates of⬃400 wpm, far exceeding the normal speech rate (⬃150 wpm). How does the brain cope with speeded language? And what processing bottlenecks eventually make language incom-prehensible above a certain presentation rate? We used time-resolved fMRI to probe the brain responses to spoken and written sentences presented at five compression rates, ranging from intelligible (60 –100% of the natural duration) to challenging (40%) and unintelligible (20%). The results show that cortical areas differ sharply in their activation speed and amplitude. In modality-specific sensory areas, activation varies linearly with stimulus duration. However, a large modality-independent left-hemispheric language network, including the inferior frontal gyrus (pars orbitalis and triangularis) and the superior temporal sulcus, shows a remarkably time-invariant response, followed by a sudden collapse for unintelligible stimuli. Finally, linear and nonlinear responses, reflecting a greater effort as compression increases, are seen at various prefrontal and parietal sites. We show that these profiles fit with a simple model according to which the higher stages of language processing operate at a fixed speed and thus impose a temporal bottleneck on sentence comprehension. At presentation rates faster than this internal processing speed, incoming words must be buffered, and intelligibility vanishes when buffer storage and retrieval operations are saturated. Based on their temporal and amplitude profiles, buffer regions can be identified with the left inferior frontal/anterior insula, precentral cortex, and mesial frontal cortex.
Introduction
We typically speak at a rate of ⬃130–190 words per minute (wpm) (Reynolds and Givens, 2001). However, surprisingly, the language comprehension system can sustain much faster presen-tation rates. Using digital compression, speech can be accelerated up to⬃40% of its original duration and remain largely compre-hensible (Chodorow, 1979; Mehler et al., 1993; Dupoux and Green, 1997; Pallier et al., 1998; Sebastian-Galles et al., 2000). Furthermore, during reading, expert readers typically attain 250 – 300 wpm, and reading speed can be doubled or tripled by remov-ing the need for eye movements (Rubin and Turano, 1992).
Here, we use functional magnetic resonance imaging (fMRI) to investigate how the language system copes with fast presenta-tion rates. Although fMRI has a low temporal resolupresenta-tion com-pared with electrophysiological methods, it can detect activation delays and duration changes of⬃200 ms (Menon et al., 1998; Sigman et al., 2007; Sigman and Dehaene, 2008). In response to a single sentence, language areas show a systematic temporal
orga-nization, with increasingly delayed responses as one moves either posterior or anterior to primary auditory cortex, the slowest re-sponse being observed in left inferior frontal gyrus (Dehaene-Lambertz et al., 2006; Brauer et al., 2008; Pallier et al., 2011). This temporal gradient of activation might result from a succession of processes that integrate over increasingly larger, and possibly more abstract, linguistic units, therefore requiring longer pro-cessing time or more sustained activity (see also Hasson et al., 2008; Lerner et al., 2011; Brennan et al., 2012).
Here, we evaluated how this temporal organization varies with presentation rate. Unlike previous fMRI studies of speech compres-sion that used block designs (Poldrack et al., 2001; Peelle et al., 2004, 2010; Adank and Devlin, 2010), we used a slow event-related design to measure the fMRI response to a single sentence, thus allowing us to determine whether cortical processing speed, indexed by the phase of the fMRI response, accelerates when the stimulus is speed-ed; which regions show a sudden collapse of activation in parallel to the sudden loss of intelligibility at fast presentation rates; and how these effects differ for spoken and written language.
Our main goal was to clarify the mechanisms that eventually limit the intelligibility of compressed speech. One possibility is a sensory bottleneck; at high compression rates, incoming visual or auditory information would be degraded beyond recognition due to its short presentation time or to masking by the next stimulus. Another possibility is a saturation of a postperceptual processing stage. The integration of successive words into a sentential struc-ture may create a processing bottleneck, analogous to attentional blink and psychological refractory period phenomena (Pashler, Received Nov. 11, 2011; revised March 20, 2012; accepted April 17, 2012.
Author contributions: L.V., G.D.-L., and S.D. designed research; L.V. and G.D.-L. performed research; L.V., G.D.-L., C.P., and S.D. analyzed data; L.V., G.D.-L., C.P., and S.D. wrote the paper.
This work was supported by the McDonnell Foundation, Agence Nationale de la Recherche (France), and Ecole des Neurosciences de Paris-Neuropole de Recherche Francilien.
The authors declare no competing financial interests.
Correspondence should be addressed to Ghislaine Dehaene-Lambertz, INSERM U992, CEA/SAC/DSV/DRM/Neu-roSpin, Baˆt 145, Point Courrier 156, 91191 Gif-sur-Yvette, France. E-mail: [email protected].
DOI:10.1523/JNEUROSCI.5685-11.2012
1984; Raymond et al., 1992; Sigman and Dehaene, 2008), thus delaying the processing of subsequent incoming words and re-quiring their temporary storage in a buffer. The collapse of intel-ligibility at fast rates would be due to the saturation of this buffer. Within this framework, the responses of different brain areas to speeded stimuli could provide insight into the brain architecture for language processing.
Materials and Methods
ParticipantsParticipants were 16 young native French speakers (14 males; mean age, 22 years; SD, 2.6 years) with no history of oral or written language im-pairment, neurological disease, or psychiatric disease. All were right-handed and had normal or corrected-to-normal vision and no hearing deficits. All participants gave their written informed consent, and the study was approved by the local ethics committee.
Stimuli
A set of 264 sentences was constructed using the following criteria: each sentence was plausible, nonambiguous, and right branching; each con-sisted of 12 words and of 16 or 17 syllables. The number of letters per word varied from 1 to 13 (mean, 4.4 letters; SD, 2.2 letters; third quartile, 6 letters).
The sentences were digitally recorded at 22.05 kHz in a quiet room by a female speaker trained to produce the sentences at a constant speed while keeping a natural intonation. Sentences had a mean total duration of 2.8 s (SD, 0.14 s), corresponding to 5.9 syllables/s or⬃256 wpm—a fast but easily intelligible rate. The sentences were then compressed to 20, 40, 60, or 80% of their original duration using the PSOLA algorithm implemented in the Praat software (www.praat.org). As a partial control for the effects of digital compression, we also recorded the same sen-tences at a higher speed of pronunciation (mean duration, 2.06 s; SD, 0.12 s; 8 syllables/s or 291 wpm). These faster sentences were then com-pressed to 54% of their original duration, yielding a second set of stimuli with the same duration as the natural sentences compressed at 40% (duration, 1.12 s). We reasoned that if the compression algorithm was efficient at simulating natural increases in elocution rate, then perfor-mance should only be determined by final stimulus duration rather than by the original recording speed or by the compression rate. This claim can be assessed by comparing the behavioral and fMRI results for these two sets of recordings (natural elocution speed compressed to 40% vs speeded elocution compressed to 54%, respectively, labeled 40%N and 40%S).
The audio stimuli were delivered through MRI-compatible head-phones (MR confon), and the volume was adjusted for each participant to a comfortable hearing level. Visual stimuli were viewed through a mirror and were projected one word at a time in rapid serial visual presentation (RSVP) at the center of a translucent screen using a 60 Hz video projector. The duration of presentation of written sentences was set to match that of the spoken sentences. Thus, the target duration of each written word was, respectively, 46, 93, 140, 186, 233 ms, corresponding to average sentence durations of 0.56, 1.12, 1.68, 2.24, and 2.80 s for the five compression rates.
RSVP was adopted here because of the strict control that it allows on sentence presentation duration. It should be noted, however, that RSVP only partially mimics the processes at work in normal reading because progressive and regressive eye movements are prevented, short gram-matical words cannot be skipped, etc (for discussion, see Just et al., 1982). However, note that these caveats do not apply to the auditory compressed-speech condition, and we primarily focused here on the parallels between the auditory and visual modalities.
The stimuli were displayed using custom software written in Python, which adjusted each individual word presentation duration to the near-est integer multiple of the refresh cycle of the projector (16.7 ms) to ensure an accurate total sentence duration. Words were presented in lowercase Arial font (white characters on a black background) and sub-tended 0.62° of visual angle vertically and 0.35°– 4.84° horizontally (mean, 1.65°). The screen was empty during the intersentence interval.
Procedure
Each participant was scanned in four fMRI runs, two with spoken sen-tences and two with written sensen-tences. The order was interleaved and alternated between participants. A randomly chosen sentence was pre-sented every 12 s in a slow event-related design. None of the sentences were repeated within a given subject. Because adaptation to compressed sentences is an essential parameter affecting their intelligibility (Dupoux and Green, 1997), sentences were presented in miniblocks of 12 sen-tences, each with the same fixed compression factor. Compression fac-tors were randomly ordered within each session. The first two sentences of each miniblock were considered as an adaptation period and were therefore modeled as a separate condition in Statistical Parametric Map-ping (SPM) software (Wellcome Department of Cognitive Neurology, London, UK) analyses, whose results are not presented here.
Each visual run consisted of five miniblocks, one for each compression factor (20, 40, 60, 80, 100%). For the auditory sessions, there was one additional miniblock, corresponding to the speeded recording (20, 40N, 40S, 60, 80, 100%). Each participant was exposed to a total of 264 differ-ent sdiffer-entences (120 in the visual modality and 144 in the auditory modality).
Our general aim was to study the activation of language networks in the course of normal sentence comprehension while minimizing the contribution of working memory, error detection, repair, and other metacognitive processes (for a similar approach, see Tyler and Marslen-Wilson, 2008; Pallier et al., 2011). Therefore, participants were merely asked to attend to the meaning of each sentence and, once it ended, to rate its intelligibility on a scale from 1 (the sentence was not understood at all) to 4 (the sentence was perfectly understood). Participants were instructed to respond after the end of each sentence using a four-key response box. All participants answered with their right hand. For half the participants, the index finger corresponded to 1 and the small finger to 4. This assignment was reversed for the other half of the participants. Participants were instructed to focus on the accuracy of their judgment rather than speed.
Before entering the scanner, the participants were familiarized with the task using a training set of 30 stimuli (three sentences at each com-pression factor in each modality). Training sentences were drawn from a set of 66 sentences that were not presented during scanning.
Image acquisition and analysis
Functional images were acquired on a 3 T MR scanner (Tim Trio; Sie-mens) as T2*-weighted echoplanar images (TR⫽ 1.6 s, TE ⫽ 30 ms, matrix⫽ 64 ⫻ 64, FOV ⫽ 256 mm, voxel size ⫽ 4 ⫻ 4 ⫻ 4 mm, number of slices⫽ 30, mode GRAPPA with an accelerator factor of 2). For the anatomical images, a 3-D gradient-echo sequence (TI⫽ 900 ms, TE ⫽ 2.98 ms, TR⫽ 2.3 s, voxel size ⫽ 1 ⫻ 1 ⫻ 1.1 mm, FOV ⫽ 256 mm) was used. Data were processed with SPM5 (http://www.fil.ion.ucl.ac.uk/ spm/software/spm5). Functional images were realigned to the first image in the series and coregistered to the individual anatomy. Anatomical images were normalized to the Montreal Neurological Institute space, and the normalization parameters were applied to the functional images, which were finally smoothed with a 5 mm3Gaussian kernel.
Main SPM model: effects of modality and compression. At the
single-subject level, a linear model was generated by entering, for each visual run, 20 regressors corresponding to five compression factors, times two sentence types (initial two training sentences vs next 10 testing sen-tences), times two hemodynamic profiles [standard hemodynamic re-sponse function (HRF) and its temporal derivative] plus six regressors of noninterest corresponding to the movement parameters. Similarly, each auditory run was modeled by 24 regressors because there were six con-ditions of compression plus the movement parameters.
Importantly, event-related responses were modeled by specifying the same duration for all conditions, which was the median of all stimuli (2.81 s), and then convolving with the standard HRF and its derivative. This choice was made so that the different compression rates were mod-eled by the same HRF profiles in SPM, thus allowing meaningful statis-tical comparisons of the weights obtained in the different conditions of sentence compression to be made (for instance, to detect a linear increase in activation with stimulus duration). If we had used a different temporal
profile for each compression rate, such comparisons would be meaning-less. This point is problematic for studies that modeled sentence duration into the stipulated neural profile of activation before convolution with the HRF (Adank and Devlin, 2010); this choice surreptitiously amounts to assuming a linear dependency of brain activity with duration and only allows the experimenters to discover brain areas that deviate from this ideal pattern. Other studies do not describe how they addressed this issue (Peelle et al., 2004, 2010) or introduce confounds in their block design by having more sentences per unit of time in blocks with faster compression rates (Poldrack et al., 2001).
The contrast images from each participant for activation during sen-tence presentation (relative to the implicit intersensen-tence rest period) were then smoothed with an 8 mm Gaussian kernel and entered into a group-level ANOVA model with modality and compression rate as within-subject factors (and one variable of noninterest for each subject). We designed contrasts to maximally separate brain areas with distinct profiles of response to compression. Previous publications (Binder et al., 1994; Dhankhar et al., 1997; Buchel et al., 1998; Poldrack et al., 2001; Peelle et al., 2004) and pilot analyses indicated that distinct fMRI profiles could be identified: a linear activation with sentence duration (increasing or decreasing); a step function, i.e., a constant activation collapsing sud-denly at the shortest duration (similar to behavioral reports of intelligi-bility); and a quadratic function, i.e., showing a peak of activation at intermediate durations. One difficulty is that these profiles are nonor-thogonal (e.g., there are strong correlations between the linear and step functions and between the step and quadratic functions). Thus, we used combinations of these contrasts, plus inclusive or exclusive masking, to parse brain activations in such a manner that each region would appear only in one type of analysis, as follows. (1) Regions showing a linear increase with stimulation duration were identified using a standard lin-ear contrast over the five conditions of compression 20 –100% [⫺2 ⫺1 0 1 2], masked inclusively by a linear contrast over the range 40 –100% [0 ⫺3 ⫺1 1 3]. The latter contrast was needed to ensure linearity over the entire range of compression rates and exclude regions that collapsed only for the most compressed sentences (20% compression). (2) Regions in which activation showed a collapse at 20% compression rate but re-mained approximately constant at longer durations [⫺4 1 1 1 1]. This contrast was exclusively masked by [0 3 1⫺1 ⫺3] and [0 ⫺3 ⫺1 1 3], thus eliminating voxels that showed a significant linear increase or decrease over the range of 40 –100% compression rates. (3) Regions showing a maximum of activity for intermediate durations were identified using a standard inverse quadratic contrast across conditions [⫺2 1 2 1 ⫺2], masked inclusively by [0 3 1⫺1 ⫺3] to exclude regions with the “col-lapse” profile. (4) Finally, regions showing a linear decrease of activity with duration [2 1 0⫺1 ⫺2]. This analysis was confined to regions not showing any quadratic responses (exclusive masking by [⫺2 1 2 1 ⫺2] and by [2⫺1 ⫺2 ⫺1 2]).
Unless otherwise reported, all effects passed a voxelwise threshold of
p⬍ 0.05 corrected using the False Discovery Rate (FDR) method. All
mask constraints were thresholded at voxel p⬍ 0.001, uncorrected. Each contrast was first tested globally across the visual (V) and auditory (A) modalities of sentence presentation (V⫹ A). As a second step, we tested for a significant interaction with modality (V⬎ A or A ⬎ V). In the latter case, the images were masked inclusively by the corresponding contrast within the appropriate modality (V and A, respectively) to ensure that the interaction was indeed due to the appropriate profile of activation within this modality and not to the presence of the opposite profile in the other modality.
We verified that these four profiles of activation, in one modality or in both, accounted for virtually all the task-related regions (i.e., 95.70% of the voxels identified by an overall F test testing for any effect of the compression factor, in either modality, with a threshold of p⬍ 0.001 uncorrected, were present in one of the above contrasts).
To ensure that SPM contrasts were identical across the visual and auditory modalities, the 40%S condition, which was unique to the audi-tory modality, was not included in these contrasts. However, its results were included as a separate condition in the data plots presented as figures. SPM contrasts verified that there was no significant difference between the conditions 40%N and 40%S.
Plots of the time course of the BOLD signal were generated using the MarsBaR toolbox (http://marsbar.sourceforge.net/), which aver-ages the amplitudes across all the voxels in a given region of interest (ROI) and experimental condition. ROIs were defined here as spheres of 10 mm radius centered on the peaks identified by the main SPM analysis (Table 1).
Effect of intelligibility. A distinct general linear model was used to study
the cerebral correlates of fluctuations in sentence intelligibility at a fixed compression level. This analysis was restricted to the 40% compression conditions, where intelligibility was most variable. The above first-level individual-subject model was modified by adding the self-reported intel-ligibility of each sentence as a modulator of BOLD activation, separately for the visual 40% and auditory 40%N and 40%S conditions. Then, a second-level group SPM model was formed with a contrast pooling across these three regressors and, thus, testing for an overall effect of intelligibility across the two modalities.
Phase analysis. To estimate the phase of the event-related BOLD
re-sponse, an additional first-level model was created using Fourier (sine/ cosine) basis functions rather than the standard HRF. This amounts to convolving the indicator variables of each condition of interest (20 or 24 variables for the visual and auditory modalities respectively), with a sin-gle cycle of a sine and a cosine waveform with a period equal to the stimulus onset asynchrony (12 s). As in previous models, the six move-ment variables of noninterest were also included in the design matrix. After estimation of this model within each subject, the mean weights of the sines and cosines for a given condition were extracted within spher-ical ROIs using MarsBar, as described above. To compute the phase within an ROI, the ratio of these mean regression weights was then trans-formed with the inverse tangent function to yield a phase between 0 and 2. Plots of the average phase across participants were generated using circular mean and SE functions. Phases were multiplied by the stimula-tion period (12 s) and divided by 2 to yield a phase lag of the BOLD response, expressed in seconds. ANOVAs were used to probe the exis-tence of significant phase differences between regions and conditions. This statistical approach can only be considered approximate, as the phases are distributed on a circular scale (0 –12 s) rather than a linear scale appropriate for t and F statistics. However, this approximation is appropriate here because we only analyzed regions that showed a classical fMRI activation profile and therefore whose response phase was predom-inantly distributed in a narrow time window surrounding the classical HRF latency of 3– 8 s. Thus, the circularity of the phase space did not contaminate our statistics. As a complementary nonparametric ap-proach, we also tested the presence of a significant increase in fMRI phase with sentence duration using a permutation test. On 1000 runs, the con-dition labels were randomly permuted within each subject, and the cir-cular group means by condition were recomputed, thus yielding a new slope relating observed phase to sentence duration. The proportion of permuted datasets in which the slope was larger than the one observed in the actual data is the p value for the permutation test.
Results
BehaviorAs shown in Figure 1, intelligibility varied with the speed of sen-tence presentation, which ranged from the natural speech rate (conventionally referred to as a compression factor of 100%, cor-responding to 233 ms/word) to compressed sentences (80, 60, 40, or 20 of the original duration; respectively 186, 140, 93, 46 ms/ word). Intelligibility ratings were maximal for the normal sen-tences, showed little or no decrease as the compression factor went from 100 to 60%, and then dropped quite suddenly to the minimum level for the fastest sentences. These observations were confirmed by a two-factor, repeated-measures ANOVA on the mean intelligibility, with modality and compression factor as within-subject variables. A significant main effect was found for the compression ratio (F(4,60)⫽ 404; p ⬍ 10⫺15). The main effect
of modality was not significant (F(1,15) ⫽ 1.9; p ⬍ 0.2), but a
(F(4,60)⫽ 8.2; p ⬍ 10⫺4) reflected the fact
that comprehension collapsed more con-tinuously for visual than for auditory sentences (Fig. 1). Indeed, comparisons between modalities at each compression level showed that intelligibility in the vi-sual modality already decreased at 80% compression, while intelligibility in the auditory domain was still preserved (t(15)⫽ 3.32; p ⫽ 0.004). This difference
between modalities was even more pro-nounced at 60% compression (t(15) ⫽
4.19; p⫽ 8.10⫺4).
A similar ANOVA on reaction times (RTs), measured from sentence ending, showed that participants were faster for auditory sentences than for visual ones (F(1,15)⫽ 5.42; p ⬍ 0.04) and that the RT
depended on the compression ratio (F(4,60)⫽ 29.15; p⬍10⫺12), with no
signif-icant interaction between the two factors (F(4,60)⫽ 2.06; p ⫽ 0.1). The main effect of
compression ratio was due to a slowing down for the 40% condition, where par-ticipants were significantly slower than in the other conditions (t(15)⫽ ⫺9.73; p ⬍
8.10⫺11).
No behavioral difference was noted between the two auditory conditions 40%N and 40%S (t(15)⬍ 1 for intelligibility and
reac-tion time). The fact that these two condireac-tions had the same final
duration and differed only in their relative proportions of digital compression versus initial natural speech rate suggests that the computer algorithm for speech compression was efficient at sim-ulating natural changes in elocution rate and extending them to
Figure 1. Behavioral results during fMRI acquisition. Intelligibility score (left axis and solid line) and reaction time measured from the end of the sentence (right axis and dotted line) are plotted as a function of the compression factor (for convenience, this value is also converted to mean word duration and word rate). Intelligibility was subjectively rated using a four-button press, specified as follows: 1, nothing understood; 2, weakly understood; 3, mostly understood; 4, completely understood. Each point was averaged over 20 items per conditions and per subject (bars indicate 1 SE). Red, Auditory modality; Green, visual modality. Table 1. Coordinates of significant activation peaks for the three contrasts
Brain area
Auditory Visual Main effect Interactions
MNI coordinates
Cluster size z Score
MNI coordinates
Cluster size z Score
MNI coordinates
z Score
(A⫹ V)
z Score
x y z x y z x y z A-V V⫺ A
(A) Linear with duration
L Heschl’s gyrus ⫺48 ⫺20 4 195 ⬎8* — — — — — ⫺52 ⫺24 4 10.4* ⬎8* — R Heschl’s gyrus 56 ⫺16 4 299 ⬎8* — — — — — 56 ⫺16 4 10.8* ⬎8* — L inferior occipital gyrus — — — — — ⫺24 ⫺96 ⫺8 42 ⬎8* ⫺24 ⫺96 ⫺8 6.20* — 7.38* R inferior occipital gyrus — — — — — 24 ⫺96 ⫺8 84 10.5* 24 ⫺96 ⫺8 5.29* — 6.19* (B) Collapse for shortest
L aSTS ⫺52 ⫺8 ⫺8 482 ⬎8* ⫺56 ⫺4 ⫺16 85 5.49* ⫺52 ⫺8 ⫺12 ⬎8* — — L pSTS ⫺48 ⫺36 4 405 7.69* ⫺48 ⫺48 12 139 6.41* ⫺48 ⫺48 12 ⬎8* — — L mSTS ⫺64 ⫺24 0 405 7.72* — — — — — ⫺64 ⫺24 ⫺4 ⬎8* 3.22 — R aSTS 48 ⫺20 ⫺4 275 7.74* 56 0 ⫺16 12 3.76 56 0 ⫺12 ⬎8* 4.34 — L inferior ⫺52 32 ⫺4 73 5.23 — — — — — ⫺52 32 0 5.60* — — frontal gyrus ⫺48 16 24 73 4.36 ⫺44 12 24 33 4.28 ⫺44 16 24 5.73* — — ⫺32 32 ⫺12 13 4.18 — — — — — ⫺36 32 ⫺12 4.45 — — Medial frontal 0 56 ⫺12 19 3.90 — — — — — 0 56 ⫺12 4.50 — — L precentral — — — — — ⫺44 0 52 53 5.23 ⫺48 0 52 4.74 — —
L inferior occipital gyrus — — — — — ⫺28 ⫺92 0 151 5.36* ⫺28 ⫺92 0 4.04 — 4.18 R occipito-temporal gyrus — — — — — 44 ⫺68 ⫺4 104 5.07* — — — — — —
R mid occipital gyrus — — — — — 40 ⫺92 0 104 4.71 — — — — — —
L pre-SMA — — — — — ⫺4 8 60 19 4.50 ⫺8 8 56 4.77 — —
(C) Maximum for intermediate
L pre-SMA/ACC ⫺4 20 52 19 3.97 ⫺4 20 48 163 5.28* ⫺4 20 52 6.26* — — L anterior insula ⫺28 28 4 17 4.26 ⫺32 24 0 91 5.22* ⫺32 24 4 5.94* — — R anterior insula 28 28 0 14 4.21 32 24 0 80 5.35* 28 24 0 6.27* — —
L precentral — — — — — ⫺24 0 52 24 3.75 ⫺24 ⫺8 56 3.89* — —
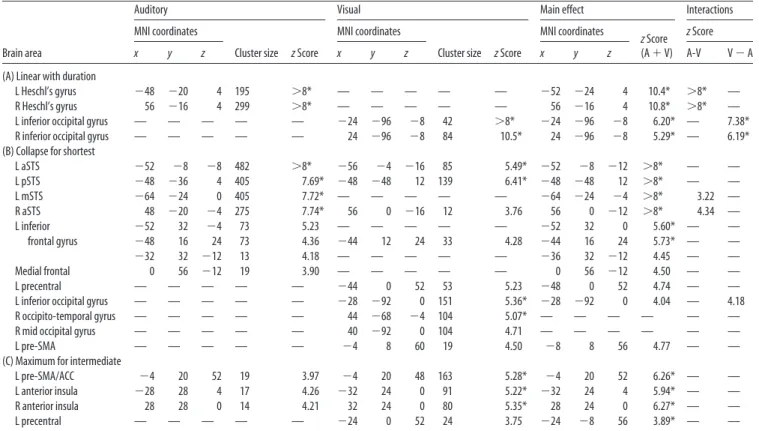
The three contrasts are as follows: A, Sensory profile: regions showing a linear increase in activation with stimulus duration (contrast关⫺2 ⫺1 0 1 2兴 across the five compression factors, masked inclusively by 关0 ⫺3 ⫺1 1 3兴; see Materials and Methods). B, Post-bottleneck profile: regions showing a sudden collapse in activation at the shortest duration (contrast关⫺4 1 1 1 1兴, masked exclusively with the two contrasts 关0 3 1 ⫺1 ⫺3兴 and 关0 ⫺3 ⫺1 1 3兴). C, Buffer profile: regions showing an inverse quadratic response as a function of stimulus duration (contrast关⫺2 1 2 1 ⫺2兴 masked inclusively by 关0 3 1 ⫺1 ⫺3兴). Left and middle columns report separate tests for the auditory and the visual conditions, respectively, while the “main effect” column collapses across these two conditions. Finally, the “interactions” column reports the z score at the peak of the main effect, of the interaction of each of the above contrasts with modality, evaluated as the difference of the auditory and visual contrasts (Table 2 provides a full report of significant peaks for these interaction terms). The threshold was voxelwise p⬍0.05,FDRcorrected,andonlyclusterswithmorethan10voxelsarereported. Asterisks indicate clusters that also reached significance by cluster size ( p⬍ 0.05, corrected across the whole brain volume). The voxel size was 4 * 4 * 4 mm. mSTS, Middle superior temporal sulcus.
compression factors beyond those producible by a natural speaker.
fMRI amplitude variations with stimulus duration
fMRI activation increasing linearly with stimulus duration
We first searched the whole brain for regions whose activation increased linearly with stimulus duration, separately within each modality. As shown in Figure 2 (first row), this contrast identified bilateral regions centered on the sensory cortices: the bilateral Heschl’s gyri and neighboring sectors of the superior temporal gyrus for the auditory modality and two bilateral clusters extend-ing from the occipital pole to lateral ventral temporal areas for the visual modality. In these regions, the responses were strictly uni-modal, as attested by significant interactions between modality and duration (Table 1, Fig. 2). Plots of the hemodynamic re-sponses in Heschl’s gyrus and in left occipital cortex are presented in Figure 3. These plots clearly show that the amplitude and
du-ration of the BOLD response were proportional to stimulus duration.
Regions with a collapse at the shortest duration of presentation
The above linear profile of BOLD variation with sentence dura-tion was observed only in early sensory regions. In higher-order language areas, indeed, previous publications (Davis and John-srude, 2003; Friederici et al., 2010; Okada et al., 2010) led us to expect the fMRI signal to reflect the intelligibility associated with each compression condition rather than the physical compres-sion rate itself. Indeed, many regions showed a nonlinear profile of activation with duration (Fig. 2, second row), showing virtu-ally no variation as the sentences were compressed from 100% down to 40% (generally intelligible), and then a sudden collapse for the 20% condition (unintelligible). To identify all regions showing such a nonlinear collapse profile, we searched for voxels simultaneously passing a contrast indicating a nonlinear, steplike
Figure 2. Classification of regions exhibiting a significant modulation of activation amplitude with compression rate ( p⬍ 0.001). Blue, Main effect across both written and spoken sentences. Green and red, Interaction terms indicating a significantly greater effect for written sentences (green) or for spoken sentences (red). First row, Lateral and posterior maps showing areas with a linear increase of activation as a function of the five compression factors (20, 40, 60, 80, or 100% of natural speech rate: linear contrast [⫺2 ⫺1 0 1 2] inclusively masked by [0 ⫺3 ⫺1 1 3]). Second row, Lateral and medial maps showing areas with a collapse of activation at the shortest stimulus duration (nonlinear contrast [⫺4 1 1 1 1] exclusively masked by [0 3 1 ⫺1 ⫺3] and [0 ⫺3 ⫺1 1 3]). Third row, Lateral and medial maps showing areas with a maximum of activation for intermediate compression factors (quadratic contrast [⫺2 1 2 1 ⫺2] inclusively masked by [0 3 1 ⫺1 ⫺3]). Fourth row, Lateral and medial maps showing areas with a linear increase in activation as the compression factor gets shorter (linear contrast [2 1 0⫺1 ⫺2] exclusively masked by [⫺2 1 2 1 ⫺2] and by [2⫺1 ⫺2 ⫺1 2]).
profile of activation with duration and showing no significant linear variation in the range 40 –100% (see Materials and Meth-ods). Importantly, in most brain regions, these stringent condi-tions were frequently met simultaneously in both the auditory and the visual modalities (Fig. 2, blue regions). The amodal re-gions showing such a collapse effect included a large and bilateral extent of the superior temporal gyrus, extending toward the su-perior temporal sulcus and the middle temporal gyrus, and a left-hemispheric set of frontal regions including the inferior fron-tal gyrus and the precentral gyrus. The temporal response profile of these regions is plotted at the bottom of Figure 4. A nonlinear response can be seen most clearly in the posterior superior tem-poral sulcus (pSTS); the entire profile of the BOLD response remains identical as the sentence presentation is accelerated by a factor of 2.5 (from 100 to 40%). Such an invariant profile is remarkable given that, in sensory areas, we could easily identify changes in activation across these compression rates (Fig. 3).
Although the activation patterns for the nonlinear collapse contrast mostly overlapped across the auditory and visual modal-ities (Table 1), the interaction of this contrast with modality iso-lated two significant clusters described in Table 2. First, a nonlinear collapse unique to the visual modality was seen in the occipito-temporal cortex bilaterally, peaking in the left hemi-sphere at [⫺40 ⫺72 0], and extending anteriorly to include the classical coordinates of the visual word form area (VWFA) ([⫺44
⫺54 ⫺12]) (Cohen et al., 2000; Jobard et al., 2003; Cohen and Dehaene, 2004). Second, conversely, a nonlinear collapse unique to the auditory modality was found bilaterally within the superior temporal gyrus anterior to Heschl’s gyrus, as well as the anterior STS (aSTS), including the coordinates of a putative homolog of the VWFA for the auditory modality [⫺60 ⫺8 ⫺4] (Cohen et al., 2004), an auditory region normalizing across voices and thus invariant to the surface form of speech stimuli (Dehaene-Lambertz et al., 2006). The time course of the BOLD response for these regions, shown in Figure 3 (center plots), appears as inter-mediate between that of purely sensory and purely collapsing regions; there is a small but nonsignificant difference between the compression factors 40 –100% and a sudden though moderate drop of activation for the 20% condition.
Regions with maximal activation at intermediate durations
The third response profile that we searched for corresponded to regions with a peak activation at intermediate levels of compres-sion. Such a profile might reflect the greater effort associated with understanding of moderately compressed sentences, as reflected behaviorally in slower response times to the intermediate levels of the compression factor (Fig. 1). The corresponding inverse qua-dratic contrast (see Materials and Methods), when pooling across the visual and auditory modalities, identified the anterior insula bilaterally, the bilateral supplemental motor area (SMA),
extend-Figure 3. Time course of fMRI responses in modality-specific areas showing an increase of activation as a function of stimulus duration. Each ROI was defined as a sphere of 10 mm radius centered on the peak of the main effect reported in Table 1. Each panel shows the responses to written sentences (top, green V) and to spoken sentences (top, red A). Curve color indicates compression rate, with the warmest colors representing the slowest rates of sentence presentation (up to 100% compression factor⫽ natural speech rate) and the coldest colors the fastest rates (down to 20% of original stimuli). For the auditory modality, the data are plotted separately for the two conditions at 40% compression factor (dark green, 40%N; light green, 40%S; see Materials and Methods). Sensory areas in occipital and Heschl’s gyrus present a purely linear effect of duration. Left fusiform and aSTS regions, although presenting a superficially similar time course, exhibit a significant nonlinear component (interaction of modality with the nonlinear contrast [⫺4 1 1 1 1] exclusively masked by [0 3 1 ⫺1 ⫺3] and [0 ⫺3 ⫺1 1 3]; see Table 2).
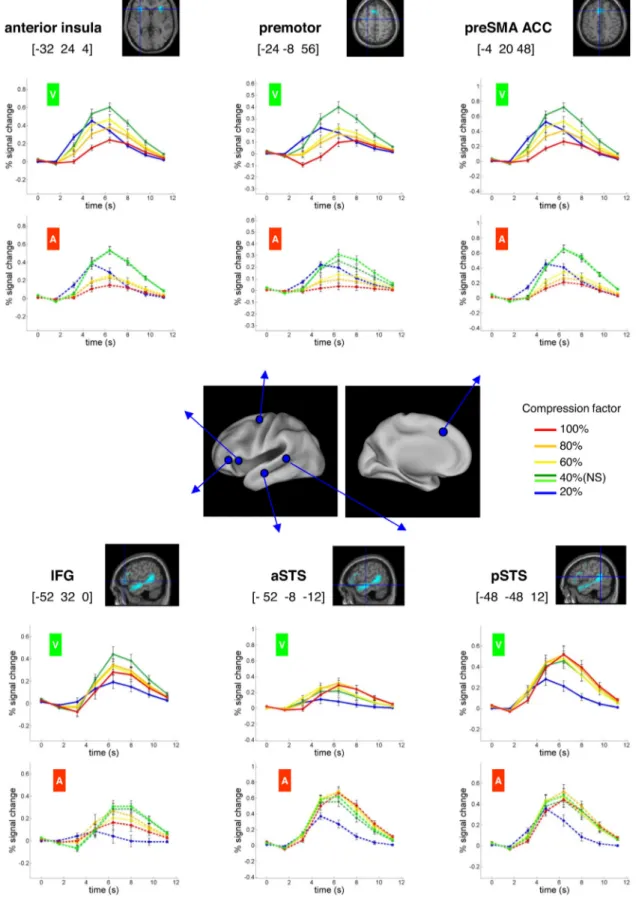
Figure 4. Time course of fMRI responses in regions exhibiting a nonlinear profile of activation as function of stimulus duration. Top, Regions showing a maximum of activation for intermediate compression factors (contrast [⫺2 1 2 1 ⫺2] inclusively masked by [0 3 1 ⫺1 ⫺3]). Bottom, Regions exhibiting a collapse of activation at the fastest compression rate (20%) and a constant activation across all other compression factors (contrast [⫺4 1 1 1 1] exclusively masked with the two following contrasts [0 3 1 ⫺1 ⫺3] and [0 ⫺3 ⫺1 1 3]). Note that all these regions showed amodal profiles of activations similar in auditory (red A) and visual (green V) modalities.
ing into the anterior cingulate cortex (ACC), and a region of left premotor cortex. There was also a very small cluster (seven vox-els) in the left inferior frontal gyrus (Fig. 2, third row). None of these regions were detected when an interaction with modality was computed, suggesting that this network is largely amodal. This conclusion was confirmed by analyses restricted to each modality (Table 1); most peaks were identified by the same in-verse quadratic contrast within each modality, with the excep-tions of the left premotor cortex, which attained significance only in the visual modality, and the left inferior frontal gyrus, in which the small cluster (six voxels) was observed only in the auditory modality.
The time course of the fMRI responses in representative ROIs is shown at the top of Figure 4. The largest responses were ob-served for the 40% compression condition, in both visual and auditory modalities (green curves). Above this compression rate (60 –100%), the amplitude of the BOLD response decreased pro-gressively (note that this pattern is opposite that observed in sen-sory areas) (Fig. 3). The response also became increasingly slower and flatter. Conversely, at the fastest compression factor (20%), which was not intelligible, only an early, brief, yet quite intense BOLD response was observed.
Regions whose activation decreased with increasing stimulus duration
A fourth response profile, i.e., a linear decrease as stimulus dura-tion increased, accounted for the remaining brain regions (those achieving significance in an overall F test for presentation rate; see Materials and Methods). This linearly decreasing contrast was significant across both auditory and visual modalities in a broad set of regions (Fig. 2, bottom row). Highly significant decreases were seen in the bilateral anterior prefrontal regions ([⫺28 48 12], [28 56 12]) and midline anterior cingulate ([⫺4 28 36]), where activation was primarily seen during the 20% and 40% compression factors and became nonsignificant for slower pre-sentation rates. These activations might therefore correspond to a brain network for sustained effort related to the greater difficulty and task engagement needed at high sentence presentation rates. A similar pattern, though with a more continuous decrease in activation with stimulus duration, was seen in the SMA [⫺4 ⫺8 52], bilateral inferior parietal cortex ([⫺40 ⫺48 44], [48 ⫺44
48]), and insula ([⫺40 0 8], [40 4 8]). Finally, a special case was the left motor/post-central cortex, whether the temporal profile of activation disclosed an increasingly delayed response with lon-ger stimulus duration, as would be expected from the fact that subjects responded with their right hand at the end of each sentence.
All the above regions reached significance in both the auditory and the visual modalities. In addition, we observed a significant interaction with modality, indicating a decreasing BOLD effect restricted to the visual modality, in bilateral mesial occipital (cu-neus) ([⫺12 ⫺76 32], [16 ⫺68 28]), bilateral lingual gyrus ([⫺8 ⫺80 ⫺4], [8 ⫺80 0]), and bilateral Heschl’s gyrus, with a stronger effect on the left [⫺44 ⫺12 8] than on the right [44 ⫺8 8]. Plots (Fig. 3, see examples) showed that all these sites exhibited a deac-tivation evoked by the visual sentence, whose depth and duration were proportional to sentence duration. These findings may therefore correspond to an active inhibition of regions not needed for the foveal reading task, both in primary auditory cortex and in visual cortex responsive to the periphery of the visual field (Corbetta and Shul-man, 2002; Hasson et al., 2002). In the converse direction, no region showed a greater decrease in activation in the auditory modality com-pared with the visual modality.
Activations linked to intelligibility
At the 40% compression rate, self-reported intelligibility was highly variable from trial to trial. To explore the cerebral corre-lates of intelligibility, we searched for areas in which the BOLD signal was linearly correlated with intelligibility ratings within the 40% conditions (pooling across both modalities; see Materials and Methods). At the FDR corrected-level threshold of p⬍ 0.05, no significant activation was detected. However, at an uncor-rected voxel-based threshold of p⬍ 0.001 (and cluster size ⬎10 voxels), a set of areas restricted to the left hemisphere was found, overlapping with the classical perisylvian areas known to be in-volved in sentence comprehension (Fig. 5): aSTS ([⫺48 ⫺8 ⫺16], z ⫽ 4.12, 37 voxels), pSTS ([⫺48 ⫺40 0], z ⫽ 3.85, 53 voxels), temporal pole ([⫺44 8 ⫺32], z ⫽ 3.45, 13 voxels). An-other cluster of 29 voxels was found in the parietal lobe, including the supramarginal gyrus and the angular gyrus ([⫺60 ⫺60 24],
z⫽ 3.71 and [⫺48 ⫺48 28], z ⫽ 3.66). Finally, two clusters were
Table 2. Coordinates of the significant activation peaks for the interactions of modality with each of the three contrasts described in Table 1
Brain area
A-V (mask A) V-A (mask V)
MNI coordinates
Cluster size z Score
MNI coordinates
Cluster size z Score
x y z x y Z
(A) Linear with duration
L Heschl’s gyrus ⫺44 ⫺20 4 267 ⬎8* — — — — —
R Heschl’s gyrus 52 ⫺16 8 400 ⬎8* — — — — —
R inferior occipital gyrus — — — — — 24 ⫺92 ⫺8 119 7.38*
L inferior occipital gyrus — — — — — ⫺24 ⫺96 ⫺12 99 6.68*
L occipito-temporal sulcus — — — — — ⫺40 ⫺68 ⫺8 99 3.86*
R occipito-temporal sulcus — — — — — 48 ⫺68 ⫺4 28 4.47*
(B) Collapse for shortest
L aSTS ⫺60 ⫺8 ⫺4 87 4.95* — — — — —
L Insula ⫺40 ⫺16 12 87 4.65* — — — — —
R mSTS 52 ⫺24 ⫺4 33 4.66 — — — — —
R aSTS 60 8 ⫺8 21 4.24 — — — — —
L mid occipital gyrus — — — — — ⫺40 ⫺72 0 71 3.98*
L inferior occipital gyrus — — — — — ⫺32 ⫺80 ⫺8 71 3.65*
R inferior occipital gyrus — — — — — 32 ⫺80 ⫺8 19 3.66
(C) Maximum for intermediate — — — — — — — — — —
observed in the frontal lobe, in the pars orbitalis ([⫺44 40 ⫺16],
z⫽ 3.68, 14 voxels), and in the superior medial frontal cortex
([⫺16 16 48], z ⫽ 4.08, 17 voxels). There was no activation in the right hemisphere, even at a more lenient threshold of p⬍ 0.01 voxel based.
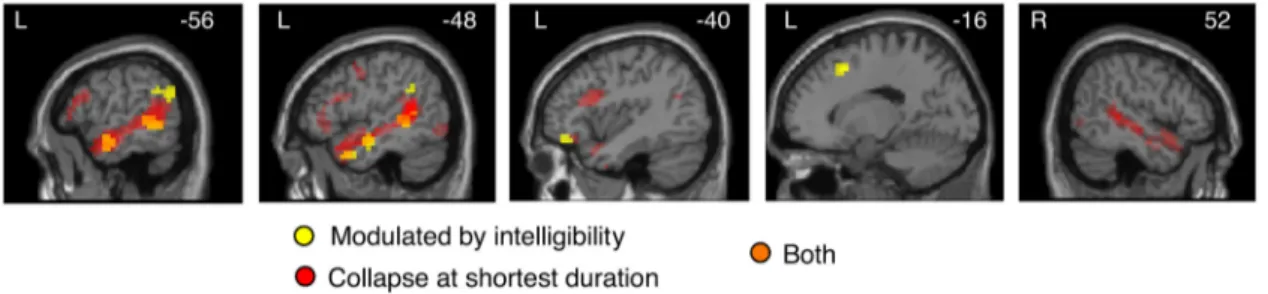
As shown in Figure 5, most of the above areas modulated by intelligibility overlapped with those showing a collapse at the shortest duration of sentence presentation. Thus, these two
inde-pendent criteria converge to suggest that activation in left superior temporal and inferior frontal regions drops to a near-zero level when sentences cease to be in-telligible, in agreement with previous findings (Davis and Johnsrude, 2003; Friederici et al., 2010; Okada et al., 2010). An exception was the temporal parietal junction, which was modulated by intelli-gibility but did not show a collapse at short sentence duration. Instead, this re-gion showed an overall deactivation dur-ing sentence processdur-ing, which tended to be larger for longer sentence duration.
Proposed model
Our finding of an invariant brain activa-tion in major high-level perisylvian lan-guage regions (Fig. 4, bottom), in spite of a near doubling of sentence presentation speed (from 100 to 60% of original dura-tion) is a salient observation that suggests that the cortical processing speed of sen-tences is tightly constrained and cannot be easily accelerated. We now flesh out a de-tailed theoretical interpretation based on this insight. We show that the simple hy-pothesis of a temporal bottleneck can ac-count for the existence of three distinct types of brain regions, each with a distinct temporal profile of activation as a func-tion of compression rate and input mo-dality, and leads to verifiable predictions concerning the phase of their BOLD response.
The main premise of our model is that the higher-level processes of language comprehension, where words are inte-grated into syntactic and semantic con-stituents, are relatively slow, cannot easily accelerate their processing speed, and therefore impose a processing bottleneck. When words are presented at a slow enough pace, equal to or slower than this internal processing speed, each word can be processed immediately and language comprehension proceeds at a speed limited only by the sensory stream. However, when words are presented at a faster speed, exceeding the internal processing speed, some words cannot be processed immediately. Our model assumes that they have to be temporarily stored in a buffer from
Figure 5. Regions modulated by subjective intelligibility. Yellow, Regions in which activation amplitude was significantly correlated with subjective ratings of intelligibility for sentences presented at 40% compression rate (where intelligibility varied the most across trials). In the STS, most of these regions overlapped with regions showing a nonlinear activation across compression factors (red voxel). The intersection of the two contrasts appears in orange.
time
the girl sleeps quietly
Selective retrieval
Sensory input: successive words
Sentence integration Decaying buffer w1 w2 w3
…
…
girl the sleepsA
Slow presentation timethe on the next
Selective retrieval
Sensory input: successive words
Sentence integration Decaying buffer w1 w2girl w3
…
the sleepsB
Fast presentationgirl sleeps quietly red sofa to…
Figure 6. Schematic model of a temporal bottleneck during sentence integration. The model assumes that the integration of successive words into a unified syntactic and semantic structure proceeds at a relatively fixed pace (gray boxes within each panel). Incoming words have to be temporarily stored in a buffer, here assumed to decay exponentially, before being transmitted to the sentence integration stage. A, When words are presented at a slow rate, buffer storage and retrieval proceeds without any difficulty as only one word, or just a few, is waiting at any given moment. B, When words are presented at a fast rate, however, they pile up in the buffer, thus complicating their retrieval. Note that the least recent word must be selectively retrieved (“first in, first out” principle). We assume that buffer retrieval collapses totally once the number of buffered words exceeds a certain value.
which they will be later retrieved once the central language comprehension system becomes available. At this point, sentence comprehension speed becomes solely de-termined by the internal processing speed and ceases to accelerate with the pace of the incoming sensory stimuli. This phe-nomenon is analogous to the well studied psychological refractory period (PRP) phenomenon in dual-task processing; in a broad variety of cognitive tasks, when two successive targets, T1 and T2, are pre-sented in close temporal succession, the processing of the second target, T2, has to wait in a buffer until completion of the processing of target T1, resulting in a de-monstrable slowing down of the response time to T2 (Pashler, 1994; Sigman and De-haene, 2008; Zylberberg et al., 2010). Sim-ilarly, here, we argue that when many words are presented in close temporal proximity, the most recent ones may have to wait in a buffer before being integrated at the sentence level.
A major difference between the pres-ent task and the classic PRP phenomenon is that not just two targets, but a total of 12 words, are successively presented. Thus, participants must be able to hold several words in the buffer and to selectively re-trieve them in the appropriate order. Our hypothesis is that buffering and selective retrieval pose increasing difficulties as the number of buffered words increases. Fig-ure 6 illustrates one possible mechanism
that could underlie this increase in difficulty. As in a recent neu-ronal model of the PRP (Zylberberg et al., 2010), our diagram assumes that, in the buffer, the internal representation of words decays exponentially with time. As more and more words are presented at a fast pace, the selection of which word to transmit to sentence integration processes becomes increasingly difficult, both because more and more words are present in the buffer but also because it is the oldest and therefore the least active word that has to be retrieved. The model predicts that sentence processing will ultimately collapse once the input stream becomes so fast as to necessitate an exceedingly large number of words to be stored and retrieved from the buffer. This collapse may be functionally analogous to the “attentional blink,” i.e., the finding that, during the processing of a first target, a second target may be missed and remain subjectively undetected (Raymond et al., 1992; Sergent and Dehaene, 2004).
Just as the complexity and processing time of the first target modulates the attentional blink (Jolicoeur, 1999), our model pre-dicts that, during the comprehension of compressed sentences, the difficulty of the preceding word integration operations should modulate the critical temporal pace at which comprehen-sion collapses. While we used simple right-branching sentences, which remain understandable at a fast rate, the model predicts that more complex sentences, for instance those including object relatives or passives, would impose a slower internal processing time and therefore would require a slower presentation mode (Just et al., 1996b; Stromswold et al., 1996). These temporal dif-ficulties would be compounded in aphasic patients, in whom
delayed grammatical responses have indeed been observed using the fine temporal resolution of event-related potentials (Swaab et al., 1998; ter Keurs et al., 1999, 2002; Wassenaar and Hagoort, 2005). Finally, although Figure 6, for simplicity, depicts a feed-forward model, psycholinguistic research suggests that top-down predictive operations play an essential role in facilitating the in-tegration of novel incoming words (Konieczny, 2000; Altmann and Mirkovic, 2009). Our model therefore predicts that words and structures that are predictable given past inputs should en-cumber the buffer for a shorter duration, leading to a lower com-pression threshold when the words are predictable than when they are not.
In all these respects, our model bears some similarity to Just and Carpenter’s Capacity Theory of Sentence Comprehension (Just and Carpenter, 1992; MacDonald et al., 1992; Just et al., 1996a). This theory postulates that a working memory buffer plays an essential role in maintaining active representations of words during syntactic comprehension and that saturation of its capacity (which may vary across individuals) may cause compre-hension difficulties. Two important differences, however, are that (1) our proposal is not committed to the hypothesis that syntactic comprehension relies on the same working memory buffer as other explicit verbal tasks (Waters and Caplan, 1996) [rather, the buffer may be implemented by local, dedicated, and passively decaying reverberating circuits (Zylberberg et al., 2009)] and (2) while Just and Carpenter (1992) give working memory a decisive role in a variety of linguistic manipulations (e.g., comprehension of passive sentences, maintenance of
mul-Figure 7. fMRI activation patterns predicted by the bottleneck model. A, Schematic depiction of the amount of processing required by a 12-word sentence presented at three different paces (rows: slow, intermediate, fast) at each of the three different stages of the proposed model (columns: sensory, buffer, integration). B, Predicted time course of fMRI responses predicted by computer simulations at each of these stages, as the compression factor is varied from 20 to 100%. The simulated curves can be directly compared with the experimental data in Figures 3 and 4.
tiple ambiguous meanings), we merely propose an input buffer whose sole role is to maintain incoming words until they are integrated at the sentence level. We performed computer simu-lations of our model, using the following minimal assumption: internal processing time⫽ 250 ms/word, buffer limit ⫽ 7 words (the qualitative predictions are independent of these choices). As shown in Figure 7, once convolved with the standard hemody-namic response function, our model reproduces many of the details of the observed fMRI activation profiles. Three types of brain regions are predicted. Sensory regions should show monoton-ically increasing and delayed activations as a function of increasing stimulus duration. Activity in buffer/selection regions should follow an inverted U curve with maximal activity for intermediate dura-tions. Finally, regions involved in sentential integration should show invariant activations up to a certain compression factor and a sud-den collapse when buffer or selection capacity is exceeded. Obvi-ously, the three predicted profiles are similar to those identified in our empirical fMRI measurements.
Phase analysis of fMRI activation
The model makes further predictions concerning the timing of fMRI activations (Figs. 7, 8). For sensory regions before the pos-tulated bottleneck, because activation duration is strictly propor-tional to stimulation duration, the phase of the fMRI response should increase linearly with sentence duration. Furthermore, the slope of that increase, measuring the amount of fMRI activa-tion delay for each second of addiactiva-tional stimulaactiva-tion, should be 0.50, as any change in the duration of neural activation translates into a shift of the peak fMRI response by half this value (Sigman et al., 2007). For buffer/selection regions, our simulations predict a nonlinear profile with fast responses in the 20% condition (buf-fer saturated and nonoperative), and suddenly slower BOLD re-sponses at slower rates, with an increase of phase delay at slower presentation rates (predicted slope⫽ 0.40). Finally, for post-bottleneck sentential integration, we also predict a nonlinear pro-file but, as seen in Figures 7 and 8, now with a constant phase delay (slope⫽ 0) for all intelligible conditions (⬎40% compres-sion rate). Note that this prediction is parameter dependent; it assumes that, for our stimuli, processing time is determined by the internal processing speed rather than the external stimulation
rate. A small increase would be predicted if, at the slowest rate, sentences began to be presented more slowly than the inter-nal integration rate.
One last counterintuitive prediction is noteworthy. The model predicts that buf-fer/selection regions, although involved in an intermediate processing stage (be-tween sensory processing and sentence integration), should show the slowest ab-solute fMRI phase, slower than sentential integration. The reason is that, while sen-tence integration proceeds continuously throughout the presentation of the suc-cessive words, the buffer is not needed for processing the first incoming words, espe-cially at slow presentation rates, and is maximally involved only toward the end of the sentence.
To test these predictions, we extracted the phase of the BOLD response within ROIs defined as 10 mm spheres centered on peaks identified by the standard SPM analysis (Table 1), separately for each compression factor (20, 40, 60, 80, 100%), each modality, and each subject. We restricted our analysis to the left hemisphere because phase estimates were in-sufficiently stable for the right hemisphere, where activation was smaller. Because phase extraction from single-subject data is in-herently noisy, the phases were averaged together (using the cir-cular mean) for ROIs obtained through a given contrast (i.e., linear with duration, maximum for intermediate duration, and collapse for shortest duration), resulting in one phase measure per participant for each experimental condition and each of the three region types. This allowed us to directly compare them to the predictions of the regions introduced in the model respectively as sensory, buffer/selection, and sentence integration regions.
Figure 8 shows the mean phase in these three types of regions, as a function of stimulus duration and modality. The profiles were similar for auditory and visual stimulation and globally resembled those predicted by the model (leaving aside an overall shift probably due to an imperfect onset-delay parameter of the standard hemody-namic function in SPM, used to generate the theoretical predic-tions). We first tested the prediction that the impact of sentence duration on the phase of the activation should differ across the three region types. Thus, we computed an ANOVA with region type (three levels) and compression factor as within-subject variables, separately for each modality (because the sensory ROIs differed in each modal-ity). In each modality, the main effects of region type and of com-pression rate were significant (p⬍ 10⫺3). Crucially, the interaction between the two factors was significant in the visual modality [F(8,120)⫽ 2.68, p ⬍ 0.01] and approached significance in the
audi-tory modality [F(8,120)⫽ 1.92, p ⬍ 0.06].
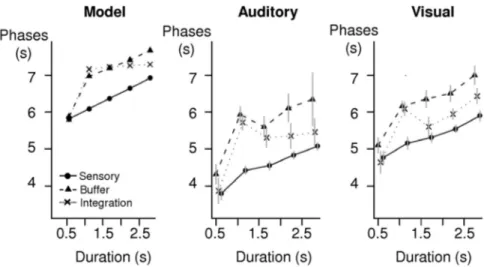
For sensory regions, we observed exactly the predicted linear increase in phase with stimulus duration. We used a linear regres-sion to estimate the slope with which the phase in sensory regions increased as a function of sentence duration (Sigman et al., 2007). For both visual and auditory modalities, the observed slopes were both significantly different from zero ( p⬍ 0.001) and did not differ significantly from the value of 0.50 predicted under the hypothesis that the duration of neural activity is directly related to stimulus duration (auditory slope⫽ 0.54; visual slope ⫽ 0.47). The model also predicted that buffer and sentence integration regions should show a slower overall phase than sensory regions,
Figure 8. Predicted and observed phases of the fMRI activation as a function of sentence duration. Left, Quantitative theoretical predictions for the three types of regions postulated in the model (sensory, buffer, integration). The phases in seconds were estimated by fitting a sinusoidal function of the time courses presented in Figure 7. Middle and right, Observed fMRI phases in the left hemisphere, separately for the auditory and visual modalities. All ROIs located in the left hemisphere and reported in Table 1 were averaged together, separately for the three types of regions defined by the SPM contrasts in Figure 1 and Table 1.
at all but the shortest sentence duration (Fig. 7, left). Therefore, we used ANOVAs to compare the phases in sensory regions with those in buffer regions and, separately, in sentence integration regions. When comparing buffer and sensory regions, in both modalities, the phase was shorter overall in sensory regions (au-ditory: F(1,15)⫽ 46.9, p ⬍ 10⫺3; visual: F(1,15)⫽ 24.1, p ⬍ 10⫺3).
The predicted region by duration interaction was only significant in the visual modality (F(4,60)⫽ 3.83, p ⬍ 0.01), not the auditory
modality (F(4,60)⫽ 1.28, p ⬍ 0.30). When comparing sensory and
sentence integration regions, the phase was shorter in sensory regions in both modalities (auditory: F(1,15)⫽ 6.21, p ⬍ 0.05;
visual: F(1,15)⫽ 7.56, p ⬍ 0.05), with a significant region by
du-ration interaction (auditory: F(4,60) ⫽ 19.8, p ⬍ 10⫺3; visual:
F(4,60)⫽ 4.12, p ⬍ 10⫺2).
The model predicted a subtle difference in the phase of buffer versus sentence integrations; in the intelligible range (40 –100% compression factors), the phase should stay constant for sentence integration regions (predicted slope⫽ 0) but should increase for buffer regions (predicted slope⫽ 0.40). Indeed, for the buffer regions, the regression slopes restricted to the range 40 –100% were 0.38 and 0.53, respectively, for auditory and visual modality. These values were significantly higher than zero ( p⬍ 0.001) and not significantly different from the value of 0.40 expected from the model. Furthermore, slopes were significantly higher for buf-fer regions than for sentence integration regions ( p⬍ 0.001), and the differences in slopes (0.58 and 0.28, respectively) did not differ significantly from the predicted value of 0.40. For sentence integration regions, the slope was close to the predicted value of zero in the auditory modality (slope⫽ ⫺0.21, not significant). However, it was significantly positive, with a mean of 0.26, in the visual modality ( p⬍ 0.001), the only significant deviation from the model. Examination of the fMRI response confirmed a small acceleration with presentation speed in the visual modality, an effect that was not seen with auditory sentences (Fig. 4, region pSTS). This observation suggests that the internal processing speed may be slightly faster for visual sentences than for auditory sentences, so that the visual sentences presented at 100% rate (257 wpm) were below the maximal processing speed.
Finally, we used ANOVAs to compare the absolute phases in buffer regions with sentence integration regions. As predicted, the absolute phase of the fMRI activation was shorter in sentence integration than in buffer regions for written sentences (visual:
F(1,15)⫽ 4.63, p ⬍ 10⫺2) and marginally so for spoken sentences
(F(1,15)⫽ 3.85, p ⬍ 0.07).
Discussion
We parsed brain areas according to their fMRI response to five levels of sentence compression, ranging from intelligible (100 – 60%) to challenging (40%) and to incomprehensible (20%). Early sensory regions showed a linear acceleration paralleling stimulus duration. However, perisylvian language areas in the left STS and inferior frontal gyrus demonstrated a temporally invari-ant response profile up to⬃40% compression, followed by a sudden collapse. These results confirm an association of language intelligibility with the left perisylvian inferior frontal gyrus and the superior temporal gyrus (Davis and Johnsrude, 2003; Davis et al., 2007), including for compressed speech (Poldrack et al., 2001; Peelle et al., 2004, 2010; Adank and Devlin, 2010). Adank et al. (2010) found that, as subjects adapt to compressed speech, acti-vation increases in bilateral superior temporal and midline pre-motor cortices. Our results complement this study by showing that, even for a fixed presentation duration, spontaneous
fluctu-ations in intelligibility are also associated with the same network (Fig. 5).
By varying word rate, several studies observed that activation amplitude in regions surrounding the primary sensory cortices varies linearly with stimulus duration (Binder et al., 1994; Dhankhar et al., 1997; Buchel et al., 1998; Poldrack et al., 2001), while other regions show a quadratic variation (Binder et al., 1994; Buchel et al., 1998; Poldrack et al., 2001) or a peak of acti-vation at the fastest presentation rate (Peelle et al., 2004). How-ever, previous studies used block designs, which prevents identification of the temporal response profile and drastically complicates modeling and interpretation. For instance, Poldrack et al. (2001) used a fixed interstimulus interval within each block, thus introducing a confound (at faster compression rates, more sentences are presented). Furthermore, Adank et al. (2010) mod-eled the fMRI activation using predictors whose durations were proportional to the presentation duration, thus implicitly assum-ing a linear variation of neural activity.
Event-related fMRI allowed us to bypass these problems and observe both the amplitude and the delay of fMRI activation evoked by a single compressed sentence. Our findings confirm that fMRI can have a high temporal resolution (Menon et al., 1998; Sigman et al., 2007; Sigman and Dehaene, 2008). Sensory areas showed the fastest BOLD response to language, followed by left superior temporal sulcus and inferior frontal regions, repli-cating earlier observations (Dehaene-Lambertz et al., 2006; Brauer et al., 2008; Pallier et al., 2011). Importantly, these delays cannot be solely due to inflexible hemodynamics, as they vary with sentence repetition (Dehaene-Lambertz et al., 2006), syntac-tic complexity (Pallier et al., 2011), and word rate (present study). They are also too large to arise merely from synaptic propagation of the language input into the temporal and frontal lobes. Tenta-tively, they might reflect information integration operating over increasingly larger speech units, from individual phonemes to words, phrases, or prosodic patterns, therefore requiring longer integration time and more sustained activity (Dehaene-Lambertz et al., 2008).
Although the compression rates of 60, 80, and 100% were all associated with near-perfect sentence intelligibility and thus con-stant behavior, they modulated brain activation profiles. In sen-sory regions, both activation amplitude and peak delay were reduced by language compression, as expected from a simple convolution of the hemodynamic response function with a neu-ral activation proportional to stimulus duration. However, other regions attributed to the postulated buffer (e.g., inferior frontal gyrus/anterior insula) exhibited a nontrivial profile consisting in an accelerated activation but with an increasing amplitude as sentence duration decreased, for both written and spoken sen-tences. Finally, left inferior frontal gyrus and STS showed a con-stant activation profile, both in time and in amplitude, over the intelligible compression range, followed by a collapse at unintel-ligible rates (a profile again independent of input modality).
Our results indicate that the majority of left-hemispheric areas classically associated with higher-level language processing (Saur et al., 2010; Pallier et al., 2011) exhibit, for both written and spoken language, temporally stable responses that cannot be ac-celerated much beyond the rate that served as our 100% baseline (256 wpm). These findings are strongly suggestive of a temporal bottleneck. We therefore propose that the classical bottleneck model of dual-task processing should be extended to the specific multitasking problem posed by fast language comprehension. In dual tasks, participants process two successive targets at a very short interval. Behavior and brain imaging results indicate that,