arXiv:1208.1948v3 [hep-ex] 23 Nov 2016
CERN-PH-EP-2012-227 09 Aug 2012
D
+smeson production at central rapidity
in proton–proton collisions at
√
s
= 7 TeV
ALICE Collaboration∗
Abstract
The pT-differential inclusive production cross section of the prompt charm-strange meson D+s in the rapidity range|y| < 0.5 was measured in proton–proton collisions at√s= 7 TeV at the LHC using
the ALICE detector. The analysis was performed on a data sample of 2.98 ×10⁸events collected with a minimum-bias trigger. The corresponding integrated luminosity is Lint= 4.8 nb−1. Reconstructing the decay D+s →φπ+, with φ→ K−K+, and its charge conjugate, about 480 D±s mesons were counted, after selection cuts, in the transverse momentum range 2< pT< 12 GeV/c. The results are compared with predictions from models based on perturbative QCD. The ratios of the cross sections of four D meson species (namely D0, D+, D∗+ and D+s) were determined both as a function of pT and integrated over pTafter extrapolating to full pTrange, together with the strangeness suppression factor in charm fragmentation. The obtained values are found to be compatible within uncertainties with those measured by other experiments in e+e−, ep and pp interactions at various centre-of-mass energies.
1 Introduction
The measurement of open charm production in proton–proton (pp) collisions at the Large Hadron Col-lider (LHC) provides a way to test predictions of quantum chromodynamics (QCD) at the highest avail-able collision energies. Charm and beauty production cross sections can be computed in perturbative QCD (pQCD) using the factorization approach [1, 2]. In this scheme, cross sections are computed as a convolution of three terms: the parton distribution functions of the incoming protons, the partonic hard scattering cross section, and the fragmentation process. The partonic hard scattering cross section is computed through a perturbative calculation [1, 2], while the parton distribution functions and the frag-mentation process are parametrized on experimental data. In particular, the fragfrag-mentation describes the non-perturbative transition of a charm quark to a hadron. It is modeled by a fragmentation function, which parametrizes the fraction of quark energy transferred to the produced hadron, and by the fragmen-tation fractions, f(c → D), which describe the probability of a charm quark to hadronize into a particular hadron species.
The production of prompt D0, D+and D∗+mesons in pp collisions at√s= 7 TeV was measured with the
ALICE detector at two centre-of-mass energies, namely 7 and 2.76 TeV [3,4]. Here, ‘prompt’ indicates D mesons produced at the pp interaction point, either directly in the hadronization of the charm quark or in strong decays of excited charm resonances. The contribution from weak decays of beauty mesons, which give rise to feed-down D mesons displaced from the interaction vertex, was subtracted. The measured pT
-differential cross sections for prompt D0, D+and D∗+are described within uncertainties by theoretical predictions based on pQCD at next-to-leading order (e.g. in the general-mass variable-flavour-number scheme, GM-VFNS [6]) or at fixed order with next-to-leading-log resummation (FONLL [5]). The central value of the GM-VFNS predictions for these three mesons lies systematically above the data. On the other hand, the data tend to be higher than the central value of the FONLL predictions, as it was observed at lower collision energies, namely at the Tevatron [7, 8], where hadronic decays of D mesons were reconstructed, and at RHIC, where measurements of electrons from semileptonic D and B decays were performed [9, 10].
Heavy flavour production in hadronic collisions can be calculated also in the framework of kT
-factoriza-tion with unintegrated gluon distribu-factoriza-tions (UGDFs) to account for the transverse momenta of the initial partons [11–14]. Calculations of inclusive production cross section of D mesons based on this approach in the leading order (LO) approximation were recently published for LHC energy and compared to experimental results [15, 16].
The measurement of the pT-differential prompt D+s meson production is of particular interest due to its
strange valence quark content. The D+s production cross section in hadronic collisions was measured at lower energies at the Tevatron collider in the transverse momentum (pT) range 8< pT< 12 GeV/c [7].
Preliminary results for D+s production at the LHC were reported by the LHCb Collaboration for prompt mesons at forward rapidity [17] and by the ATLAS Collaboration at central rapidity [18]. The LHCb Collaboration also measured the asymmetry between prompt D+s and D−s production in the rapidity region 2< y < 4.5 and for transverse momenta pT> 2 GeV/c, observing a small excess of D−s mesons: AP= (σ(D+s) −σ(Ds−))/(σ(D+s) +σ(D−s)) = (−0.33±0.22±0.10)% [19]. Such a particle-antiparticle
production asymmetry is understood in phenomenological models as due to the effect of the beam remnants on the heavy-quark hadronization, see e.g. [20].
Charm production has been measured in ep interactions at the HERA collider by the ZEUS [21] and H1 [22] Collaborations, as well as in e+e− annihilations, at the Z0 resonance, by the ALEPH [23], DELPHI [24] and OPAL [25] Collaborations, and at centre-of-mass energies of about 10 GeV by the CLEO [26] and ARGUS [27] Collaborations.
As far as theoretical models are concerned, a calculation of the D+s production cross section within the FONLL framework is not available, because of the poor knowledge of the parton fragmentation
function. The measured data points can be compared with the GM-VFNS prediction that uses meson specific fragmentation functions [28].
From the differential production cross section of prompt D0, D+, D∗+ and D+s mesons, the relative production yields of the D meson species can be studied as a function of transverse momentum. A pT
dependence is expected for these ratios, due to differences in the fragmentation function of the charm quark in the four considered meson species, and because of the different contributions from decays of higher excited states. In this sense, the measurement of the ratios between the D meson species can provide information on the fragmentation functions that can be used in the pQCD models based on the factorization approach. The suppression of strange meson production in the charm fragmentation is quantified by the strangeness suppression factor,γs, which is computed from the measured D0, D+ and
D+s cross sections extrapolated to full pTrange, as defined in Section 6. The values measured at the LHC
can be compared with those measured for different energies and different colliding systems [29]. Furthermore, the measurement of D+s in pp collisions provides a reference for the studies of charm production in heavy-ion collisions. According to QCD calculations on the lattice, under the conditions of high energy-density and temperature that are reached in these collisions, the confinement of quarks and gluons into hadrons vanishes and a transition to a Quark-Gluon Plasma (QGP) occurs [30]. Charm hadrons are a powerful tool to study the properties of the QCD medium created in these collisions [31– 33]. In particular, the D+s meson is sensitive to strangeness production in heavy-ion collisions. Strange quarks are abundant in the QGP, resulting in an enhanced production of strange particles with respect to pp collisions [34–37]. Hence, at low momentum, the relative yield of D+s mesons with respect to non-strange charm mesons (such as D0 and D+) is predicted to be enhanced in nucleus-nucleus collisions [38–40], if the dominant mechanism for D meson formation at low/intermediate momenta is in-medium hadronization of charm quarks via coalescence with strange quarks [41–43].
In this paper, we report on the measurement of D+s production cross section in pp collisions at√s= 7 TeV
with the ALICE detector at the LHC. D+s mesons were reconstructed through their hadronic decay chan-nel D+s →φπ+with a subsequent decayφ→ K−K+. The pT-differential cross section is measured over
a range of transverse momentum extending from 2 GeV/c up to 12 GeV/c at central rapidity, |y| < 0.5. In Section 2, the detector layout and the data sample are described. This is followed, in Section 3, by the description of the D+s meson reconstruction strategy, the selection cuts, and the raw yield extraction from the invariant mass distributions. The various corrections applied to obtain the production cross sec-tions are illustrated in Section 4. This also includes the estimation of the fraction of promptly produced D+s mesons. The various sources of systematic uncertainties are discussed in detail in Section 5. The results on the pT-differential cross section compared with pQCD theoretical predictions, the D meson
production ratios, and the strangeness suppression factor are presented in Section 6.
2 Detector layout and data collection
The ALICE detector is described in detail in [44]. It is composed of a central barrel, a forward muon spectrometer, and a set of forward detectors for triggering and event characterization. The detectors of the central barrel are located inside a large solenoid magnet that provides a magnetic field B= 0.5 T,
parallel to the beam line.
D+s mesons, and their charge conjugates, were reconstructed in the central rapidity region from their decays into three charged hadrons (K−K+π+), utilizing the tracking, vertexing and particle identification capabilities of the central barrel detectors.
The trajectories of the decay particles were reconstructed from their hits in the Inner Tracking System (ITS) and in the Time Projection Chamber (TPC) detectors in the pseudo-rapidity range|η| < 0.8. The ITS [45] consists of six cylindrical layers of silicon detectors with radii in the range between 3.9 cm
and 43.0 cm. The two innermost layers are equipped with Silicon Pixel Detectors (SPD), Silicon Drift Detectors (SDD) are used in the two intermediate layers, while the two outermost layers are composed of double-sided Silicon Strip Detectors (SSD). The ITS, thanks to the high spatial resolution of the reconstructed hits, the low material budget (on average 7.7% of a radiation length for tracks atη= 0),
and the small distance of the innermost layer from the beam vacuum tube, provides the capability to detect the secondary vertices originating from heavy flavour decays. For this purpose, a key role is played by the two layers of SPD detectors, which are located at radial positions of 3.9 and 7.6 cm from the beam line and cover the pseudo-rapidity ranges|η| < 2.0 and |η| < 1.4, respectively. The TPC [46]
provides track reconstruction with up to 159 space points per track in a cylindrical active volume of about 90 m3. The active volume has an inner radius of about 85 cm, an outer radius of about 250 cm, and an overall length along the beam direction of 500 cm.
Particle identification (PID) is provided by the measurement of the specific ionization energy loss, dE/dx,
in the TPC and of the flight time in the time-of-flight (TOF) detector. The dE/dx samples measured by
the TPC are reduced, by means of a truncated mean, to a Gaussian distribution with a resolution of σdE/dx/(dE/dx) ≈ 5.5% [46]. The TOF detector is positioned at 370–399 cm from the beam axis and covers the full azimuth for the pseudo-rapidity range |η| < 0.9. The particle identification is based on the difference between the measured time-of-flight and its expected value, computed for each mass hypothesis from the track momentum and length. The overall resolution on this difference is about 160 ps and it includes the detector intrinsic resolution, the contribution from the electronics and the calibration, the uncertainty on the start time of the event (i.e. the time of the collision), and the tracking and momentum resolution. The start time of the event is defined as the weighted average between the one estimated using the particle arrival times at the TOF [47] and the one measured by the T0 detector. The T0 detector is composed of two arrays of Cherenkov counters located on either side of the interaction point at+350 cm and −70 cm from the nominal vertex position along the beam-line. In this analysis, the time-of-flight measurement provides kaon/pion separation up to a momentum of about 1.5 GeV/c.
The data sample used for the analysis consists of 298 million minimum-bias (MB) pp collisions at
√
s= 7 TeV, corresponding to an integrated luminosity Lint= 4.8 nb−1, collected during the 2010
LHC run period. The minimum-bias trigger was based on the information of the SPD and the VZERO detectors. The VZERO detector is composed of two arrays of scintillator tiles with full azimuthal coverage in the pseudo-rapidity regions 2.8 <η< 5.1 and −3.7 <η< −1.7. Minimum-bias collisions
were triggered by requiring at least one hit in either of the VZERO counters or in the SPD (|η| < 2), in coincidence with the arrival of proton bunches from both directions. This trigger was estimated to be sensitive to about 87% of the pp inelastic cross section [48, 49]. It was verified by means of Monte Carlo simulations based on the PYTHIA 6.4.21 event generator [50] (with Perugia-0 tune [51]) that the minimum-bias trigger is 100% efficient for events containing D mesons with pT > 1 GeV/c and |y| < 0.5 [3]. Events were further selected offline to remove the contamination from beam-induced
background using the timing information from the VZERO and the correlation between the number of hits and track segments (tracklets) in the SPD detector.
During the pp run, the luminosity in the ALICE experiment was limited to 0.6–1.2 × 1029 cm−2s−1 by displacing the beams in the transverse plane by 3.8 times the r.m.s. of their transverse profile, thus keeping the probability of collision pile-up below 4% per triggered event. The luminous region, measured from the distribution of the reconstructed interaction vertices, had an r.m.s. width of about 4–6 cm along the beam direction and 35–50 µm in the transverse plane (the quoted ranges originate from the variations of the beam conditions during the data taking). Only events with a vertex found within±10 cm from the centre of the detector along the beam line were used for the analysis. This requirement selects a region where the vertex reconstruction efficiency is independent of its position along the beam line and it provides almost uniform acceptance for particles within the pseudo-rapidity range|η| < 0.8 for all events in the analyzed sample. Pile-up events were identified by the presence of more than one interaction
vertex reconstructed by matching hits in the two SPD layers (tracklets). An event was rejected from the analyzed data sample if a second interaction vertex was found, it had at least 3 associated tracklets, and it was separated from the first one by more than 8 mm. The remaining undetected pile-up is negligible for the analysis described in this paper.
3 D+s meson reconstruction and selection
D+s mesons and their antiparticles were reconstructed in the decay chain D+s →φπ+ (and its charge conjugate) followed byφ→ K−K+. The branching ratio (BR) of the chain D+s →φπ+→ K−K+π+is 2.28 ± 0.12% [52]. It should be noted that other D+s meson decay channels can give rise to the same K−K+π+ final state. Among them, those with larger BR are D+s → K∗0K+and D+s → f0(980)π+, with BR into the K−K+π+ final state of 2.63 ± 0.13% and 1.16 ± 0.32%, respectively. However, as it will be discussed in the following, the selection efficiency for these decay modes is strongly suppressed by the cuts applied to select the signal candidates1, and therefore the measured yield is dominated by the D+s →φπ+→ K−K+π+decays.
D+s mesons have a mean proper decay length cτ = 150 ± 2µm [52], which makes it possible to resolve their decay vertex from the interaction (primary) vertex. The analysis strategy for the extraction of the signal from the large combinatorial background can therefore be based on the reconstruction and selection of secondary vertex topologies with significant separation from the primary vertex.
D+s meson candidates were defined from triplets of tracks with proper charge sign combination. Tracks were selected requiring |η| < 0.8, pT > 0.4 GeV/c, a minimum of 70 associated space points in the
TPC,χ2/ndf < 2 for the track momentum fit in the TPC, and at least 2 associated hits in the ITS, out of
which at least one has to be in either of the two SPD layers. For tracks that satisfy these TPC and ITS selection criteria, the transverse momentum resolution is better than 1% at pT= 1 GeV/c and about 2%
at pT= 10 GeV/c. The resolution on the track impact parameter (i.e. the distance of closest approach
of the track to the primary interaction vertex) in the bending plane (rφ) is better than 75µm for pT> 1
GeV/c, well reproduced in Monte Carlo simulations [3].
For each D+s candidate, in order to have an unbiased estimate of the interaction vertex, the event primary vertex was recalculated from the reconstructed tracks after excluding the candidate decay tracks. The secondary vertex was reconstructed from the decay tracks with the same algorithm used to compute the primary vertex [3]. The position resolution on the D+s decay vertices was estimated via Monte Carlo simulations to be of the order of 100µm for each of the three coordinates with little dependence on pT.
The resolution on the position of the primary vertex depends on the event multiplicity: for the transverse coordinates, where the information on the position and spread of the luminous region is used to constrain the vertex fit, it ranges from 40µm in low-multiplicity events to about 10µm in events with 40 charged particles per unit of rapidity.
Candidates were then filtered by applying kinematical and topological cuts together with particle iden-tification criteria. With the track selection described above, the acceptance in rapidity for D mesons drops steeply to zero for |y|∼>0.5 at low pT and |y|∼>0.8 at pT∼>5 GeV/c. A pT-dependent fiducial
acceptance cut was therefore applied on the D meson rapidity,|y| < yfid(pT), where pT is the D+s
trans-verse momentum. The cut value, yfid(pT), increases from 0.5 to 0.8 in the transverse momentum range
0< pT< 5 GeV/c according to a second-order polynomial function and it takes a constant value of 0.8
for pT> 5 GeV/c.
The topological selections were tuned to have a large statistical significance of the signal, while keeping
1To reduce the combinatorial background, a selection exploiting the mass of the intermediate resonant state was applied.
Since the width of theφ peak is narrower than those of the K∗0and the f0(980), the decay channel through theφresonance,
Table 1: Measured raw yields (ND±s raw), signal (S) over background (B) and statistical significance ( S/√S+ B )
for D+s and their antiparticles in the four considered pTintervals. The estimation of the systematic uncertainty on the raw yield is described in Section 5.
pTinterval ND
±
s raw ± stat. ± syst. S/B (3σ) Significance (3σ)
(GeV/c)
2–4 125±36±25 0.12 3.6
4–6 190±35±28 0.26 6.3
6–8 79±19±12 0.40 4.8
8–12 85±16±17 0.58 5.6
the selection efficiency as high as possible. It was also checked that background fluctuations were not causing a distortion in the signal line shape by verifying that the D+s meson mass and its resolution were in agreement with the Particle Data Group (PDG) value (1.969 GeV/c2[52]) and the simulation results,
respectively. The resulting cut values depend on the transverse momentum of the candidate.
The candidates were selected according to the decay length and the cosine of the pointing angle,θpointing,
which is the angle between the reconstructed D meson momentum and the line connecting the primary and secondary vertex. The three tracks composing the candidate triplet were required to have small distance to the reconstructed decay vertex. In addition, D+s candidates were selected by requiring that one of the two pairs of opposite-charged tracks has an invariant mass compatible with the PDG world average for the φ mass (1.019 GeV/c2 [52]). To further suppress the combinatorial background, the
angles θ∗(π) and θ′(K) were exploited. θ∗(π) is the angle between the pion in the KKπ rest frame and the KKπ flight line, which is defined by the positions of the primary and secondary vertices in the laboratory frame. θ′(K) is the angle between one of the kaons and the pion in the KK rest frame. The
cut values used for the D+s mesons with 2 < pT < 4 GeV/c were: decay length larger than 350 µm,
cosθpointing > 0.94, |MKinv+K−− MφPDG| < 8 MeV/c2, cosθ∗(π) < 0.95, and |cos3θ′(K)| > 0.1. A looser
selection was applied at higher pT due to the lower combinatorial background, resulting in a selection
efficiency that increases with increasing pT.
Particle identification selections, based on the specific energy loss, dE/dx, from the TPC and the
time-of-flight from the TOF detector, were used to obtain further reduction of the background. Compatibility cuts were applied to the difference between the measured signals and those expected for a pion or a kaon. A track was considered compatible with the kaon or pion hypothesis if both its dE/dx and
time-of-flight were within 3σ from the expected values, with at least one of them within 2σ. Tracks without a TOF signal were identified using only the TPC information and requiring a 2σ compatibility with the expected dE/dx. Candidate triplets were required to have two tracks compatible with the kaon
hypothesis and one with the pion hypothesis. In addition, since the decay particle with opposite charge sign has to be a kaon, a triplet was rejected if the opposite-sign track was not compatible with the kaon hypothesis. This particle identification strategy preserves more than 90% of the D+s signal and provides a reduction of the combinatorial background under the D+s peak by a factor of 10 in the lowest pTinterval
(2< pT< 4 GeV/c), a factor of 5 in 4 < pT< 6 GeV/c and a factor of 2 at higher transverse momenta.
For each candidate, two values of invariant mass can be computed, corresponding to the two possible assignments of the kaon and pion mass to the two same-sign tracks. Signal candidates with wrong mass assignment to the same-sign tracks would give rise to a contribution to the invariant mass distributions that could potentially introduce a bias in the measured raw yield of D+s mesons. It was verified, both in data and in simulations, that this contribution is reduced to a negligible level by the particle identification selection and by the requirement that the invariant mass of the two tracks identified as kaons is compatible with theφ PDG mass.
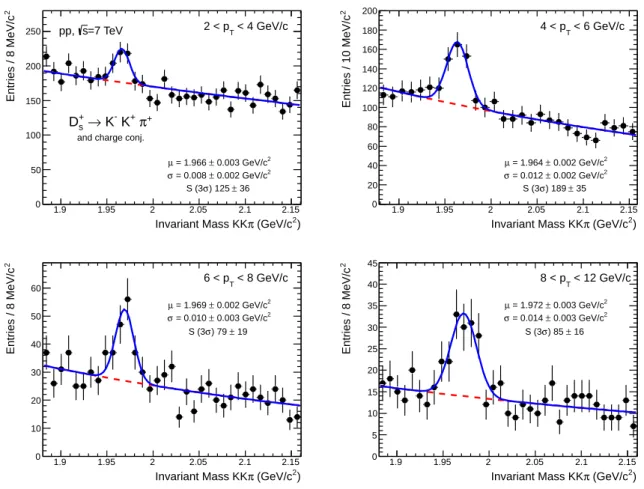
) 2 (GeV/c π Invariant Mass KK 1.9 1.95 2 2.05 2.1 2.15 2 Entries / 8 MeV/c 0 50 100 150 200 250 2 < pT < 4 GeV/c + π + K K → + s D
and charge conj. =7 TeV s pp, 2 0.003 GeV/c ± = 1.966 µ 2 0.002 GeV/c ± = 0.008 σ 36 ± ) 125 σ S (3 ) 2 (GeV/c π Invariant Mass KK 1.9 1.95 2 2.05 2.1 2.15 2 Entries / 10 MeV/c 0 20 40 60 80 100 120 140 160 180 200 < 6 GeV/c T 4 < p 2 0.002 GeV/c ± = 1.964 µ 2 0.002 GeV/c ± = 0.012 σ 35 ± ) 189 σ S (3 ) 2 (GeV/c π Invariant Mass KK 1.9 1.95 2 2.05 2.1 2.15 2 Entries / 8 MeV/c 0 10 20 30 40 50 60 < 8 GeV/c T 6 < p 2 0.002 GeV/c ± = 1.969 µ 2 0.003 GeV/c ± = 0.010 σ 19 ± ) 79 σ S (3 ) 2 (GeV/c π Invariant Mass KK 1.9 1.95 2 2.05 2.1 2.15 2 Entries / 8 MeV/c 0 5 10 15 20 25 30 35 40 45 < 12 GeV/c T 8 < p 2 0.003 GeV/c ± = 1.972 µ 2 0.003 GeV/c ± = 0.014 σ 16 ± ) 85 σ S (3
Figure 1: Invariant mass distributions for D+s candidates and charge conjugates in the four considered pTintervals. The fit functions described in the text are also shown. The values of mean (µ) and width (σ) of the signal peak are reported together with the signal counts (S) integrated in±3σaround the centroid of the Gaussian.
shown in Fig. 1. The fitting function consists of a sum of a Gaussian and an exponential function to describe the signal and the background, respectively. For all pT intervals, the invariant mass range
used for the fit was 1.88 < Minv
KKπ < 2.16 GeV/c2, chosen in order to exclude the region where the
background shape is affected by D+→ K−K+π+ decays (BR=0.265% [52]) that give rise to a bump at the D+invariant mass (1.870 GeV/c2[52]). The mean values of the Gaussian functions in all transverse
momentum intervals were found to be compatible within the uncertainties with the PDG world average for the D+s mass. The Gaussian widths are well reproduced in Monte Carlo simulations. The raw yield ND±s raw (sum of particles and antiparticles) was defined as the integral of the Gaussian. The
values of ND±s raw are reported in Table 1 for the different pT intervals, together with the
signal-over-background (S/B) ratios and the statistical significance, S/√S+ B. For the latter two quantities, signal
(S) and background (B) were evaluated by integrating the fit functions in±3σaround the centroid of the Gaussian.
4 Corrections
In order to obtain the pT-differential cross section for prompt (i.e. not coming from weak decays
of beauty mesons) D±s mesons, the raw yields obtained from the invariant mass analysis (ND±s raw)
were corrected for the experimental acceptance, the reconstruction and selection efficiency, and for the contribution to the D+s measured yield from B meson decay feed-down. The production cross section of
(GeV/c) T p 2 4 6 8 10 12 E ff ic ie n c y × Acceptance -3 10 -2 10 -1 10 1 s + Prompt D , No PID s + Prompt D s + Feed-down D = 7 TeV s pp, (GeV/c) T p 2 3 4 5 6 7 8 9 10 11 12 E ff ic ie n c y × Acceptance -7 10 -6 10 -5 10 -4 10 -3 10 -2 10 -1 10 1 s Prompt D π φ → s D , No PID π φ → s D K *0 K → s D K, No PID *0 K → s D = 7 TeV s pp,
Figure 2: Acceptance× efficiency for D+s mesons as a function of pT, for prompt and feed-down D+s mesons (left panel) and decays throughφand K∗0intermediate resonant state (right panel).
prompt D+s mesons was computed as: dσD+s dpT |y|<0.5 =1 2 1 ∆y∆pT fprompt· ND ± s raw |y|<yfid
(Acc ×ε)prompt· BR · Lint
. (1)
where∆pTis the width of the pTinterval,∆y (= 2 yfid(pT)) is the width of the fiducial rapidity coverage
(see Section 3) and BR is the decay branching ratio (2.28% [52]). The factor fprompt is the prompt
fraction of the raw yield; (Acc ×ε)prompt is the acceptance times efficiency of promptly produced D+s mesons. The efficiencyε accounts for vertex reconstruction, track reconstruction and selection, and for D+s candidate selection with the topological and particle identification criteria described in Section 3. The factor 1/2 accounts for the fact that the measured raw yields are the sum of D+s and D−s , while the cross section is given for particles only, neglecting the small particle-antiparticle production asymmetry observed by LHCb [19]. The integrated luminosity, Lint= 4.8 nb−1, was computed from the number
of analyzed events and the cross section of pp collisions passing the minimum-bias trigger condition defined in Section 2,σpp,MB= 62.2 mb [49, 53]. The value ofσpp,MBwas derived from a van der Meer scan [54] measurement, which has an uncertainty of 3.5%, mainly due to the uncertainties on the beam intensities.
The acceptance and efficiency correction factors were determined using pp collisions simulated with the PYTHIA 6.4.21 event generator [50] with the Perugia-0 tune [51]. Only events containing D mesons were transported through the apparatus (using the GEANT3 transport code [55]) and reconstructed. The luminous region distribution and the conditions (active channels, gain, noise level, and alignment) of all the ALICE detectors were included in the simulations, considering also their evolution with time during the 2010 LHC run.
The acceptance-times-efficiency for D+s →φπ+→ K−K+π+ decays in the fiducial rapidity range de-scribed in Section 3 are shown in the left panel Fig. 2 for prompt and feed-down D+s mesons. The acceptance-times-efficiency for the prompt mesons increases from about 1% in the lowest considered pT
interval up to 10–15% at high pT. For D+s mesons from B decays, the efficiency is larger by a factor
1.5–2 (depending on pT) because the decay vertices of the feed-down D mesons are more displaced from
the primary vertex and, therefore, they are more efficiently selected by the topological cuts. The differ-ence between the prompt and feed-down efficiencies decreases with increasing pT, because the applied
selections are looser in the higher transverse momentum intervals. The acceptance-times-efficiency for prompt D+s mesons obtained without applying the particle identification selection is also shown to sin-gle out the PID contribution to the overall efficiency. The used particle identification strategy preserves more than 90% of the signal and does not show any significant dependence on D+s meson pTin the range
considered in this analysis.
As discussed in Section 3, the decay of the D+s meson into the K−K+π+final state occurs via different intermediate resonant states. The selection strategy used in this analysis requires that one of the opposite-sign pairs of tracks composing the candidate triplet has an invariant mass compatible with the φ meson. The decays D+s →φπ+→ K−K+π+ are therefore preferentially selected by the applied cuts. Nevertheless, a fraction of the D+s decaying via another resonant state can pass the selection cuts. In the right panel of Fig. 2, the acceptance-times-efficiencies for prompt D+s decaying to K−K+π+ final state via aφand a K∗0in the intermediate state are compared. The acceptance-times-efficiency for the decay chain D+s → K∗0K+→ K−K+π+is smaller by a factor≈ 100 with respect to the decay throughφ, and it is further reduced when applying the PID selection. Indeed, the PID allows the rejection of D+s decaying via a K∗0that would pass the selection on the invariant mass of theφin case of wrong assignment of the mass (kaon/pion) to the two same-sign tracks.
The contribution to the inclusive raw yields due to D+s from B feed-down was subtracted using the beauty production cross section from the FONLL calculation [1, 5], the B→ D+s decay kinematics from the EvtGen package [56], and the Monte Carlo efficiencies for feed-down D+s mesons. Before running the EvtGen decayer, the B admixture cross section predicted by FONLL was split into that of B0, B+, B0s andΛbby assuming the same pT shape for all hadrons and the production fractions from [52], namely
40.1% of B0, 40.1% of B+, 10.5% of B0s and 9.3% of beauty baryons. The resulting fraction of prompt D+s mesons, fprompt, depends on the pTinterval, on the applied selection cuts, and on the parameters used
in the FONLL calculation for the B meson cross section. It ranges from 0.93 in the lowest transverse momentum interval (2< pT< 4 GeV/c) to ≈ 0.87 at high pT (> 6 GeV/c).
5 Systematic uncertainties
The systematic uncertainties on the D+s cross section are summarized in Table 2 for the considered pT
intervals.
The systematic uncertainty on the yield extraction was defined as the full spread of the D+s yield values obtained with different techniques to analyze the invariant mass distributions in each pTinterval. The fit
was repeated in different mass ranges and by varying the function used to describe the background. In particular, first and second order polynomials were used instead of an exponential for the background. In case of fitting in an extended mass range, a second Gaussian signal was included in the fit function to account for the D+→ K−K+π+decays. Furthermore, the yield extraction was repeated using a method based on bin counting after subtraction of the background estimated from a fit in the mass side bands. The resulting uncertainty amounts to 15–20% depending on the pTinterval, as detailed in Table 2.
The systematic uncertainty on the tracking efficiency (including the effect of the track selection) was evaluated by comparing the probability of track finding in the TPC and track prolongation from the TPC to the ITS in the data with those in the simulation, and by varying the track quality selections. The estimated uncertainty is 4% per track, which results in 12% for the three-body decay of D+s mesons. Another source of systematic uncertainty originates from the residual discrepancies between data and simulation for the variables used to select the D+s candidates. The distributions of these variables were compared for candidates passing loose topological cuts, i.e. essentially background candidates, and found to be well described in the simulation. The effect of the imperfect implementation of the detector description in the Monte Carlo simulations was estimated by repeating the analysis with different sets of
cuts. The cut values were changed in order to vary the efficiency of signal selection by at least 20% in all
pT intervals. A systematic uncertainty of 15% was estimated from the spread of the resulting corrected
yields. Part of this uncertainty is due to residual detector misalignment effects not fully described in the simulation. To estimate this contribution, the secondary vertices in the simulation were reconstructed also after a track-by-track scaling of the impact parameter residuals with respect to their true value. In particular, a scaling factor of 1.08, tuned to reproduce the impact parameter resolution observed in the data (see [3]), was used. The resulting variation of the efficiency was found to be 4% in the lowest pT
interval used in this analysis and less than 1% for pT> 6 GeV/c. This contribution was not included
explicitly in the systematic uncertainty, because it is already accounted for in the cut variation study. Due to the limited statistics, it was not possible to analyze separately D+s and D−s candidates to verify the absence of biases coming from a different reconstruction efficiency for tracks with positive and negative charge sign not properly described in the simulation 2. This check was carried out for other D meson species [3] without observing any significant difference between particle and antiparticle.
The systematic uncertainty induced by a different efficiency for particle identification in data and simulation was evaluated by comparing the resulting pT-differential cross section with that obtained
using a different PID approach based on 3σ (instead of 2σ) cuts on TPC dE/dx and time-of-flight
signals, which preserves almost 100% of the signal. In addition, the PID efficiency, was estimated by comparing the reduction of signal yield due to the PID selection in data and in simulation, when the same topological cuts are applied. Due to the limited statistical significance, this check could be performed in data only for D+s candidates integrated over the transverse momentum range 4< pT< 12 GeV/c. From
these studies, a systematic uncertainty of 7%, independent of pT, was assigned to the PID selection.
The contribution to the measured yield from D+s decaying into the K−K+π+final state via other resonant channels (i.e. not via aφmeson) was found to be less than 1% due to the much lower selection efficiency, as shown in the right panel of Fig. 2 for the case of the decay through a K∗0. The contamination from other decay chains (all having smaller branching ratio than the two reported in Fig. 2) was also found to be negligible.
The effect on the selection efficiency due to the shape of the D+s pTspectrum used in the simulation was
estimated from the relative difference between the Monte Carlo efficiencies obtained using two different
pT shapes, namely those from PYTHIA [50] with Perugia-0 tune [51] and from the FONLL pQCD
calculation [1, 5]. The resulting contribution to the systematic uncertainty was found to be 3% in the two lowest pTintervals, where the selection efficiency is strongly pTdependent, and 2% at higher pT.
The systematic uncertainty from the subtraction of feed-down D mesons was estimated following the same approach as used for D0, D+ and D∗+ mesons [3]. The contribution of the FONLL perturbative uncertainties was included by varying the heavy-quark masses and the factorization and renormalization scales,µFand µR, independently in the ranges 0.5 <µF/mT< 2, 0.5 <µR/mT< 2, with the constraint
0.5 < µF/µR < 2, where mT = q
p2T+ m2
c. The mass of the b quark was varied within 4.5 < mb <
5 GeV/c2. The uncertainty related to the B decay kinematics was estimated from the difference between
the results obtained using PYTHIA [50] instead of EvtGen [56] for the particle decays and was found to be negligible with respect to the uncertainty on the B meson cross section in FONLL. Furthermore, the prompt fraction obtained in each pT interval was compared with the results of a different procedure in
which the FONLL cross sections for prompt and feed-down D mesons and their respective Monte Carlo efficiencies are the input for evaluating the correction factor. Since FONLL does not have a specific prediction for D+s mesons, four different approaches were used to compute the pT-differential cross
section of promptly produced D+s. The first two approaches used the FONLL prediction for the generic admixture of charm hadrons and that for D∗+ mesons (the D∗+ mass being close to that of the D+s)
scaled with the fragmentation fractions of charm quarks in the different hadronic species, f(c → D), measured by ALEPH [23]. The other two predictions for prompt D+s were computed using the pT
-differential cross section of c quarks from FONLL, the fractions f(c → D) from ALEPH [23], and the fragmentation functions from [57], which have one parameter, r. Two definitions were considered for the r parameter: i) r= (mD− mc)/mD(mDand mcbeing the masses of the considered D meson species
and of the c quark, respectively) as proposed in [57]; ii) r= 0.1 for all mesons, as done in FONLL after
fitting the analytical forms of [57] to the D∗+ fragmentation function measured by ALEPH [58]. The D∗+s mesons produced in the c quark fragmentation were made to decay with PYTHIA and the resulting D+s were summed to the primary ones to obtain the prompt yield. For all the four predictions used for prompt D+s cross section, the evaluation of fprompt included the FONLL perturbative uncertainties from
the variation of the factorization and renormalization scales in the range quoted above and of the c quark mass within 1.3 < mc< 1.7 GeV/c2. The systematic uncertainty on the B feed-down was defined from
the envelope of the resulting values of fprompt. The resulting uncertainties in the transverse momentum
intervals used in this analysis are about+ 5−17% , as it can be seen in Table 2.
Finally, the results have global systematic uncertainties due to the D+s →φπ+→ K−K+π+ branching ratio (5.3% [52]) and to the determination of the cross section of pp collisions passing the minimum-bias trigger condition (3.5%).
Table 2: Relative systematic uncertainties for the four considered pTintervals. pTinterval (GeV/c)
2–4 4–6 6–8 8–12
Raw yield extraction 20% 15% 15% 20%
Tracking efficiency 12% 12% 12% 12%
Topological selection efficiency 15% 15% 15% 15%
PID efficiency 7% 7% 7% 7%
MC pTshape 3% 3% 2% 2%
Other resonant channels <1% <1% <1% <1%
Feed-down from B + 4−18% + 4−17% + 6−15% + 5−17%
Branching ratio 5.3%
Normalization 3.5%
6 Results
6.1 pT-differential D+s cross section and D meson ratios
The inclusive production cross section for prompt D+s mesons in four transverse momentum intervals in the range 2< pT < 12 GeV/c is shown in Fig. 3. As discussed in section 4, the cross section
reported in Fig. 3 refers to particles only, being computed as the average of particles and antiparticles under the assumption that the production cross section is the same for D+s and D−s. The vertical error bars represent the statistical uncertainties, while the systematic uncertainties are shown as boxes around the data points. The symbols are positioned horizontally at the centre of each pT interval, with the
horizontal bars representing the width of the pTinterval. In Table 3, the numerical values of the prompt
D+s production cross section are reported together with the average pTof D+s mesons in each transverse
momentum interval. ThehpTi values were obtained from the pTdistribution of the candidates in the D+s peak region, after subtracting the background contribution estimated from the side bands of the invariant mass distribution. The measured differential production cross section is compared to two theoretical predictions, namely the GM-VFNS model [6, 59] and the calculations from [16, 60] based on the kT
-factorization approach.
0 2 4 6 8 10 12 14 c) -1 b GeV µ ( |y|<0.5 | T / dp σ d -1 10 1 10 2 10 3 10 ALICE -1 = 4.8 nb int = 7 TeV, L s , pp s + D
5.3% BR norm. unc. (not shown)
±
3.5% lumi,
±
ALICE data points
stat. unc. syst. unc. Theory predictions GM-VFNS fact. T LO k 0 2 4 6 8 10 12 14 Theory 0.51 1.52 2.5 GM-VFNS Data (GeV/c) T p 0 2 4 6 8 10 12 14 Data / 0 0.51 1.52 2.5 -fact. T LO k Data
Figure 3: (colour online) pT-differential inclusive cross section for prompt D+s meson production in pp collisions at√s= 7 TeV. The symbols are positioned horizontally at the centre of each pTinterval. The horizontal error bars represent the pTinterval width. The normalization uncertainty (3.5% from the minimum-bias cross section and 5.3% from the branching ratio uncertainties) is not shown. Theoretical predictions from GM-VFNS [6] and from
kT-factorization at LO [16, 60] are also shown.
The central value of the GM-VFNS prediction corresponds to the default values of the renormalization (µR) and factorization (µIand µFfor initial- and final-state singularities, respectively) scales, i.e. µR=
µI =µF = mT, where mT = q
p2T+ m2
c, with mc = 1.5 GeV/c2. The theoretical uncertainties are
determined by varying the values of the renormalization and factorization scales by a factor of two up and down with the constraint that any ratio of the scale parameters should be smaller than or equal to two [6]. The central value of the GM-VFNS prediction is higher than the measured point by≈ 50% in
the first pT interval, while in the other intervals it agrees with the data within≈ 15%. For D0, D+ and
D∗+mesons measured by ALICE at the same pp collision energy [3], the central value of the GM-VFNS predictions was found to lie systematically above the data. As mentioned in Section 1, predictions for the D+s production cross section within the FONLL framework are not available, due to the poor knowledge of the fragmentation function for charm-strange mesons.
The prediction from [16, 60] is obtained in the framework of kT-factorization at LO using
Kimber-Martin-Ryskin (KMR) unintegrated gluon distributions in the proton. The measured D+s cross section is described by the upper limit of the theoretical uncertainty band.
The ratios of the pT-differential cross sections of D+and D∗+to that of D0, taken from [3], are shown in
the top panels of Fig. 4. In the bottom panels of the same figure, the ratios of the D+s cross section to the D0 and D+ ones are displayed. In the evaluation of the systematic uncertainties on the D meson ratios, the sources of correlated and uncorrelated systematic effects were treated separately. In particular, the contributions of the yield extraction, cut efficiency and PID selection were considered as uncorrelated and summed in quadrature. The systematic uncertainty on the B feed-down subtraction, being completely correlated, was estimated from the spread of the cross section ratios obtained by varying the factorization and renormalization scales and the heavy quark mass in FONLL coherently for all
Table 3: Production cross section in|y| < 0.5 for prompt D+s mesons in pp collisions at√s= 7 TeV, in pTintervals. The normalization uncertainty (3.5% from the minimum-bias cross section and 5.3% from the branching ratio) is not included in the systematic uncertainties reported in the table. The average pTof D+s mesons in each transverse momentum interval is also reported.
pTinterval hpTi dσ/dpT||y|<0.5 ± stat. ± syst.
(GeV/c) (GeV/c) (µb GeV−1c)
2–4 2.7 ± 0.4 19.9 ± 6.1+5.8−6.7 4–6 4.7 ± 0.1 5.06 ± 1.03+1.3−1.5 6–8 6.8 ± 0.1 1.02 ± 0.28+0.27−0.30 8–12 9.4 ± 0.1 0.28 ± 0.06+0.08−0.10 (GeV/c) T p 0 2 4 6 8 10 12 14 16 0 /D + D 0 0.2 0.4 0.6 0.8 1 1.2 ALICE Syst. unc. (GeV/c) T p 0 2 4 6 8 10 12 14 16 0 /D *+ D 0 0.2 0.4 0.6 0.8 1 1.2 FONLL GM-VFNS PYTHIA 6.4, Perugia-0 (GeV/c) T p 0 2 4 6 8 10 12 14 16 0 /D + s D 0 0.1 0.2 0.3 0.4 0.5 0.6 (GeV/c) T p 0 2 4 6 8 10 12 14 16 + /D + s D 0 0.1 0.2 0.3 0.4 0.5 0.6 0.7 0.8 0.9 1
Figure 4: Ratios of D meson production cross sections as a function of pT. Predictions from FONLL, GM-VFNS and PYTHIA 6.4.21 with the Perugia-0 tune are also shown. For FONLL and GM-VFNS the line shows the ratio of the central values of the theoretical cross section, while the shaded area is defined by the ratios computed from the upper and lower limits of the theoretical uncertainty band.
mesons. The uncertainty on the tracking efficiency cancels completely in the ratios between production cross sections of mesons reconstructed from three-body decay channels (D+, D∗+and D+s), while a 4% systematic error was considered in the ratios involving the D0 mesons, which are reconstructed from a two-particle final state. The D+s/D0 and D+s/D+ ratios were corrected for the different value of pp minimum-bias cross section used in [3] and in this analysis3.
The predictions from FONLL (only for D0, D+ and D∗+mesons), GM-VFNS, and the PYTHIA 6.4.21 event generator with the Perugia-0 tune are also shown4. For all these model predictions, D mesons in the rapidity range|y| < 0.5 were considered. In PYTHIA, the default configuration of the Perugia-0 tune for charm hadronization was used.
The D+/D0and D∗+/D0ratios are determined in PYTHIA by an input parameter, PARJ(13), that defines the probability that a charm or heavier meson has spin 1. In the Perugia-0 tune, this parameter is set to 0.54 from the measured fractions Pvof heavy flavour mesons produced in vector state, see e.g. [4,29,61].
This setting results in an enhancement of the D+/D0and a reduction of the D∗+/D0ratios with respect to those obtained with the default value, PARJ(13)=0.75, based on spin counting.
The D+s/D0 and D+
s/D+ ratios in PYTHIA are governed by another input parameter, PARJ(2), that
defines the s/u (s/d) quark suppression factor in the fragmentation process. In the Perugia-0 tune, PARJ(2) is set to 0.2, which gives rise to a reduced abundance of D+s mesons with respect to the default value of 0.3. With this parameter adjustment, PYTHIA with the Perugia-0 tune reproduces reasonably well the value and pT shapes of the measured ratios involving D0, D+and D∗+, while it slightly underestimates
the abundance of D+s mesons. The fact that PYTHIA with Perugia-0 tune underestimates the strangeness production was already observed at the LHC in the light flavour sector [62, 63].
In the Perugia 2011 tune [64], PARJ(13) is set to the same value (0.54) as in the Perugia-0 tune, while a lower value of the strangeness suppression factor, PARJ(2)=0.19, is used. This results in the same values of the Perugia-0 tune for the D+/D0and D∗+/D0ratios, and in slightly lower values for the D+s/D0 and
D+s/D+ratios.
The ratios of the FONLL and GM-VFNS predictions were computed assuming the perturbative uncer-tainty to be fully correlated among the D meson species, i.e. using the same scales for the cross sections at the numerator and at the denominator. Thus, the perturbative uncertainty cancels almost completely in the ratio, as it can be seen in Fig. 4 where, for both FONLL and GM-VFNS, the line shows the result ob-tained from the central values of the theoretical predictions, and the shaded area spans the region between the ratios computed with the upper and lower limits of the theoretical uncertainty band. The predictions from FONLL and GM-VFNS agree within uncertainties with the measured particle ratios. Indeed, in FONLL and GM-VFNS, the relative abundances of the various D meson species are not predicted by the theory: the fragmentation fractions f(c → D) are taken from the experimental measurements. On the other hand, in both the pQCD calculations, the pTdependence of the ratios of the D meson
produc-tion cross secproduc-tions arises from the different fragmentaproduc-tion funcproduc-tions used to model the transfer of energy from the charm quark to a specific D meson species [28, 65, 66] and from the different contribution from decays of higher excited states. The parton fragmentation models used in the calculations provide an adequate description of the measured data. The measured D+s/D0and D+s/D+ratios do not show a signif-icant pT dependence within the experimental uncertainties, thus suggesting a small difference between
the fragmentation functions of c quarks to strange and non-strange mesons. A higher statistics data sam-ple would be needed to conclude on a possible pTdependence of the ratios of strange to non-strange D
meson cross sections.
6.2 pT-integrated D+s cross section and D meson ratios
The visible cross section of prompt D+s mesons, obtained by integrating the pT-differential cross section
in the measured pTrange (2< pT< 12 GeV/c), is
σD+s
vis(2 < pT< 12 GeV/c, |y| < 0.5) = 53 ± 12(stat.)+13−15(syst.) ± 2(lumi.) ± 3(BR)µb.
4 The ratios from the k
T-factorization model of [16] are not shown in Fig. 4. Indeed, in this model the fragmentation
fractions f(c → D) are taken from experimental measurements and the same fragmentation function is used for all D meson
The production cross section per unit of rapidity, dσ/dy, at mid-rapidity was computed by extrapolating
the visible cross section to the full pT range. The extrapolation factor was extracted from the
FONLL-based predictions for the D+s pT-differential cross section described in Section 5. The extrapolation
factor was taken as the ratio between the total D+s production cross section in |y| < 0.5 and the cross section integrated in|y| < 0.5 and in the pTrange where the experimental measurement is performed. In particular, the central value of the extrapolation factor was computed from the prediction based on the
pT-differential cross section of c quarks from FONLL, the fractions f(c → D) from ALEPH [23], and the
fragmentation functions from [57] with r= 0.1. The uncertainty on the extrapolation factor was obtained
as a quadratic sum of the uncertainties from charm mass and perturbative scales, varied in the ranges described above, and from the CTEQ6.6 parton distribution functions [67]. Furthermore, to account for the uncertainty on the D+s fragmentation function, the extrapolation factors and their uncertainties were also computed using the FONLL predictions for D0, D+and D∗+mesons and the envelope of the results was assigned as systematic uncertainty. The resulting value for the extrapolation factor is 2.23+0.71−0.65. The prompt D+s production cross section per unit of rapidity in|y| < 0.5 is then
dσD+s /dy = 118 ± 28(stat.)+28
−34(syst.) ± 4(lumi.) ± 6(BR)+38−35(extr.)µb.
The D meson production ratios were computed from the cross sections per unit of rapidity, dσ/dy.
The corresponding values for D0, D+ and D∗+ from [3] were corrected to account for the updated value of the pp minimum-bias cross section. The systematic uncertainties on the ratios were computed taking into account the correlated and uncorrelated sources as described above. The resulting values are reported in Table 4 and shown in the left-hand panel of Fig. 5 together with the results by other experiments that measured prompt charm production: LHCb [17], e+e−data (taken from the compilation in [68]), and ep data in photoproduction from ZEUS [29] and DIS from H1 [22]. The error bars are the quadratic sum of statistical and systematic uncertainties and do not include the uncertainty on the decay branching ratios, which are common to all experiments. The particle ratios for ZEUS and e+e− were computed from the compilation of fragmentation fractions f(c → D) published in [29] after updating the branching ratios of the considered decay channels to the most recent values [52]. For the ZEUS data, the systematic uncertainties were propagated to the particle ratios by properly taking into account correlated and uncorrelated sources [69]. For the H1 data, the D meson ratios were computed starting from the unconstrained values of f(c → D) published in [22], taking into account the correlated part of the systematic uncertainty and subtracting from the quoted ‘theoretical’ uncertainty the contribution due to the decay branching ratio [70]. Also in this case, a correction was applied to account for the updates in the branching ratios of the considered decay channels. The ALICE results are compatible with the other measurements within uncertainties.
The values predicted by PYTHIA 6.4.21 with the Perugia-0 tune are also shown in the figure, as well as those from a canonical implementation of the Statistical Hadronization Model (SHM) [71]. The values from PYTHIA were obtained by integrating the prompt D meson yields in the range|y| < 0.5 and pT> 0.
The SHM, which computes the hadron abundances assuming that particles originate from a hadron gas in thermodynamical equilibrium, provides a good description of the measured hadron yields in heavy-ion collisheavy-ions at various energies and centralities [72], but it can also be applied to small systems like pp [73, 74] and e+e− [75, 76]. The SHM results used for the present comparison were computed for prompt D mesons, assuming a temperature T of 164 MeV and a volume V of 30±10 fm3at the moment of hadron decoupling. The dependence on temperature of the cross section ratios considered in this analysis is rather small within the few MeV uncertainty on the value of T . To properly reproduce the yield of strange particles in small systems, such as pp and e+e−, an additional parameter, the fugacity [74], is usually introduced in the partition function to account for the deviation of strange particle yields from their chemical equilibrium values. For the SHM predictions reported here, a value of strangeness fugacity of 0.60 ±0.04, extrapolated from the results of a fit to particle yields in pp collisions at√s= 200 GeV [77], was used. With these parameters, the SHM provides a good description of the
Table 4: Ratios of the measured production cross section for prompt D mesons in pT> 0 and |y| < 0.5 in pp collisions at√s= 7 TeV.
Ratio± (stat.) ± (syst.) ± (BR) D+/D0 0.48 ± 0.07 ± 0.11 ± 0.01 D∗+/D0 0.48 ± 0.07 ± 0.08 ± 0.01 D+s/D0 0.23 ± 0.06 ± 0.08 ± 0.01 D+s/D+ 0.48 ± 0.13 ± 0.17 ± 0.03 0 D + D 0 D *+ D 0 D + s D + D + s D Ratio 0 0.2 0.4 0.6 0.8 1 1.2 1.4 SHM PYTHIA6, Perugia-0 >0 T |y|<0.5, p >0, |y|<0.5 T ALICE, p >0, 2<y<4.5 T LHCb Prelim., p >0 T , p -e + e >3.8 GeV/c mid-y T ZEUS, p >2.5 GeV/c, mid-y T H1, p s γ 0 0.1 0.2 0.3 0.4 0.5 0.6 0.7 -e + Combined e H1 (DIS) p) γ ZEUS ( ATLAS (prelim) ALICE >0 T p >0 T p >3.8 GeV/c T p >2.5 GeV/c T p >0 T p SHM PYTHIA6, Perugia-0 >0 T |y|<0.5, p
Figure 5: Left: pTintegrated ratios of D meson production cross sections compared with other experiments [17, 22, 29, 68]. Error bars are the quadratic sum of statistical and systematic uncertainties, without including the uncertainty on the BR which is common to all experiments. Right: strangeness suppression factorγscompared to measurements by other experiments [18, 22, 29, 68]. Predictions from PYTHIA 6.4.21 with the Perugia-0 tune and from a canonical implementation of the statistical hadronization model (SHM) [71] are also shown. The gray band represents the uncertainty on the SHM predictions due to the uncertainty on the volume and on the strangeness fugacity (see text for details).
measured ratios of D meson cross sections.
The strangeness suppression factor for charm mesons,γs, was also evaluated. It is defined as the ratio of
the production cross sections of charm-strange mesons (c¯s) to that of non-strange charm mesons (average of c¯d and c¯u)5. Since all D∗+and D∗0mesons decay into either a D0or a D+, and all D∗+s decays produce a D+s meson [52], the strangeness suppression factor was computed as
γs=
2 dσ(D+ s)/dy
dσ(D0)/dy + dσ(D+)/dy. (2)
The contribution to D0and D+yield from decays of excited charm-strange mesons heavier than D∗+s was neglected.
The resulting value ofγs, computed from the D+s, D0and D+cross sections per unit of rapidity (dσ/dy),
is
γs= 0.31 ± 0.08(stat.) ± 0.10(syst.) ± 0.02(BR).
5The same symbolγ
sis used in the statistical hadronization model to indicate the fugacity, which, as mentioned above, is
usually included in the partition function to account for strangeness suppression. However, the twoγsare different. Indeed, in
the statistical hadronization model, the value of the ratio between strange and non-strange charm mesons is proportional to the fugacity, but not equal to it, due to the different masses of the various D meson species.
Charm-strange meson production is suppressed by a factor≈ 3.3 in the fragmentation of charm quarks. In the right-hand panel of Fig. 5, this result is compared with theγsmeasurements by other experiments,
taken from the compilation in [21], after updating the branching ratios of the considered decay channels to the values in [52]. The preliminary measurement by ATLAS [18] in pp collisions at the LHC, obtained using an equivalent (under the hypothesis of isospin symmetry between u and d quarks) definition of the strangeness suppression factor based on the cross sections of D+s, D+ and D∗+in charm hadronization, is also shown. The error bars are the quadratic sum of statistical and systematic uncertainties and do not include the uncertainty on the decay BR. The values from PYTHIA with the Perugia-0 tune, where γscorresponds to PARJ(2), and the statistical hadronization model described above are also shown for
reference. It is also interesting to note that a similar amount of strangeness suppression was reported for beauty mesons by the LHCb Collaboration that measured the ratio of strange B mesons to light neutral B mesons, fs/ fd, obtaining the value 0.267+0.021−0.020[78].
All theγsmeasurements, performed in different colliding systems and at different centre-of-mass
ener-gies are compatible within experimental uncertainties. The current ALICE and ATLAS results at LHC energy in the central rapidity region do not allow one to conclude on a possible lifting of strangeness suppression with increasing collision energy. Furthermore, the D+s/D0 (D+s/D+) ratios are measured at the LHC both at midrapidity and at forward rapidity, thus allowing to study a possible rapidity depen-dence of the strangeness suppression in charm hadronization. From the comparison of the ALICE and LHCb results with the current experimental uncertainties (left-hand panel of Fig. 5), it is not possible to draw a firm conclusion on this point.
7 Summary
The inclusive production cross section for prompt D+s meson has been measured in the transverse momentum range 2< pT < 12 GeV/c at central rapidity in pp collisions at√s = 7 TeV. D+s mesons
were reconstructed in the hadronic decay channel D+s →φπ+ withφ→ K−K+, and charge conjugates, using the ALICE detector. The measured differential cross section is described within uncertainties by the prediction from the GM-VFNS calculation, which is based on perturbative QCD at NLO with the collinear factorization approach, and it is compatible with the upper side of the uncertainty band of calculations based on the kT-factorization approach at LO. The relative D meson production yields and
the strangeness suppression factor, γs= 0.31 ± 0.08(stat.) ± 0.10(syst.) ± 0.02(BR), agree within
the present experimental uncertainties with those measured by other experiments for different centre-of-mass energies and colliding systems. More precise measurements are needed to address the possible energy and rapidity dependence of strangeness suppression in charm hadronization.
Acknowledgements
The ALICE collaboration would like to thank all its engineers and technicians for their invaluable con-tributions to the construction of the experiment and the CERN accelerator teams for the outstanding performance of the LHC complex. The ALICE Collaboration would like to thank M. Cacciari and H. Spiesberger for providing pQCD predictions that are used for the feed-down correction and for com-parison to the measured data. The ALICE Collaboration would like to thank R. Maciula and A. Szczurek for providing the predictions based on the kT-factorization approach. The ALICE Collaboration would
like to thank the Zeus and H1 collaborations, and in particular L. Gladilin and K. Krueger, for providing updated values of the branching fractions and D meson ratios.
The ALICE collaboration acknowledges the following funding agencies for their support in building and running the ALICE detector:
Calouste Gulbenkian Foundation from Lisbon and Swiss Fonds Kidagan, Armenia;
Projetos (FINEP), Fundac¸˜ao de Amparo `a Pesquisa do Estado de S˜ao Paulo (FAPESP);
National Natural Science Foundation of China (NSFC), the Chinese Ministry of Education (CMOE) and the Ministry of Science and Technology of China (MSTC);
Ministry of Education and Youth of the Czech Republic;
Danish Natural Science Research Council, the Carlsberg Foundation and the Danish National Research Foundation;
The European Research Council under the European Community’s Seventh Framework Programme; Helsinki Institute of Physics and the Academy of Finland;
French CNRS-IN2P3, the ‘Region Pays de Loire’, ‘Region Alsace’, ‘Region Auvergne’ and CEA, France;
German BMBF and the Helmholtz Association;
General Secretariat for Research and Technology, Ministry of Development, Greece; Hungarian OTKA and National Office for Research and Technology (NKTH);
Department of Atomic Energy and Department of Science and Technology of the Government of India; Istituto Nazionale di Fisica Nucleare (INFN) of Italy;
MEXT Grant-in-Aid for Specially Promoted Research, Japan; Joint Institute for Nuclear Research, Dubna;
National Research Foundation of Korea (NRF);
CONACYT, DGAPA, M´exico, ALFA-EC and the HELEN Program (High-Energy physics Latin-American– European Network);
Stichting voor Fundamenteel Onderzoek der Materie (FOM) and the Nederlandse Organisatie voor Wetenschappelijk Onderzoek (NWO), Netherlands;
Research Council of Norway (NFR);
Polish Ministry of Science and Higher Education;
National Authority for Scientific Research NASR (Autoritatea Nat¸ional˘a pentru Cercetare S¸tiint¸ific˘a -ANCS);
Federal Agency of Science of the Ministry of Education and Science of Russian Federation, International Science and Technology Center, Russian Academy of Sciences, Russian Federal Agency of Atomic En-ergy, Russian Federal Agency for Science and Innovations and CERN-INTAS;
Ministry of Education of Slovakia;
Department of Science and Technology, South Africa;
CIEMAT, EELA, Ministerio de Educaci´on y Ciencia of Spain, Xunta de Galicia (Conseller´ıa de Edu-caci´on), CEADEN, Cubaenerg´ıa, Cuba, and IAEA (International Atomic Energy Agency);
Swedish Research Council (VR) and Knut & Alice Wallenberg Foundation (KAW); Ukraine Ministry of Education and Science;
United Kingdom Science and Technology Facilities Council (STFC);
The United States Department of Energy, the United States National Science Foundation, the State of Texas, and the State of Ohio.
References
[1] M. Cacciari, M. Greco and P. Nason, JHEP 05 (1998) 007; M. Cacciari, S. Frixione and P. Nason, JHEP 03 (2001) 006. [2] B. A. Kniehl et al., Phys. Rev. D 77 (2008) 014011;
B. A. Kniehl et al., Phys. Rev. Lett. 96 (2006) 012001. [3] B. Abelev et al. [ALICE Collaboration], JHEP 01 (2012) 128. [4] B. I. Abelev et al. [ALICE Collaboration], JHEP 07 (2012) 191.
[5] M. Cacciari, S. Frixione, N. Houdeau, M. L. Mangano, P. Nason and G. Ridolfi, CERN-PH-TH/2011-227, arXiv:1205.6344 [hep-ph].
[6] B. A. Kniehl, G. Kramer, I. Schienbein and H. Spiesberger, Eur. Phys. J. C 72 (2012) 2082, DESY 12-013, MZ-TH/12-07, LPSC 12019, arXiv:1202.0439 [hep-ph].
[7] D. Acosta et al. [CDF II Collaboration], Phys. Rev. Lett. 91 (2003) 241804. [8] M. Cacciari and P. Nason, JHEP 09 (2003) 006.
[9] A. Adare et al. [PHENIX Collaboration], Phys. Rev. Lett. 97 (2006) 252002. [10] B. I. Abelev et al. [STAR Collaboration], Phys. Rev. Lett. 98 (2007) 192301. [11] S. Catani, M. Ciafaloni and F. Hautmann, Nucl. Phys. B 366 (1991) 135. [12] J. C. Collins and R. K. Ellis, Nucl. Phys. B 360 (1991) 3.
[13] J. R. Andersen et al. [Small x Collaboration], Eur. Phys. J. C 48 (2006) 53. [14] M. Luszczak, R. Maciula and A. Szczurek, Phys. Rev. D 79 (2009) 034009. [15] R. Maciula, M. Luszczak and A. Szczurek, arXiv:1207.6533 [hep-ph]. [16] R. Maciula, M. Luszczak and A. Szczurek, arXiv:1208.6126 [hep-ph]. [17] LHCb Collaboration, LHCb-CONF-2010-013 (2010).
[18] ATLAS Collaboration, ATLAS-CONF-2011-017 (2011).
[19] R. Aaij et al. [LHCb Collaboration], Phys. Lett. B 713 (2012) 186.
[20] E. Norrbin and T. Sjostrand, Eur. Phys. J. C 17 (2000) 137 [hep-ph/0005110]. [21] S. Chekanov et al. [ZEUS Collaboration], JHEP 07 (2007) 074.
[22] A. Aktas et al. [H1 Collaboration], Eur. Phys. J. C 38 (2005) 447. [23] R. Barate et al. [ALEPH Collaboration], Eur. Phys. J. C 16 (2000) 597. [24] P. Abreu et al. [DELPHI Collaboration], Eur. Phys. J. C 12 (2000) 209. [25] G. Alexander et al. [OPAL Collaboration], Z. Phys. C 72 (1996) 1.
[26] D. Bortoletto et al. [CLEO Collaboration], Phys. Rev. D 37 (1988) 1719; [Erratum-ibid. D 39 (1989) 1471];
R. A. Briere et al. [CLEO Collaboration], Phys. Rev. D 62 (2000) 072003; M. Artuso et al. [CLEO Collaboration], Phys. Rev. D 70 (2004) 112001. [27] H. Albrecht et al. [ARGUS Collaboration], Z. Phys. C 52 (1991) 353;
H. Albrecht et al. [ARGUS Collaboration], Z. Phys. C 54 (1992) 1. [28] B. A. Kniehl and G. Kramer, Phys. Rev. D 74 (2006) 037502.
[29] S. Chekanov et al. [ZEUS Collaboration], Eur. Phys. J. C 44 (2005) 351.
[30] E. V. Shuryak, Phys. Rept. 61 (1980) 71; F. Karsch, J. Phys. Conf. Ser. 46 (2006) 122; R. Stock, In *Landolt-Boernstein I 21A: Elementary particles* 7, arXiv:0807.1610 [nucl-ex].
[31] Y. L. Dokshitzer, D. E. Kharzeev, Phys. Lett. B 519 (2001) 199.
[32] N. Armesto, A. Dainese, C. A. Salgado and U. A. Wiedemann, Phys. Rev. D 71 (2005) 054027. [33] B. Abelev et al. [ALICE Collaboration], JHEP 09 (2012) 112.
[34] F. Antinori et al. [NA57 Collaboration], J. Phys. G 32 (2006) 427.
[35] B. I. Abelev et al. [STAR Collaboration], Phys. Rev. C 79 (2009) 034909. [36] G. Agakishiev et al. [STAR Collaboration], Phys. Rev. Lett. 108 (2012) 072301. [37] B. Hippolyte [for the ALICE Collaboration], arXiv:1112.5803 [nucl-ex]. [38] I. Kuznetsova and J. Rafelski, Eur. Phys. J. C 51 (2007) 113.
[39] M. He, R. J. Fries and R. Rapp, arXiv:1204.4442 [nucl-th].
[40] A. Andronic, P. Braun-Munzinger, K. Redlich and J. Stachel, Phys. Lett. B 571 (2003) 36. [41] J. Adams et al. [STAR Collaboration], Phys. Rev. Lett. 95 (2005) 122301.
[42] J. Adams et al. [STAR Collaboration], Phys. Rev. Lett. 92 (2004) 52302. [43] S. S. Adler et al. [PHENIX Collaboration], Phys. Rev. C 69 (2004) 034909.