HAL Id: hal-02951568
https://hal.inrae.fr/hal-02951568
Submitted on 2 Oct 2020HAL is a multi-disciplinary open access archive for the deposit and dissemination of sci-entific research documents, whether they are pub-lished or not. The documents may come from teaching and research institutions in France or abroad, or from public or private research centers.
L’archive ouverte pluridisciplinaire HAL, est destinée au dépôt et à la diffusion de documents scientifiques de niveau recherche, publiés ou non, émanant des établissements d’enseignement et de recherche français ou étrangers, des laboratoires publics ou privés.
Distributed under a Creative Commons Attribution - NonCommercial - NoDerivatives| 4.0 International License
services governance
Améline Vallet, Bruno Locatelli, Cécile Barnaud, David Makowski, Yésica
Quispe Conde, Harold Levrel
To cite this version:
Améline Vallet, Bruno Locatelli, Cécile Barnaud, David Makowski, Yésica Quispe Conde, et al.. Power asymmetries in social networks of ecosystem services governance. Environmental Science and Policy, Elsevier, 2020, 114, pp.329-340. �10.1016/j.envsci.2020.08.020�. �hal-02951568�
Except where otherwise noted, this work is licensed under
https://creativecommons.org/licenses/by-nc-nd/4.0/
Power asymmetries in social networks of
ecosystem services governance
Améline Vallet
a,b, Bruno Locatelli
c,d, Cécile Barnaud
e, David Makowski
f,b,
Yésica Quispe Conde
g, Harold Levrel
ba Université Paris-Saclay, CNRS, AgroParisTech, Ecologie Systématique et Evolution, 91405, Orsay, France
b Université Paris-Saclay, AgroParisTech, CNRS, Ecole des Ponts ParisTech, Cirad, EHESS, UMR CIRED, 94130, Nogent-sur-Marne, France
c Forests and Societies, University of Montpellier, Montpellier, France d CIFOR, Lima, Peru
e DYNAFOR, Université de Toulouse, INPT, INRA, Toulouse, France
f INRAE, UMR 211 Agronomie INRAE AgroParisTech Université Paris-Saclay, F-78850 Thiverval-Grignon, France
g SUNASS Apurimac, Abancay, Apurimac, Peru
Corresponding author: Améline Vallet ([email protected]) Manuscript published in Environmental Science & Policy:
Vallet, A., Locatelli, B., Barnaud, C., Makowski, D., Conde, Y. Q., & Levrel, H. (2020). Power asymmetries in social networks of ecosystem services governance. Environmental Science & Policy,
114, 329-340. https://doi.org/10.1016/j.envsci.2020.08.020
Received 28 May 2020, Revised 25 July 2020, Accepted 28 August 2020, Available online 13 September 2020.
Highlights
Ecosystem services governance is shaped by power asymmetries.
There is a need for novel approaches that unravel the nature and intensity of power asymmetries.
Social network analysis can be used to investigate the different forms of power handled by actors.
Abstract
Power asymmetries affect the governance of natural resources but are rarely considered explicitly in ecosystem services research, which often overlooks the diversity of actors and their interactions. In this paper, we propose an innovative and easily replicable method to analyze two types of power asymmetries, using social network analysis and a power typology which distinguishes between influence and domination. We apply this method to a network of actors involved in the governance of eight ecosystem services in the Peruvian Andes. The results reveal substantial power asymmetries, of different types. Indirect managers of ecosystem services had higher influence and domination than the direct managers and beneficiaries. Businesses showed significantly lower influence than members of civil society, non-governmental organizations, and the public sector (state or decentralized organizations, public enterprises). Compared to other actors, members of the public sector had significantly higher domination, especially national actors. Domination and influence relationships strongly increased conflict probability, along with difference of domination score between two actors. A better interdisciplinary understanding of the determinants of power asymmetries can make the governance of socio-ecological systems more sustainable.
Keywords
1. Introduction
Ecosystems and the benefits they provide to society – also called nature’s contributions to people or Ecosystem Services (ES) – are managed by diverse actors with often diverging interests. The governance of ES can be defined as the body of rules, enforcement mechanisms and interactive processes that enable decision making about ES (Fischer et al., 2007). It encompasses the enforcement and legitimation of institutions - the formal (e.g. legislation) or informal (e.g. code of conduct, oral tradition) rules that guide human behavior and regulate social life (Paavola and Adger, 2005; Vatn, 2005).
Power asymmetries shape the governance of ES because they influence how actors can access, use and benefit from ES (Chaudhary et al., 2018; Daw et al., 2011) or to which extent they can participate in the production and management of ES (Berbés-Blázquez et al., 2016; Bodin et al., 2019; Felipe-Lucia et al., 2015). ES governance can in turn reinforce or reduce power relationships, as it can favor the interests of existing elites while further marginalizing vulnerable people (Fabinyi et al., 2014; Mann et al., 2015). Power asymmetries also play a key role in the way conflicts arise, evolve and are solved (Berbés-Blázquez et al., 2016; Castro and Nielsen, 2003). In addition, they can cause mistrust in institutions, and can erode the resilience of a social-ecological system (Olsson et al., 2004).
We need to better understand how power operates in ES governance in order to steer transformations towards environmental sustainability and social justice (Mastrángelo et al., 2019). For example, information on power asymmetries can shed light on barriers to transformation resulting from dominant position abuses, conflicts of interests, or inconsistent law enforcement by powerful actors (Morrison et al., 2017). Knowledge on power asymmetries can also highlight leverage points to facilitate collective action, for example by identifying key actors in sustainability transformations or empowering marginalized actors.
Power asymmetries have, however, rarely been considered explicitly in existing studies on ES governance. Conceptual frameworks have been proposed in the literature (Berbés-Blázquez et al., 2016; Felipe-Lucia et al., 2015; Fisher et al., 2014), but empirical studies remain scarce and are mostly limited to power asymmetries in the context of payments for ES (Ishihara et al., 2017; Pascual et al., 2014; Vatn, 2010) and climate change mitigation projects (Gallemore et al., 2015).
Despite an emerging literature on the social dimensions of ES, more research is needed on power relationships between actors with different roles and multiple interactions across levels (Martín-López et al., 2019). More specifically, it is important to analyze who exercises power over whom in the governance of ES, to determine the origin of this power, and to understand how it is exercised in practice (Barnaud et al., 2018; Mann et al., 2015). Methods originally developed in sociology and political science - such as Social Network Analysis (SNA) - can be adapted to assess the nature and intensity of power asymmetries in ES governance (Berbés-Blázquez et al., 2016; Fabinyi et al., 2014). Applications of SNA to ES governance are limited (but see Alonso Roldán et al. (2015); Bodin and Crona (2008); Cohen et al. (2012)) and, when existing, they rarely focus on power asymmetries (but see Crona and Bodin (2010); Ernstson et al. (2008); Morrison et al. (2017)).
The objectives of this paper are twofold. First, we explore the potential of SNA to conceptualize and quantify power asymmetries in ES governance. We propose an innovative and easily replicable method to analyze two types of power asymmetries. It relies on David Knoke’s structural power typology, which distinguishes between two forms of power, namely influence and domination (Knoke, 1990). Second, we apply this method to analyze power asymmetries in a case study in Peru. Using data from interviews and workshops, we build several networks to represent how people interact and who exerts power over whom in ES governance. Compared to existing literature, our work innovates by considering different forms of power (influence and domination), different types of power asymmetries, and multiple types of relationships between actors informing about power in the governance of several ES.
2. Conceptualizing power asymmetries with SNA
Social sciences have a long tradition of studying power in human structures, with numerous definitions and conceptualizations. Power is usually described either as the capacity to act or accomplish something (i.e. “power to”) (Arendt, 1970, p. 44; Barnes, 1988; Parsons, 1964), or as the capacity to enforce one’s own intentions over those of others (i.e. “power over”), which thus requires the existence of a social interaction between two or more social actors (individuals, groups, governments, offices, or any other human group) (Dahl, 1957; French and Raven, 1959; Weber, 1978; Wrong, 1979). “Power over” is sometimes further differentiated into four dimensions: visible, hidden, invisible and unconscious power (Gaventa, 2006; Partzsch, 2017). Others types of capacities also include “power with” (the capacity to create synergies between actors through collaboration or collective action, to build bridges across different interests) and “power within” (the capacity to gain sense of self-worth or self-knowledge, confidence, or awareness, all being preconditions for action) (Gaventa, 2006; Morrison et al., 2019; Partzsch, 2017).
Some recent theoretical developments have integrated power and institutional analysis in environmental governance (Avelino, 2017; Bennett et al., 2018; Partzsch, 2017). For example, a polycentric power typology distinguishes between power by design (decision making and resource distribution), pragmatic power (rule interpretation and implementation) and framing power (issue framing, norm setting) (Morrison et al., 2019, 2017). Following Morrison et al. (2019), we define power as “the capacity to influence the goals, process, and outcomes” of environmental governance. We focus on the relational dimension of power in the governance of ES (“power over”), simply called “power” hereafter.
Many typologies have been proposed to classify power different modes of exercise (Goldhamer and Shils, 1939; Wartenberg, 1988; Wrong, 1979) - also called power bases (Burt, 1977; French and Raven, 1959) (Table 1). We selected Knoke’s, based on domination and influence (Knoke, 1990), because it was designed for SNA and has been already applied to study power or conflict in environmental governance (Fischer, 2010; McDaniel and Miskel, 2002; Park et al., 2010). In contrast with domination, influence does not engender resistance since it occurs through the subjective acceptance of the influenced actor processing new information. As these forms of power are often interwoven with one another (Wartenberg, 1988; Wrong, 1979), Knoke identified four stakeholder types depending on the combined levels of influence and domination: coercive power (domination exclusively), persuasive power (influence exclusively), authoritative power (both influence and domination), as well as egalitarian power (which is not a form of power per se since it corresponds to weak domination and influence).
Social Network Analysis (SNA) has often been used to assess power distribution empirically in organizations (Brass, 1984; Burt, 1977; Cook et al., 1983; Ibarra and Andrews, 1993). Power relations originate from and create complex social structures and interdependencies among actors, which can be analyzed and represented graphically with SNA. In terms of power theories, SNA approaches adopt a structural perspective, with individual power relating to actors’ positions in networks (Brass, 1984; Knoke, 1990). For example, actors in the core of communication or knowledge-sharing networks are better positioned to influence others (Degenne and Forsé, 1999; Shaw, 1964).
Table 1: Modes of exercise of “power over” identified in the literature. Modes of exercise Definition Examples of mechanisms Examples of actors References
Domination: offer or withhold benefits or harms
Reward Capacity to administer positive valences or to decrease negative ones in order to change ones’ behavior. It requires the receiver to perceive and give importance to the reward. Result-based bonus, conditional subventions Companies, Payment for Environmental Service bodies (French and Raven, 1959)
Force Physical ability of an actor to keep another from doing what he would prefer to do. It can ultimately result in violence.
Repression Army (Bachrach and Baratz, 1962; Goldhamer and Shils, 1939; Parsons, 1963a; Wartenberg, 1988; Wrong, 1979) Coercion Non-legitimate capacity to achieve
one’s ends in the face of resistance (command, rule, request, etc.). Macht in Weber’s theory of power.
Sanction Tyrant, dictator (Bachrach and Baratz, 1962; French and Raven, 1959; Goldhamer and Shils, 1939; Jenkins, 2009; Parsons, 1963a; Weber, 1978) Authority Legitimate capacity to get others to
obey. Herrschaft in Weber’s theory of power. Tradition, charisma, legal rationality Village heads, religious leaders (Bachrach and Baratz, 1962; French and Raven, 1959; Goldhamer and Shils, 1939; Jenkins, 2009; Parsons, 1963a; Weber, 1978)
Influence: provide information in order to change an actor’s attitude, behavior and opinion
Persuasion Presentation of arguments, appeals or exhortations by one actor to another, which changes their behavior in light of their own values and preferences. Communication Media (newspapers, television) (Parsons, 1963a, 1963b; Wrong, 1979)
Manipulation Influence of one actor on another in order to conceal the grounds for their own action.
Political propaganda, commercial advertising
Lobbies (Bachrach and Baratz, 1962; Parsons, 1963a; Wartenberg, 1988; Wrong, 1979) Reference Attractiveness of an actor, whom
another actor identifies themselves with and desires being closely associated to.
Artist promotion Celebrities, social-media influencers
(French and Raven, 1959)
Expert Special knowledge or expertise of an actor that can influence the behavior of another actor.
Scientific and technical advisory
Doctors (Callon et al., 2001; French and Raven, 1959; Roqueplo, 1997)
Power asymmetries (also called power inequities or power imbalances) refer to the uneven distribution of the multiple modes of exercising power among actors (Morrison et al., 2017). In this paper, we consider power asymmetries within forms of power and between them (Table 2). Asymmetries within one form refer to the fact that some actors have more influence or domination than others, whereas asymmetries between different forms refer to the mismatch between actor’s influence and domination levels (the most influential actors are not the most dominant and vice-versa). These two types of asymmetries have positive and negative impacts on ES governance (Table 2).
Table 2: Two types of power asymmetries considered in the study and their impact on ES governance.
Asymmetry within one form of power Asymmetry between different forms of power
Influence Domination Graphical
representation
Definition Some actors are more
influential than others (here, A)
Some actors are more
dominant than others (here, C)
The most influential actors (A) are not the most dominant (C) and vice-versa
Positive impacts on ES governance
Efficient information sharing (if A is doing its job) (Bodin, 2017; Guerrero et al., 2020)
Contribution to
sustainability (if A shares information that helps sustainability actions) (Fischer, 2014)
Efficient coordination (if A is doing its job) (Bodin, 2017; Guerrero et al., 2020)
Contribution to
sustainability (if A pushes for sustainability actions) (Fischer, 2014)
Limited risk of abuse by an authoritarian actor
concentrating influence and domination powers, existence of countervailing power (e.g., A abuses can be denounced by C, acting as a whistle blower) (Crona and Bodin, 2010; Fung et al., 2003)
Efficiency from distributed responsibilities and specialization (e.g., A is specialized in information sharing)
Multiple catalysts for changes (A can stimulate change and challenge inertia of C or vice-versa) (Crona and Bodin, 2010) Negative
impacts on ES governance
Power concentration without countervailing power, which can lead to manipulation (powerful actor A can filter or distort information) or blockage (powerful actor A can block or restrain information sharing) (Barnes et al., 2016; Crona and Bodin, 2010)
Lack of information diversity (which can limit collective learning)
Power concentration without countervailing power, which can lead to inertia (powerful actor C can voluntarily restrict actions or be inefficient) or abuse of authority (C can act for its own
benefit)(Bodin, 2017; Guerrero et al., 2020)
Lack of diversity in leadership (which can limit innovation)
Risk of disguised
centralized power if A and C are allies (e.g., if C is an authoritarian government and A its press agency)
Risk of blockage or conflicts from power contests if A and C disagree (and A
campaigns against C or C forces A to silence)
3. Material and methods
3.1. Study site
The study was conducted in the Mariño watershed on the eastern slopes of the Peruvian Andes (Apurimac region). It includes two urban areas (Abancay and Tamburco) that host approximately 60,000 inhabitants (INEI, 2007). Rural areas are dominated by mixed small-scale family farming (crops and livestock). Natural areas include natural grasslands, scrub or shrub lands, and mountain forests, such as patches of Podocarpus glomeratus (Intimpa), an endangered native species of conifer (IUCN, 2011). The Mariño watershed in the Peruvian Andes faces several environmental issues and conflicts (rapid urbanization, forest harvesting, water scarcity). Instruments for ES governance include a payment for hydrological ES (under design) and a protected area (the Ampay National Sanctuary).
3.2. Overview of the approach
Our method followed three steps recommended for stakeholder analysis (Reed et al., 2009). First, we selected relevant actors and ES during two preliminary workshops. Workshop details (activities and participants) are available in a companion paper (Vallet et al., 2019). Second, we conducted interviews with representatives of each of the selected actors. Finally, we investigated the relationships between actors and highlighted power asymmetries using SNA. The following sections detail each of these three steps. The research protocol was approved by CIFOR’s Research Ethics Committee. Interviewees were presented with the research project and invited to sign a written consent form for their participation.
3.3. Selection of ES and actors
Our analysis focused on 52 actors involved in the governance of eight ES in the Mariño watershed. The ES, selected during a preliminary workshop held in September 2015, were: agricultural production, medicinal plants, water quantity, water quality, mass erosion control, sheet erosion control, global climate regulation, and ecotourism.
Actors within the network boundaries were defined as the user groups who benefit from ES or who affect them, either positively or negatively (Herzog and Ingold, 2019; Reed et al., 2009). In total, 52 actors were selected during a second workshop organized in May 2016, where participants (i.e. representatives of diverse organizations participating in natural resources management) identified the actors involved in ES governance (i.e. those who either benefit from, manage, protect, restore, or degrade the eight ES directly or indirectly, including themselves if relevant). The selected actors included organizations, such as decentralized state bodies, NGOs or local level bureaucrats (such as municipalities), and groups of individuals (farmers, the urban population). We considered a group of individuals as a single actor in the social network analysis (i.e. with only one node representing them), following previous literature (Alonso Roldán et al., 2015; Herzog and Ingold, 2019; Prell et al., 2009). The selected actors were from different scales (local, sub-national, and national or international) and sectors (businesses, civil society, NGOs, and public organizations). The business sector included small entities only (e.g., plant traders or tourist guides), as there was no large company in the area. Actors were also classified according to their roles regarding ES: beneficiaries, direct managers and indirect managers (Barnaud et al., 2018; Vallet et al., 2019). ES beneficiaries were those who received benefits from ecosystems (e.g. through water consumption, ecotourism, or protection from disaster). Direct managers influenced the functioning of ecosystems or the levels of services provided to society, e.g. through ES co-production (Fedele et al., 2017). Indirect managers facilitated or restricted the activities of direct managers, they could also control the ES benefits received by society. Details about the ES, actor selection, and the identification of their roles in relation to ES can be found in the companion paper (Vallet et al., 2019).
3.4. Data collection and analysis
We conducted a total of 65 interviews with representatives of the 52 selected actors (June 2016, refer to SI for the detailed list). For actors corresponding to single entities (for instance one specific public organization, NGO or company), the interviews were conducted with executives or senior managers (for example managing directors). For actors representing a group of individuals (such as farmers, rural population), we conducted the interviews with executives of collective actors representing the interests of this group (such as producer associations, cooperatives or neighborhood associations). Following common practice, we interviewed executives because they had an overall and strategic view of their entity or group (Alonso Roldán et al., 2015). In some cases (e.g, the national protected area service), executives redirected us to a senior manager who has a more precise knowledge of ES management activities conducted by the organization. Interviews were recorded with the interviewees’ consent. At the beginning of the interview, respondents were told that they were expected to represent the position of their institution and not their personal opinions.
For actors representing large or diverse groups of individuals or complex organizations (for example farmers or regional government), we conducted several interviews with different representatives, in order to capture their diverse interactions. When interviews did not bring any additional information, we stopped and merged the data about the group. To aggregate the multiple interviews, we considered that an actor interacted with another if that relation was mentioned in at least one interview (i.e. aggregation by union).
The interviews consisted of two parts. First, a semi-structured discussion led interviewees to describe their activities related to ES, natural resources, and development, including how they benefited and managed the eight ES, and interacted with other actors (Interview guide is provided in SI). Second, the interviewees were presented with a list of the 52 selected actors, and asked to identify with whom they interacted regarding the governance of the selected ES, and to describe how using pre-defined types of interactions (SI Table 2). These were: information sharing (e.g. sending data) and advice (e.g. technical training), which were used for the influence network; supervision (e.g. requesting reports) and restriction (e.g. enforcing law), which were used for the domination network; common projects (e.g. implementation of a scheme of payment for ES), regular professional meetings (frequent interactions, for example once a week), irregular professional meetings (infrequent interactions, a couple of times a year), and business (e.g. selling or buying products), which were used for the cooperation network; and conflicts (this sensitive information was collected at the end, asking the interviewees who they had tense relationships with, and why). We had to keep the number of interactions short due to interviews time constraints.
These interactions were selected from the literature and for their relevance to the local context. For influence and domination, the relationships elicited directly relate to power modes of exercise identified in the literature and reviewed in the previous section (Table 1). Exchange of information and advice are often used to analyze influence in the social networks literature (Crona and Bodin, 2010; Moeliono et al., 2014; Schaerer et al., 2018). These two interactions can refer to any of the modes of exercise listed in Table 1 for influence (i.e. persuasion, manipulation, reference, expert), depending on the intention of the actors involved in the relationship, their mutual trust and the transparency of the relationship (Cialdini, 2012; Dijk, 1985). In comparison, the literature on domination and social network relationships is much more scarce; mainly because force, punishment and coercion were omitted from most of earlier work on power exchange theories (Molm, 1997). Supervision and restriction are often acknowledged as source of authority in (non-network) power studies (Best, 2002; Mitchell and Spady, 1983; Presthus, 1960), including on environmental governance (Ribot, 2003; Sikor and Lund, 2009). They explicitly refer to authority as a mode of exercise of power in Table 1. Collaboration and conflicts are not power-laden networks; they do not refer to Table 1 power modes of exercise.
The second part of the interview was coded into binary matrices of size 52 by 52 (see details in SI). For the two interactions associated with domination (restriction and supervision), we produced a passive and an active matrix, informing on the direction of the relationship.
3.5. Correction of binary matrices
First, we assessed the reciprocity of the reported ties. Reciprocity is the degree to which a relationship is commonly perceived and agreed on by all parties (refer to SI for more information about how reciprocity was computed) (Tichy et al., 1979; Wasserman and Faust, 1994). In other words, when actor x reported a relationship with actor y (e.g. x shares information with y, or x supervises y), we checked whether actor y also reported a corresponding relationship with x, possibly in the opposite direction for directed interactions (e.g. y shares information with x, or y is supervised by x). Reciprocity ranged from 75 % to 97 %, with a mean value of 88 ± 8.5 % (SI Table 3 and 4). The lowest reciprocity was found for infrequent meetings, which might suggest that non-reciprocal ties were due to omission, which is logically more commonplace between people that rarely meet.
For this reason, and since the divergence of perception about relationships is not the focus of our paper, we applied some transformation to the relationships matrices and considered a tie to exist between two actors if it was reported at least by one of them. We finally obtained a set of nine matrices of size 52 by 52 (SI Table 2). The matrices corresponding to influence, cooperation and conflicts ended up being symmetric. The matrices corresponding to domination were combined into asymmetrical matrices that informed on the direction (from the initiator to the receiver) of the tie (SI Table 2).
3.6. Calculation of influence and domination scores
Influence, domination and cooperation matrices were obtained from the sum of their respective binary matrices (SI Table 2). The matrices were then scaled between 0 and 1. We used R software and the
network package to build all the networks (Butts et al., 2018). Influence, cooperation and conflicts
were considered as a non-directional weighted network, while domination was considered as a directional weighted one. It is frequent in the literature on power to consider exchange of information or collaboration as undirected networks, and we followed this general use (Cohen et al., 2012; Crona and Bodin, 2010; Di Gregorio et al., 2019; Moeliono et al., 2014). It could also have been possible to take into account the directionality of the relationships (i.e. who is the sender or receiver of the information), but this would have required to collect the relational information differently during the interviews.
All weights ranged between 0 and 1 since the socio-matrices were previously scaled up. Individual proxies of influence and domination were based on network degree centrality. We considered degree (number of undirected ties) as a proxy of influence, and the difference between outdegree (number of outcoming ties) and indegree (number of incoming ties) as a proxy of domination.
Different network properties can offer insights on power distribution, such as degree (number of ties), closeness (distance to other actors), and betweenness (middleman role) centralities (Brass, 1992; Degenne and Forsé, 1999; Knoke, 1990). However, they give different insights on power: degree characterizes general activity, betweenness measures the control of flows (e.g. information diffusion), and closeness describes independence and control avoidance (Brass, 1992; Degenne and Forsé, 1999; Freeman, 1978). In our study, centrality measures were correlated and similar conclusions were reached using different measures (SI Figs. 1 and 2).
We used the sna package (Butts, 2016) for the extraction of degree centralities, igraph (Csardi and Nepusz, 2006) for the computation of basic characteristics of networks (density, diameter and transitivity), as well as ggnetwork (Briatte, 2016) for the visualization of networks.
3.7. Network statistical analysis
First, we distinguished central from peripheral actors in the influence and domination networks using the UCINET categorical partitioning algorithm, with 100 random starts and 5000 maximum iterations (Borgatti et al., 2002).
Second, we tested how power differed among stakeholder groups using several statistical methods, such as Clopper-Pearson exact confidence intervals for proportions (CPCI) (Clopper and Pearson, 1934) and chi-squared test (based on Pearson statistics) with standardized residual analysis (Agresti, 2007). More precisely, we tested the effect of sector and scale on two categorical network characteristics: (1) the position in the network; and (2) Knoke’s typology of power. We used the same approach to test the effect of actors’ roles (beneficiaries, direct or indirect managers) on the form of power they handled. The CPCI does not rely on a normal approximation, and is able to deal with small sample sizes and with proportions close to 0 and 1. CPCIs were computed with the PropCIs R package (Scherer, 2018). Chi-squared tests were complemented by a Standardized Residual (SR) analysis, which is useful to understand the nature of the associations detected by the test statistic (Agresti, 2007). SR was computed as follows:
𝑆𝑅 = 𝑛𝑖𝑗− 𝜇̂𝑖𝑗
√𝜇̂𝑖𝑗 (1 − 𝑝𝑖+)(1 − 𝑝+𝑗)
with 𝑛𝑖𝑗 the observed frequency, 𝜇̂𝑖𝑗 the expected frequency, 𝑝𝑖+ the marginal proportion of the first
variable, and 𝑝+𝑗 the marginal proportion of the second variable. Contingency tables and SR were
represented as mosaic graphs (Meyer et al., 2006). Blue and red gradients indicate SR with absolute values exceeding critical values (i.e. significant differences at the 99 %, 95 % and 90 % percentiles in the distribution of SR), and highlight a lack of independence between the two variables. Blue boxes indicate positive residuals (i.e. it is more likely to find stakeholders in this category than expected if the variables were independent), and red boxes indicate negative residuals. Boxes with absolute residuals below the critical value of 90 % are white if the chi-squared test based on Pearson statistics is significant, and grey otherwise. The plots were drawn with the vcd package and R software (Friendly, 2017; Meyer et al., 2017; R Core Team, 2018; Zeileis et al., 2007).
We also used Pairwise Student t-test values to determine if the mean values of influence and domination scores for different actors’ groups (such as sector, scale or actors’ roles) were significantly different from each other.
Third, we applied the quadratic assignment procedure (QAP) to explain the existence of influence/ domination relationships and conflicts between stakeholders, using different explanatory variables of individual actors (role in ES governance, sector, and scale) or pairs of actors (e.g. sector similarity or difference of domination) (Hubert and Schultz, 1976; Krackardt, 1987). QAP tests the existence of statistical associations between a dependent matrix and several explanatory matrices using permutations on their rows and columns. The explanatory matrices can either describe relationships between actors (e.g. a covariate of the outcome network), some individual actor attributes (e.g. a categorical or a quantitative attribute such as centrality), or the difference; the match as well as the mismatch between two actors’ attributes (e.g. homophily). The interpretation of QAP results is straightforward, since the outputs are similar to other regressions.
This is one of the major limits of QAP: it basically treats the relational dependencies between actors as a nuisance, and not as an interesting feature to model (Cranmer et al., 2017). Several statistical tools have been proposed in the SNA literature to model network structure and test the effect of endogenous (e.g. reciprocity of ties) or exogenous (e.g. actors’ characteristics) variables (for a review of existing tools and their respective limits refer to: Cranmer et al. (2017) and Snijders (2011)). More advanced tools include latent space models (LSM) and Exponential Random Graph Models (ERGM) (Cranmer et al., 2017; Snijders, 2011). In comparison with QAP, these models consider relational dependencies between actors explicitly, either using endogenous parameters related to the structure of the network in the case of ERGM, or a latent space (such as Euclidean distance). Because of the
high density of the influence and cooperation networks, we faced various degeneracy and collinearity issues when modelling endogenous variables with ERGM. With LSM, we were limited by the correlation between covariate networks and the outcome networks. However, as this paper does not aim at modelling network structure, but rather focuses on the effect of some exogenous covariates, QAP is perfectly adapted (Cranmer et al., 2017).
Weighted influence and domination network were converted into two binary networks before being used in the QAP. The QAP models were fitted using the netlogit function included in the sna package (Butts, 2016), with 200 iterations for quantile estimation. Several explanatory variables were selected following different theoretical mechanisms and variable types (Table 3, SI Table 12). For example, we used the cooperation network as a covariate in the QAP models explaining the existence of influence and domination relationships. Model goodness-of-fit was assessed before analyzing model term significance and effect. The distribution of four characteristics of the modelled networks were plotted against those of observed networks: number of shared partners per edge, path distance, actors’ degree centrality (in and out degrees were differentiated for domination since the network is directed), and k-star (tendency for actors to have multiple partners, as a sender or as a receiver in the case of directed networks). Goodness-of-fit analysis was conducted using the btergm package (Leifeld et al., 2018).
The correlation between the influence and the domination network was computed using the Quadratic Assignment Procedure (QAP) included in the qaptest function of the sna package. All graphs were created with the ggplot2 package (Wickham et al., 2016). R packages were implemented with R version 3.5.3 (R Core Team, 2018).
4. Results
4.1. Networks characteristics
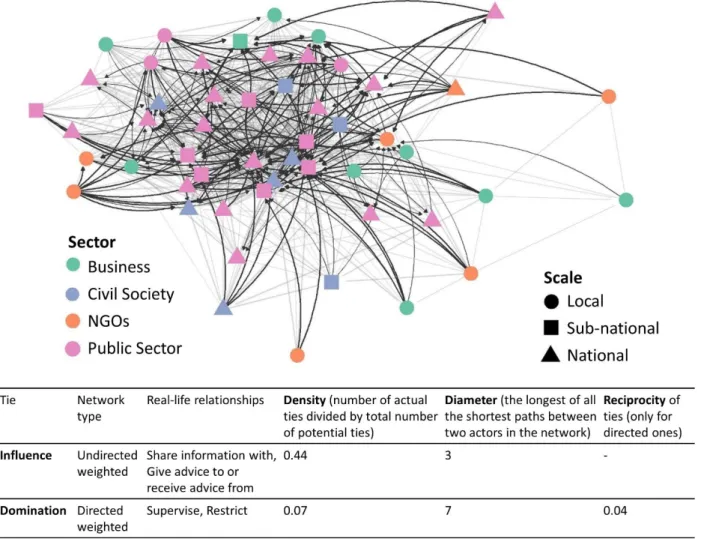
We built a non-directional network for influence (i.e. the two actors interact with each other equally), and a directional network for domination (i.e. one actor is identified as the sender of the relationship and the other as the receiver) (Fig. 1). For example, in the influence network, local NGOs and public institutions (e.g. the national forest and wildlife service) informed rural communities about sustainable management of natural resources, or trained them on agroecology. In the domination network, the national protected area service controlled and sanctioned illegal activities (such as wildfires or deforestation) by people and businesses in the Ampay National Sanctuary.
Figure 1: Non-directional influence (straight light grey ties) and directional domination (curved dark grey ties) networks. The thickness of the ties is proportional to the weight of the relationship (between 0 and 1).
The influence network was much denser than the domination network (i.e. with more ties between actors), which logically led to a shorter diameter in the influence network (i.e. an actor needs to go through fewer intermediary actors to reach anyone in the network). Reciprocity was very low for domination (4%), which shows that an actor dominating another is almost never dominated back by the same actor (Fig. 1). There were significantly more civil society and public sector actors in the core of the influence network and more business actors in the periphery (confidence level of 95 %). The public sector was significantly more present in the core of the domination network, whereas NGOs and national or international actors were more in the periphery (SI Tables 5 and 6, SI Fig. 5).
4.2. Power distribution amongst actors
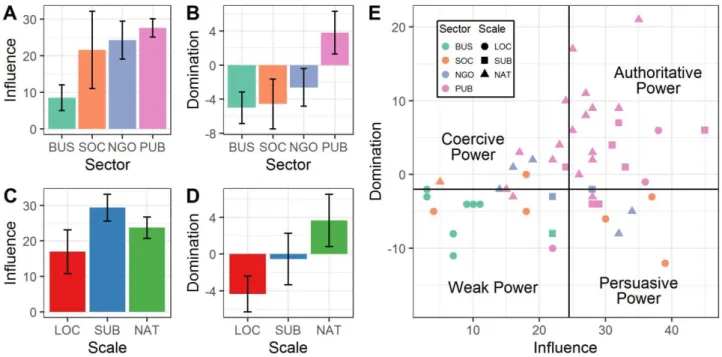
Actors showed varying levels of influence and domination (Fig. 2). Actors with the highest influence were the regional government (office for economic development), the municipalities of Abancay and Tamburco (the two main cities of the area), and the rural population as a whole, because they were all involved in multiple information sharing and advising activities within ES conservation projects. The actors with the lowest influence were emolienteros (herbal beverage vendors), plant traders, transport companies, and ecotourism associations, because they barely engaged in information sharing and advice with other actors. Most dominant actors were environmental enforcement entities (national water authority, national protected area service) and the Peruvian ombudsman (an organization responsible for representing the public interest by investigating and responding to complaints of maladministration or violation of rights by public organizations). Actors with the lowest domination were the rural population, water-related businesses, and the urban drinking water utility, as they are barely entitled to supervise or control others but were often supervised or restricted by others. Figure 2: Panels A-D: Influence and domination depending on actor sector (BUS = Business, SOC = Civil Society, NGO = Non-Governmental Organizations, PUB = Public Sector), and scale (LOC = Local, SUB = Sub-national, NAT = National and International). Individual influence is measured by degree (number of ties) and domination by the difference between outdegree (number of ties to dominated actors) and indegree (number of ties from dominating actors). The proxies varied from 3 to 45 for influence and from -12 to 21 for domination (with mean values of 22.6 and 0 respectively), the maximum theoretically possible being 51 for an actor connected to all others or dominating all others without being dominated. Panel E: Types of power handled according to Knoke’s typology (lines indicate median values on both axes).
Business actors showed significantly lower influence (Pairwise Student t-test p-values < 0.05 hereafter, Fig. 2A), whereas public sector actors had significantly higher domination (Fig. 2B). Scale significantly affected domination, but not influence: actors from higher scales had higher domination levels (Fig. 2C and D).
4.3. Power versus role in ES governance
Influence and domination depended on actors’ roles in ES governance (Fig. 3). For agricultural production, mass erosion, water quality and quantity, ES beneficiaries (such as water users) and ES direct managers (such as farmers) were significantly less dominant than indirect managers (such as the regional government) (Pairwise Student t-test p-value < 0.05, Fig. 3B). This difference was also observed for medicinal plants and global climate regulation at 10 % confidence level (Pairwise Student
t-test p-values < 0.06). ES beneficiaries and direct managers were more likely to be dominated (i.e.
negative domination score), and ES indirect managers to be dominant (i.e. positive domination score). Figure 3: Mean influence (Panel A) and domination (Panel B) scores according to actors’ roles for each ES (B = Beneficiaries, DM = Direct Managers, IM = Indirect Managers). Beneficiaries were those who received benefits from ecosystems, direct managers those who influenced the functioning of ecosystems or the amount of services provided to society, and indirect managers those who facilitated or restricted the activities of direct managers, or controlled ES benefits. Error bars represent confidence interval at 95 % level.
Conversely, we did not observe differences of influence among actors with different roles, except for water quantity, for which direct and indirect managers were significantly more influential than beneficiaries (Pairwise Student t-test p-value < 0.005, Fig. 3A). This can be explained by the importance of water management in the area, and the existence of a participatory scheme of payment for hydrological services ES, in which ES managers are particularly active and involved in information sharing and advice.
The actors managing a higher number of ES were more influential and dominant (Pearson’ coefficient of correlation between the number of managed ES and influence: 𝜌 = 0.52, and domination: 𝜌 = 0.34). Interestingly, the actors benefiting from a large number of ES were less dominant (𝜌 = -0.46).
4.4. Evidence of asymmetries between different forms of powers
The influence and domination networks were poorly correlated (ρ = 0.20, p-value < 0.001), which indicates that an actor can be influential without being dominant, or vice-versa (Fig. 2E). This highlights the existence of asymmetries between different forms of power and justifies our analyses of interwoven powers.
Actors handling authoritative power were significantly less frequent in the business and NGO sectors than in the public sector (detailed CPCI and chi-squared test results in SI). They were also significantly less frequent at the local scale (Fig. 2E). Weak actors were more likely to be from the business sector and the local scale. This may be explained by the limited participation of business actors in participatory committees and management boards; for example, on PES design or integrated watershed management. Low domination of private actors resulted from their limited capacity to supervise and control other actors, while the public sector was entitled to be dominant and influential. The type of power handled by actors also depended on their role in ES governance. For all ES, beneficiaries were less likely to have authoritative power, and more to have weak power, except for agricultural production that did not show significant differences (detailed results in SI). For several ES, authoritative and coercive power was more likely to be handled by indirect managers, and persuasive power by beneficiaries and direct managers. For example, indirect managers of water ES (such as regional government, municipalities, or the national water authority) restricted and supervised other actors, while providing advice and information. In contrast, beneficiaries were not entitled to restrict or support other actors.
4.5. Who exerts power over whom?
The QAP analysis showed that influence or domination relationships depended significantly on the sectors or scale of the actors in the relationship (SI Table 12). Business actors were less likely to influence others, whereas public sector actors were more likely (p-value <0.001). Influence mainly occurred between actors from different scales: two actors from the same level were less likely to influence each other (p-value < 0.1). Domination relationships depended significantly on sectors: business actors were more likely to be dominated, whereas public sector actors were more likely to be dominant (p-values <0.05). Domination relationships were more likely to emanate from actors at a higher scale (e.g. national) and be directed towards actors at a lower scale (e.g. local) than the opposite, which suggests that domination relationships were associated with top-down hierarchy in multi-level governance (p-value < 0.001). Finally, domination relationships were more likely between actors from the same sector than from different sectors (p-value < 0.05).
Two actors were more likely to influence or dominate each other if they were cooperating (p-values < 0.001). More central actors in the cooperation network (i.e. with higher degree centrality) were significantly more involved in domination relationships (p-value < 0.001).
4.6. Links between power and conflicts
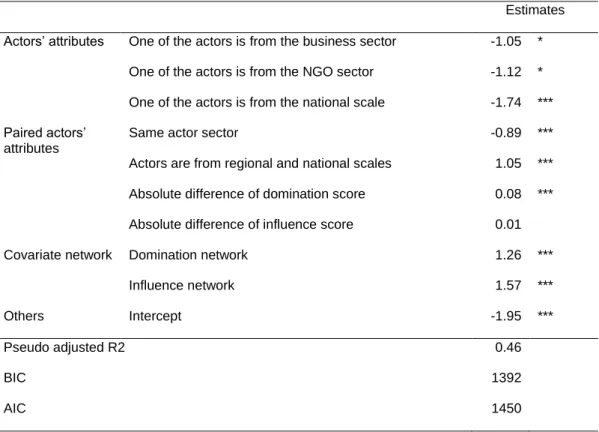
The relational data collected revealed diverse conflicts; for example, between upstream and downstream irrigators for water access, or between the National Protected Area Service and medicinal plant harvesters in the protected area (SI Fig. 4). The QAP analysis showed that both domination and influence relationships strongly increased conflict probability (Table 3, SI Figs. 13 and 14). A high difference of domination score between two actors also significantly increased conflict probability, which means that conflicts often occurred between a dominant actor and a dominated actor. Conflicts were more likely to occur between a national actor and a regional actor, which might suggest conflicting policy preferences regarding ES governance between levels. Finally, conflicts were less frequent between actors from the same sector, which might suggest that conflicts are also partially driven by conflicting policy preferences between sectors.
Table 3: QAP model estimations for conflict prediction. Symbols display each variable significance level: * for p < 0.05; ** for p < 0.01 and *** for p < 0.001.
Estimates Actors’ attributes One of the actors is from the business sector -1.05 *
One of the actors is from the NGO sector -1.12 * One of the actors is from the national scale -1.74 *** Paired actors’
attributes
Same actor sector -0.89 *** Actors are from regional and national scales 1.05 *** Absolute difference of domination score 0.08 *** Absolute difference of influence score 0.01 Covariate network Domination network 1.26 ***
Influence network 1.57 ***
Others Intercept -1.95 ***
Pseudo adjusted R2 0.46
BIC 1392
5. Discussion
5.1. Analyzing power asymmetries with SNA: some limits
Although power asymmetries are frequently recognized as a major challenge to the implementation of sustainable and equitable forms of governance, these are rarely assessed in ES literature. We propose an original and easily replicable approach to highlight different types of power asymmetries in the governance of ES, using tools from social and political sciences (interviews and SNA) and to relate power asymmetries to the existence of conflicts between actors. Our approach is generic and can be easily implemented to analyze power asymmetries and ES governance in different contexts. It supports the view of power as a multifaceted and complex concept, and explicitly addresses two interwoven dimensions of power: influence and domination. We also propose a novel typology that distinguishes between two forms of power asymmetries: within and between power dimensions. In this respect, this study addresses several of the literature gaps identified in the introduction.
Our approach relies on SNA and degree centrality to quantify influence and domination proxies. Among the SNA publications that associate central positions in networks with high levels of power, some called for caution in generalizing this association (Brass, 1992; Degenne and Forsé, 1999; Knoke, 1990). Measures of centrality might not always relate to power; for example, in the case of decentralized or highly clustered networks (which was not the case in our study) (Cook et al., 1983; Degenne and Forsé, 1999). Further research could compare these centrality measures with reputational power, by asking interviewees to indicate the actors that stand out as especially influential in the network (Gallemore et al., 2015; Ingold and Leifeld, 2016; Tichy et al., 1979).
One limit of our approach is that it does not inform on actors’ functional role within the network, such as creating coalitions, representing groups of actors, or connecting separate actors (i.e. brokerage role). Network brokers or entrepreneurs are often considered powerful as they control information or resources (Burt, 1995; Christopoulos and Ingold, 2015; Gould and Fernandez, 1989). Another limit of our approach is that it focuses on visible power (domination and influence). It does not account for more discrete forms of powers, such as interpreting the rules (also called “pragmatic power”) (Morrison et al., 2019) or shaping meanings and sense of self (“invisible power”) (Gaventa, 2006). In our study site, public organizations (for example the national protected area service) have both a “power by design” (to design rules for example) and a “pragmatic power”, but these activities are conducted by different people within the organizations (managers vs. park rangers). Understanding those other forms of power would require to expand the analysis to other key actors (e.g. local level bureaucrats), as well as to analyze how roles and powers are distributed within organizations at an individual level.
5.2. Observed asymmetries and their implications
In this study, we presented empirical evidence of two types of power asymmetries in ES governance: asymmetries within one form of power and between several forms. Regarding the former, we found that the business sector was much less influential than other actors regarding ES governance, while the public sector was more dominant (in particular through environmental enforcement entities). However, the power of the business and public sectors is very context dependent. In our case, the strong power of public organizations might be explained by the proximity to the regional capital (Abancay), whereas the low power of the business sector may come from the small size of local companies. In other regions of the Peruvian Andes, ES management is being influenced by powerful businesses, such as pro-mining lobbies or agribusinesses) (Key and Runsten, 1999; Preciado Jeronimo et al., 2015).
We also observed clear power asymmetries between indirect managers on the one hand, and direct managers and beneficiaries of ES on the other hand, the former having higher influence and domination than the latter. In the context of PES and forest carbon initiatives, other studies showed that ES providers (i.e. direct managers in our study), such as the rural households or local communities that maintain forest cover and protect watersheds, are generally less powerful in
influencing outcomes than intermediaries (i.e. indirect managers in our study), such as governmental organizations that facilitate interactions between actors (Ishihara et al., 2017; Vatn, 2010).
Asymmetries between different power forms correspond to the existence of coercive and persuasive actors and the absence of authoritative actors according to Knoke. It has already been shown that persuasive actors (with high influence and low domination) are crucial to initiate change, challenge governance inertia, and provide countervailing forms of power to top-down bureaucrats (Crona and Bodin, 2010; Fung et al., 2003). In this study, only few actors handled persuasive power, which can limit the transformative capacity of ES governance.
Following other studies, our results showed that power differences result in conflicts when combined with growing demand on finite natural resources and the difficult accommodation of multiple conflicting interests (Buckles and Rusnak, 1999; Ramirez, 2001; Wollenberg et al., 2001). Water management in the Mariño watershed is a good example, as conflicts result from decreasing water availability (induced by reduced rainfall) combined with increasing demands from domestic consumption, irrigation, and industrial uses. More specifically, we showed that conflicts were more likely when actors differ greatly in their domination levels. The same did not apply to influence level. The “virtue” of influence, as a form of power, is that it does not engender resistance and conflicts, in contrast to domination (Wartenberg, 1988). Conflicts are not a systematic consequence of power asymmetries but rather depend on the forms of power handled, the power differentials between stakeholders, the legitimacy of the dominant, as well as the response capacity of the dominated (including in psychological terms) (Barnaud and Van Paassen, 2013; Kabanoff, 1991; Raven, 1993).
5.3. Designing sustainable and equitable ES governance
Information on power asymmetries is useful to develop more sustainable and equitable forms of ES governance. First, it can help public institutions or NGOs design legal and institutional reforms, or rural development and conservation programs. Power asymmetries often prevent programs or policies being properly implemented or bringing expected changes (Boer, 2020; Förster et al., 2017; Gorris, 2019). Power analysis like the one conducted in this study can make these initiatives more effective, and avoid that they reproduce or reinforce pre-existing power relationships or conflicts. For instance, our results identify what actors in the Mariño watershed can promote good ES management practices, share valuable information, or report problems.
Second, knowledge on power asymmetries can be used to identify and empower marginalized actors and increase their influence, through more inclusive governance processes and knowledge systems (Morrison et al., 2017). When direct participation in ES management is not possible, information on power asymmetries can also help design other forms of actors’ involvement, for example through citizen monitoring of budget and policy implementation. In the Mariño watershed, participatory platforms have been created to better engage civil society and the private sector in natural resource management (even though their participation is limited in practice). Including ES beneficiaries and more diverse actors into ES governance can improve the sustainability and equity of ES provision in the face of uncertain and multifaceted global changes (Grêt-Regamey et al., 2019). Further research could focus on the links between power and participatory management, to understand under which conditions the joint management of natural resources can improve power sharing (Olsson et al., 2004).
Power asymmetries also offer opportunities for positive and transformative change (Morrison et al., 2019). They can lead to innovative and negotiated agreements between stakeholders, and the construction of new partnerships and alliances (Ramirez, 2001; Wollenberg et al., 2001). For example, in Costa Rica, the Cahuita National Park shifted from State control to joint management with local communities after a conflict erupted and led to the creation of an ad-hoc committee (Ramírez, 1999). In the Mariño watershed, water management may evolve to more collaborative decision-making if the implementation of a water PES scheme adequately includes local communities, in addition to the drinking water utility and public organizations.
We highlighted the effect of actor characteristics (role in ES governance, sector and scale) in the existence of power asymmetries. But we did not explore the origin and the mechanisms behind. More interdisciplinary research is needed on the effect of other factors related to ES governance, such as institutions (e.g. legal frameworks, political regimes, entitlements), and individual forms of capitals (e.g. financial assets or human skills) (Crona and Bodin, 2010; Fisher et al., 2014; Jenkins, 2009; Leach et al., 1999). Access to and control over ES is often mediated by a set of interacting and overlapping institutions (Leach et al., 1999). More research is needed to understand network formation and power dynamics, and how power may be reinforced by feedback loops (e.g. if power facilitates individual wealth accumulation, which increases power).
Institutions and rules (customary laws, formal regulations) put some actors in powerful positions, and create power asymmetries (Barnaud and Van Paassen, 2013; Leach et al., 1999). For example, public organizations are entitled by law to control and sanction illegal activities and therefore dominate other actors. The key question is not about the existence of such power asymmetries, but rather about the legitimacy of institutions and the processes through which rules are defined. Rules erected by pre-existing elites can be biased and favor powerful actors. Therefore, power asymmetries also play a role in shaping the legitimacy of environmental governance and institutions.
Questions remain about how power should be effectively distributed to allow the sustainable governance of ES and natural resources. Powerful actors can hinder sustainable governance, voluntarily or not (Bodin, 2017; Fischer, 2014). In Kenya, for instance, the unsustainable fishing practices observed in a small-scale fishery could be explained by lack of concern of powerful actors toward fish stock depletion (Crona and Bodin, 2010). The impact of power asymmetries might be tightly related to powerful actor’s determination to implement effective actions and address environmental problems (Bodin, 2017; Crona and Bodin, 2010; Fischer, 2014).
Credit authorship contribution statement
Améline Vallet: Conceptualization, Methodology, Investigation, Formal analysis, Writing - review & editing. Bruno Locatelli: Conceptualization, Methodology, Formal analysis, Writing - review & editing, Funding acquisition. Cécile Barnaud: Writing - review & editing. David Makowski: Formal analysis, Writing - review & editing. Yésica Quispe Conde: Investigation. Harold Levrel: Conceptualization, Writing - review & editing.
Declaration of Competing Interest
The authors report no declarations of interest.
Acknowledgments
The funding partners that have supported this research include the International Climate Initiative (IKI, project 15_III_075) of the German Federal Ministry for the Environment, Nature Conservation, Building and Nuclear Safety (BMUB), the Norwegian Agency for Development Cooperation (agreement QZA-016/0110), the French funding agency for research (project TRASSE ANR-CONACYT-17-CE32-0012), the European Union's H2020 research and innovation program (SINCERE Project), the French Ministry for the Ecological and Inclusive Transition, and the CGIAR Research Program on Forests, Trees and Agroforestry (CRP-FTA) with financial support from the CGIAR Fund. The authors are grateful to Helvetas, the Andean Forest Program, CEDES, and IDMA for their support in organizing the workshops and interviews. The authors thank all interviewees for their time and rich information, and three anonymous reviewers for their useful comments.
References
Agresti, A., 2007. An introduction to categorical data analysis, 2nd ed. ed, Wiley series in probability and mathematical statistics. Wiley-Interscience, Hoboken, NJ.
Alonso Roldán, V., Villasante, S., Outeiro, L., 2015. Linking marine and terrestrial ecosystem services through governance social networks analysis in Central Patagonia (Argentina). Ecosystem Services 16, 390–402. https://doi.org/10.1016/j.ecoser.2015.02.010
Arendt, H., 1970. On Violence. Houghton Mifflin Harcourt.
Avelino, F., 2017. Power in Sustainability Transitions: Analysing power and (dis)empowerment in transformative change towards sustainability: Power in Sustainability Transitions. Env. Pol. Gov. 27, 505–520. https://doi.org/10.1002/eet.1777
Bachrach, P., Baratz, M.S., 1962. Two Faces of Power. The American Political Science Review 56, 947–952. https://doi.org/10.2307/1952796
Barnaud, C., Corbera, E., Muradian, R., Salliou, N., Sirami, C., Vialatte, A., Choisis, J.-P., Dendoncker, N., Mathevet, R., Moreau, C., Reyes-García, V., Boada, M., Deconchat, M., Cibien, C., Garnier, S., Maneja, R., Antona, M., 2018. Ecosystem services, social interdependencies, and collective action: A conceptual framework. Ecology and Society 23. https://doi.org/10.5751/ES-09848-230115
Barnaud, C., Van Paassen, A., 2013. Equity, Power Games, and Legitimacy: Dilemmas of Participatory Natural Resource Management. Ecology and Society 18. https://doi.org/10.5751/ES-05459-180221
Barnes, B., 1988. The Nature of Power. Polity Press.
Barnes, M.L., Lynham, J., Kalberg, K., Leung, P., 2016. Social networks and environmental outcomes. Proc. Natl. Acad. Sci. U.S.A. 113, 6466–6471. https://doi.org/10.1073/pnas.1523245113
Bennett, A., Acton, L., Epstein, G., Gruby, R.L., Nenadovic, M., 2018. Embracing conceptual diversity to integrate power and institutional analysis: Introducing a relational typology. Int J Commons 12, 330. https://doi.org/10.18352/ijc.819
Berbés-Blázquez, M., González, J.A., Pascual, U., 2016. Towards an ecosystem services approach that addresses social power relations. Current Opinion in Environmental Sustainability, Sustainability science 19, 134–143. https://doi.org/10.1016/j.cosust.2016.02.003
Best, S., 2002. Power, Authority and the State, in: Introduction to Politics and Society. SAGE Publications Ltd, London, pp. 6–39. https://doi.org/10.4135/9781446220832
Bodin, Ö., 2017. Collaborative environmental governance: Achieving collective action in social-ecological systems. Science 357, eaan1114. https://doi.org/10.1126/science.aan1114
Bodin, Ö., Alexander, S.M., Baggio, J., Barnes, M.L., Berardo, R., Cumming, G.S., Dee, L.E., Fischer, A.P., Fischer, M., Garcia, M.M., Guerrero, A.M., Hileman, J., Ingold, K., Matous, P., Morrison, T.H., Nohrstedt, D., Pittman, J., Robins, G., Sayles, J.S., 2019. Improving network approaches to the study of complex social– ecological interdependencies. Nat Sustain 2, 551–559. https://doi.org/10.1038/s41893-019-0308-0
Bodin, Ö., Crona, B.I., 2008. Management of Natural Resources at the Community Level: Exploring the Role of Social Capital and Leadership in a Rural Fishing Community. World Development 36, 2763–2779. https://doi.org/10.1016/j.worlddev.2007.12.002
Boer, H.J., 2020. Power, REDD+ and reforming forest governance in Indonesia. Third World Quarterly 41, 783– 800. https://doi.org/10.1080/01436597.2019.1703178
Borgatti, S.P., Everett, M.G., Freeman, L.C., 2002. Ucinet for Windows: Software for Social Network Analysis. Analytic Technologies, Harvard, MA.
Brass, D.J., 1992. Power in Organizations: A Social Network Perspective, in: Moore, G., Whitt, J.A. (Eds.), The Political Consequences of Social Networks, Research in Politics and Society. JAI Press Ins., Greenwich, Conn., pp. 295–323.
Brass, D.J., 1984. Being in the right place: A structural analysis of individual influence in an organization. Administrative Science Quarterly 29, 518–539. https://doi.org/10.2307/2392937
Briatte, F., 2016. ggnetwork: Geometries to Plot Networks with “ggplot2.”
Buckles, D., Rusnak, G., 1999. Introduction. Conflict and collaboration in natural resource management, in: Buckles, D. (Ed.), Cultivating Peace: Conflict and Collaboration in Natural Resource Management. International Development Research Center ; World Bank Institute, Ottawa : Washington, DC, USA.
Burt, R.S., 1995. Structural Holes. Harvard University Press.
Burt, R.S., 1977. Power in a social topology. Social Science Research 6, 1–83. https://doi.org/10.1016/0049-089X(77)90001-1
Butts, C.T., 2016. sna: Tools for Social Network Analysis.
Butts, C.T., Hunter, D., Handcock, M., Bender-deMoll, S., Horner, J., 2018. network: Classes for Relational Data.
Callon, M., Lascoumes, P., Barthe, Y., 2001. Agir dans un monde incertain - Essai sur la démocratie technique. Seuil, Paris.
Castro, A.P., Nielsen, E., 2003. Natural resource conflict management case studies : an analysis of power, participation and protected areas. FAO, Rome, Italy.
Chaudhary, S., McGregor, A., Houston, D., Chettri, N., 2018. Environmental justice and ecosystem services: A disaggregated analysis of community access to forest benefits in Nepal. Ecosystem Services 29, 99–115. https://doi.org/10.1016/j.ecoser.2017.10.020
Christopoulos, D., Ingold, K., 2015. Exceptional or just well connected? Political entrepreneurs and brokers in policy making. European Political Science Review 7, 475–498. https://doi.org/10.1017/S1755773914000277 Cialdini, R.B., 2012. Influence et manipulation. edi8.
Clopper, C.J., Pearson, E.S., 1934. The Use of Confidence or Fiducial Limits Illustrated in the Case of the Binomial. Biometrika 26, 404–413. https://doi.org/10.2307/2331986
Cohen, P.J., Evans, L.S., Mills, M., 2012. Social networks supporting governance of coastal ecosystems in Solomon Islands. Conservation Letters 5, 376–386. https://doi.org/10.1111/j.1755-263X.2012.00255.x Cook, K.S., Emerson, R.M., Gillmore, M.R., Yamagishi, T., 1983. The distribution of power in exchange
networks: Theory and experimental results. American Journal of Sociology 89, 275–305. https://doi.org/10.1086/227866
Cranmer, S.J., Leifeld, P., McClurg, S.D., Rolfe, M., 2017. Navigating the Range of Statistical Tools for
Inferential Network Analysis. American Journal of Political Science 61, 237–251.
https://doi.org/10.1111/ajps.12263
Crona, B., Bodin, Ö., 2010. Power Asymmetries in Small-Scale Fisheries: a Barrier to Governance Transformability? Ecology and Society 15.
Csardi, G., Nepusz, T., 2006. The igraph software package for complex network research. InterJournal 1695. Dahl, R.A., 1957. The concept of power. Syst. Res. 2, 201–215. https://doi.org/10.1002/bs.3830020303 Daw, T., Brown, K., Rosendo, S., Pomeroy, R., 2011. Applying the ecosystem services concept to poverty
alleviation: the need to disaggregate human well-being. Environmental Conservation 38, 370–379. https://doi.org/10.1017/S0376892911000506
Degenne, A., Forsé, M., 1999. Introducing social networks, Introducing statistical methods. SAGE, London ; Thousand Oaks.
Di Gregorio, M., Fatorelli, L., Paavola, J., Locatelli, B., Pramova, E., Nurrochmat, D.R., May, P.H., Brockhaus, M., Sari, I.M., Kusumadewi, S.D., 2019. Multi-level governance and power in climate change policy networks. Global Environmental Change 54, 64–77. https://doi.org/10.1016/j.gloenvcha.2018.10.003
Dijk, T.A. van, 1985. Discourse and Communication: New Approaches to the Analysis of Mass Media Discourse and Communication. Walter de Gruyter.
Ernstson, H., Sörlin, S., Elmqvist, T., 2008. Social movements and ecosystem services-The role of social network structure in protecting and managing urban green areas in Stockholm. Ecology and Society 13, 39. Fabinyi, M., Evans, L., Foale, S., 2014. Social-ecological systems, social diversity, and power: insights from
anthropology and political ecology. Ecology and Society 19. https://doi.org/10.5751/ES-07029-190428 Fedele, G., Locatelli, B., Djoudi, H., 2017. Mechanisms mediating the contribution of ecosystem services to
human well-being and resilience. Ecosystem Services 28, 43–54.
https://doi.org/10.1016/j.ecoser.2017.09.011
Felipe-Lucia, M.R., Martín-López, B., Lavorel, S., Berraquero-Díaz, L., Escalera-Reyes, J., Comín, F.A., 2015. Ecosystem services flows: Why stakeholders’ power relationships matter. PLoS ONE 10, e0132232. https://doi.org/10.1371/journal.pone.0132232
Fischer, A., Petersen, L., Feldkötter, C., Huppert, W., 2007. Sustainable governance of natural resources and
institutional change–an analytical framework. Public Admin. Dev. 27, 123–137.
https://doi.org/10.1002/pad.442
Fischer, M., 2014. Coalition Structures and Policy Change in a Consensus Democracy. Policy Studies Journal 42, 344–366. https://doi.org/10.1111/psj.12064
Fischer, M., 2010. Explaining decision-making structures in Swiss politics: A combination of SNA and QCA. 2010.