HAL Id: hal-00641286
https://hal.archives-ouvertes.fr/hal-00641286
Submitted on 15 Nov 2011HAL is a multi-disciplinary open access archive for the deposit and dissemination of sci-entific research documents, whether they are pub-lished or not. The documents may come from teaching and research institutions in France or abroad, or from public or private research centers.
L’archive ouverte pluridisciplinaire HAL, est destinée au dépôt et à la diffusion de documents scientifiques de niveau recherche, publiés ou non, émanant des établissements d’enseignement et de recherche français ou étrangers, des laboratoires publics ou privés.
Predicting microfibril angle in Eucalyptus wood from
different wood faces and surface qualities using near
infrared spectra
Paulo Ricardo Gherardi Hein, Bruno Clair, Loïc Brancheriau, Gilles Chaix
To cite this version:
Paulo Ricardo Gherardi Hein, Bruno Clair, Loïc Brancheriau, Gilles Chaix. Predicting microfibril angle in Eucalyptus wood from different wood faces and surface qualities using near infrared spectra. Journal of Near Infrared Spectroscopy, NIR Publications, 2010, 18 (6), pp.455-464. �10.1255/jnirs.905�. �hal-00641286�
1 Journal of Near Infrared Spectroscopy, 18 (6), 455–464 (2010)
doi: 10.1255/jnirs.905
NIRS CAN PREDICT MICROFIBRIL ANGLE IN Eucalyptus WOOD EVEN USING SPECTRA FROM DIFFERENT WOOD FACES, AND SURFACE QUALITIES
List of authors:
Paulo Ricardo Gherardi HEIN*
CIRAD - PERSYST Department - Production and Processing of Tropical Woods 73 rue Jean-François Breton TA B-40/16
34398 Montpellier, Cedex 5, France Tél: +33 4 67 61 44 51
Fax: +33 4 67 61 65 60 email: [email protected]
Bruno CLAIR
Laboratoire de Mécanique et Génie Civil, CNRS, Université Montpellier 2 Place E. Bataillon, cc 048
34095 Montpellier, Cedex 5, France
Loïc BRANCHERIAU
CIRAD - PERSYST Department - Production and Processing of Tropical Woods 73 rue Jean-François Breton TA B-40/16
34398 Montpellier, Cedex 5, France
Gilles CHAIX
CIRAD - BIOS Department - Genetic diversity and breeding of forest species 73 rue Jean-François Breton TA B-40/16
34398 Montpellier, Cedex 5, France
ABSTRACT: The microfibril angle (MFA) of crystalline cellulose in the wood cell wall
along the stem axis has major effects on stiffness and longitudinal shrinkage of wood and is of key importance to timber quality. The aims of this study were: (i) to develop partial least square (PLS) regression models for microfibril angle (measured on tangential sections by X-ray diffraction) based on NIR spectra measured on tangential and on radial surfaces; ii) to develop PLS regression models for such wood trait based on radial NIR spectra collected from wood surfaces of different quality; and (iii) to verify the reliability of these PLS-R models by external validations. T values were recorded by X-ray diffraction on tangential section while NIR spectra were taken on tangential and radial wood surfaces. PLS-R calibrations for MFA based on tangential NIR spectra were better (R²p=0.72) than those using radial NIR spectra (R²p=0.64). The key role of the chemical components and the effect of surface quality of wood on NIRS calibrations are discussed. Considering the differences between experimental conditions, these findings showed the robustness of the NIR-based models for predicting MFA in Eucalyptus wood, even using spectra taken from different wood faces, and surface qualities.
KEYWORDS: Eucalyptus urophylla S.T. Blake, microfibril angle, NIR calibration, X-ray
2
1. INTRODUCTION
Microfibril angle (MFA) is a property of the cell wall of wood fibres, which is made up of millions of strands of cellulose called microfibrils.1 This elementary wood trait represents the orientation of crystalline cellulose in the cell wall with respect to the stem axis.2 It is of particular interest for breeding programs3,4 since MFA has major effects on two key properties of wood: its stiffness and longitudinal shrinkage.5 Among all available techniques only X-ray diffractometry (XRD) provides quick MFA measurements for a large number of samples,6,7 however, sample preparation is often time-consuming. XRD has been largely used thanks to the crystalline arrangement of cellulose microfibrils in the wood cell wall; it allows studying not only its organisation (such as MFA) but also its apparent crystal size8 or its mechanical state.9 Numerous papers have proposed near infrared spectroscopy (NIRS) for MFA prediction (Table 1). NIRS is a rapid method for the determination of many chemical properties which have been successfully related to physico-mechanical properties of wood.26 One of its main advantages is the possibility of estimating a range of wood traits from the same NIR spectra. To explain the results of these established NIR-based calibrations for MFA, a common assumption is that the supposed correlation that exists between density and MFA plays a major role on NIR models. In regard to this pertinent issue, Schimleck et al.16 investigated the importance of density variation on NIR calibrations for MFA using Pinus
radiata D. Don and Pinus taeda L. wood samples demonstrating that NIR spectroscopy can
provide strong relationships for MFA even when density variation is limited.
Most studies on MFA prediction by NIR spectroscopy have been based on reference data provided by SilviScan measurements7 while NIRS calibrations for MFA based on independent XRD and NIRS devices are rarely reported (Table 1). Schimleck et al.4, Kelley et
al.24, and Huang et al.25 used softwoods to build their NIRS calibrations for MFA based on
measurements made on polyvalent XRD apparatus.
Thus, the aims of this study were: (i) to develop partial least square (PLS) regression models for MFA (measured on tangential sections by X-ray diffraction) based on NIR spectra measured on tangential sections of Eucalyptus urophylla; ii) to develop PLS regression models for such wood trait based on radial NIR spectra and with wood surface of different quality; and (iii) to verify the reliability of these PLS-R models by independent test validations.
We used NIR spectra scanned on tangential and radial wood faces, and with different surface qualities (tangential sections were cut with mini-circular bandsaw while the radial surfaces were cut with a vertical bandsaw and sanded). Using this procedure we tried to simulate a real situation in which established NIR-based models should be applied to assess wood properties of unknown samples, often prepared with different tools and unpredictable conditions.
2. MATERIAL AND METHODS
Forty (40) breast height wood disks of 14-year-old Eucalyptus urophylla S.T. Blake trees from the “Centre de recherche sur la durabilité et la productivité des plantations industrielles” (CRDPI) in Republic of Congo were used in this study. The climate is tropical humid with a mean annual temperature of 24°C, a mean annual rainfall of 1,200 mm and a dry season from May to October. The trees were planted in a randomized design and with a stocking density of
3 625 trees/ha (4x4 m spacing). Trees coming from the same experimental plantation were previously evaluated for wood density27 and chemical composition.28
2.1. Sampling preparation
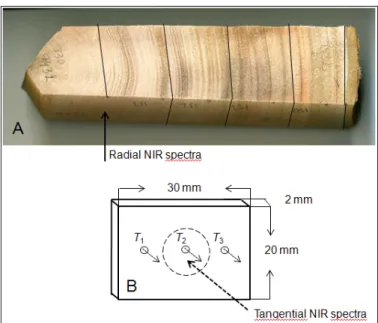
From each disc, a pith to bark radial strip (Figure 1) was removed by a vertical bandsaw and its radial surfaces were sanded with 300-grit sandpaper for approximately 30 seconds. The radial strips were marked randomly but well distributed from pith to bark to supply tangential sections (thickness of 2 mm), as parallel as possible, to the growth rings for microfibril angle measurements (Figure 1A). These wood strips have variable height and length (depending on the circumference and thickness of each wood disc), but their width was fixed at 30 mm. After sectioning, the samples were kept in a climate-controlled room (temperature around 20°C and relative humidity around 65%). Under these conditions, the moisture content of the wood samples stabilised at 12%.
2.2. Microfibril angle measurement
All X-ray diffraction data were collected on a diffractometer (Xcalibur-I, Oxford Instruments, USA) with CuK α radiation at the “Institut Européen des Membranes” at the University of Montpellier. Images were integrated between 2θ = 21.5 and 23.5 along the whole 360° azimutal interval to plot the intensity diagram of the (200) plane. An automatic procedure allowed the detection of the 200 peaks and their inflexion points. The T parameter is defined by Cave29 as the measure of the width of the (200) diffraction arc. Thus, the half distance
between intersections of tangents at inflexion points of the 200 peaks with the baseline was measured and the results are given as the mean of values obtained for the two 200 peaks. Two methods were applied in order to estimate MFA based on their X-ray diffraction pattern, namely: (i) MFAC for the values estimated by the Cave29 formula and (ii) MFAY for
estimations using the formula proposed by Yamamoto et al.30 These formulas give an estimation of the mean MFA of woods based on their T value and are given by:
(i) MFA C = 0.6×T (ii) =1.575 ×10−3× 3 −1.431 ×10−1× 2 + 4.693 × −36.19 T T T MFAY
Three X-ray diffraction profiles were recorded on three points of each sample (Fig. 1). The error of the measure of the T parameter was estimated at 3%.
2.3. NIR spectra measurements
NIR spectra were measured in diffuse reflectance mode with a Bruker spectrometer (model Vector 22/N, Bruker Optik GmbH, Ettlingen, Germany). This Fourier transform spectrometer is designed for reflection analysis of solids with an integrating sphere (diameter of measured area = 10 mm). Spectral analysis was performed within the 12,500 to 3,500 cm-1 (800 to 2,850 nm) range at 8 cm-1 resolution. A sintered gold standard was used as reference or as background. Thirty-two scans were performed and averaged for each measure, and compared to the standard in order to obtain the reflectance spectrum of the sample. NIR spectra were acquired in a climate-controlled room with temperature around 20°C and relative humidity around 65%.
4 NIR spectra were recorded on the radial surface of the two sides of the wood strips on marked points. These NIRS records were labelled as “radial NIR spectra” or “rad” in Tables. Subsequently, the radial strips were cut using a mini-circular bandsaw machine in order to produce: (i) 175 tangential sections (thickness of 2 mm) for X-ray diffraction measurement (Figure 1 B). The wood samples were kept in the same climatised room until moisture content stabilization. Thereafter, NIR spectra were acquired directly from tangential sections of the wood samples and were labelled as “tangential NIR spectra” or “tang” in Tables. In Figure 1, the continuous arrow represents radial NIR spectra while the dotted arrow represents tangential NIR spectra for MFA calibrations and the path of the XRD beam used for MFA determinations.
As described above, we used a NIR spectrometer with a window size of 10 mm. Thus, the NIR spectra scanned on tangential sections represents the wood formed at the same time, whereas the NIR radial surface takes into account the property averaged over a variable time period. This is the reason why tangential sections of wood were chosen for evaluating MFA by X-ray diffraction. We assumed that they could provide more repeatable MFA estimates. On the other hand, considering the increase of the use of motor-driven coring systems; the ease of NIRS scanning on radial strips of wood, and the need of a high throughput phenotyping tool for genetic studies, NIR calibrations fitted with precise reference data and suitable for estimating important wood traits, such as MFA, from radial NIR spectra (measured on radial surfaces of wood strips or increment cores) are of particular interest for breeding programs.
2.4. Chemometric Analysis
Partial Least Square (PLS) regression analyses were developed using The Unscrambler software (CAMO AS, Norway; version 9.8). The PLS-R method was used to correlate the near infrared spectra with referenced microfibril angle and wood density of the samples. First derivatives (13-point filter and a second order polynomial) and second derivatives (25-point filter and a third order polynomial) were applied on the NIR spectra data using the Savitsky and Golay31 algorithm.
The PLS-R models were developed using cross-validation with 5 segments and 35 samples selected randomly using tangential or radial NIR spectra. The cross-validations were used to identify the following calibration parameters: the best pre-treatments; the number of latent variables; outlier samples and wavelengths with significant regression coefficients. Also, cross-validations were useful to identify which reference values of MFA and its transformations generated the best NIR calibration. Outliers were identified and removed from a visual examination of the student residuals and leverage value scatter plot. The Martens32 uncertainty test was used to select the wavelengths with regression coefficients significantly different from zero for MFA or wood density. The models built with the remaining variables improved: the coefficient of determination increased, and the root mean of standard errors of validations decreased, both for density and for MFA.
Based on these established parameters, PLS-R calibrations (using 115 samples) and test set PLS-R validations (using 60 samples) were performed for MFA. To compare cross-validations and independent cross-validations PLS-R regressions for MFA, developed using tangential and radial NIR spectra, the following statistics were used: (1) coefficient of determination between measured and predicted values (R²p) or between measured and
cross-5 validated values (R²cv); (2) root mean of standard error of prediction (RMSEP) or
cross-validation (RMSECV); (3) ratio of performance to deviation (RPD) and (4) the number of latent variables (LV).
The RPD value is the ratio of the standard deviation (sd) of the reference values for the RMSECV or RMSEP.33 The higher the RPD value the more reliable the calibration.34 In an attempt to improve the calibrations, a simple transformation10 (100/MFA) was applied and labelled as 100/MFAC and 100/MFAY.
3. RESULTS AND DISCUSSION 3.1. Microfibril angle measurements
Each measurement was used as reference data for NIR calibrations. A summary of the microfibril angle measurements is reported in Table 2. The range of variation of the investigated properties is crucial for NIR calibrations. An increase of variability of the reference data improved the precision of the NIRS model (R², RSECV, RPD). According to Mora and Schimleck35, calibration models must include all possible sources of variation that can be encountered later in real applications because the goal is to estimate the properties in new samples.
The two approaches for conversion of the X-ray pattern to microfibril angle are based on the same T parameter. Hence, as expected, the microfibril angle values estimated by the Cave and Yamamoto formulas presented high correlations (r=0.97).
3.2. NIR spectroscopic based models
To explain the correlation between NIR spectra and MFA, a common assumption is that the correlation that exists between density and MFA plays a major role on NIR models. In regard to this pertinent issue, Schimleck et al.16 investigated the importance of density variation on NIR calibration in Pinus wood demonstrating that NIR spectroscopy can provide strong correlations for MFA even when density variation is limited.
In the present study, there was no correlation (-0.085<r<-0,112) between MFA and wood density. Hence, the density of wood, which has been extensively calibrated by NIR spectroscopy13,18,27,34 did not play any role on the PLS-R models for MFA presented in this study.
3.3. PLS-R cross-validations
A statistical summary of the cross-validated PLS-R models developed for microfibril angle using tangential NIR spectra measured from 1,100 to 2,500 nm are shown in Table 3.
The calibration for MFAC (R²cv=0.57; RMSECV=0.88) was better (higher RPD) than the
calibration for MFAY (R²cv=0.60; RMSECV=1.32). However, when using the parameter
100/MFAY, the regression (model 4) presented the higher R²cv (0.64). The highest RPD was
reached for the MFAC model. In general, the models for MFA estimates by Yamamoto´s
formulas30 gave the higher RMSECV´s both for MFA or 100/MFA.
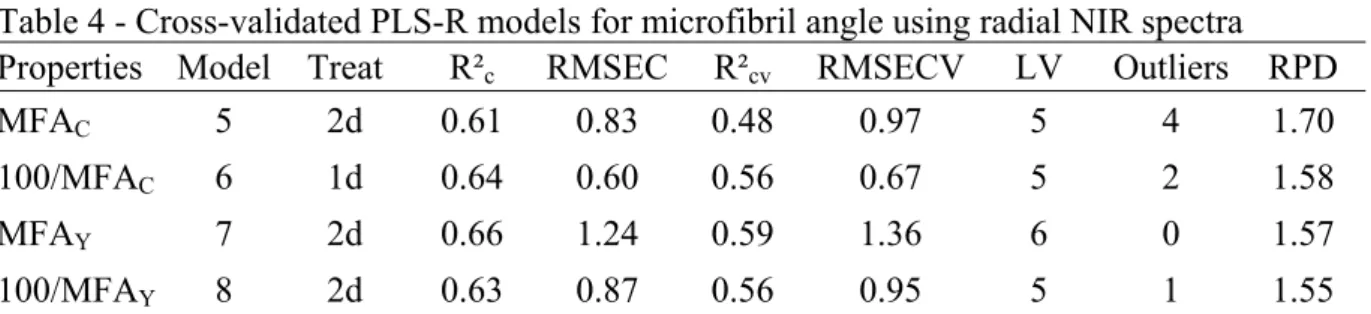
Table 4 presents the cross-validated PLS-R models for MFA using radial NIR spectra. The PLS-R cross-validation for MFAY based on radial NIR spectra (model 7) presented the higher
6 R²cv (0.59) and RMSECV (1.36) values. The higher RPD value (1.70) was presented again for
MFAC, which also yielded also the lowest R²cv (0.48). The high RPD values of models when
using Cave’s estimation as reference can be explained by the RMSECV: 0.97 for MFAC
against 1.36 for MFAY. Similarly, Cave´s formula yielded lower RMSECV values for MFA
or 100/MFA (Table 3).
3.4. Test set validations
To verify the robustness of these PLS-R models, the complete data set (no = 175) of the present study was split randomly into two sub-groups: a calibration set with 115 samples to build new PLS-R models and a test set with 60 samples to validate them. Table 5 presents the descriptive statistics of the calibration and validation data sets. The PLS-R models and independent validations for MFA, according to the surface NIR spectra were collected from, are summarized in Table 6.
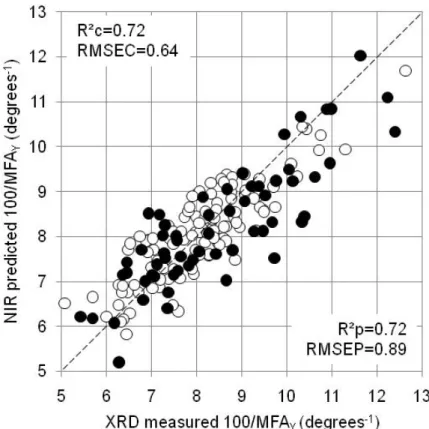
The validation of PLS-R models for 100/MFAY (model 12) provided R²p of 0.72 using
tangential NIR spectra. For these validations, the RMSEP were lower when using MFA estimates by Yamamoto’s formula.30 Model 11 which used MFAY and radial NIR spectra had
an R²p value of 0.64 and RMSEP of 1.32. These findings were comparable to those reported
by Kelley et al.25 who studied loblolly pine reporting R²c values from 0.52 to 0.72 for MFA.
When these models were validated with a test set, the statistics were weaker: R²p from 0.29 to
0.31(for wavelengths from 500 to 2,400 nm). Schimleck et al.4 also measured MFA using
X-ray diffraction on tangential faces sections cut from loblolly pine radial strips and developed NIR calibrations. The measured and NIR-predicted MFA presented a strong R²p (0.81) and
RPD (2.23). Their results suggests that a better model could have been obtained if the current sampling would have contained a wider range of MFA (the sampling used in Schimleck et al.4 ranged from 7.5 to 60.8° (for Pinus) while our MFA range varied from 7.7° to 19.7° - Table 2).
The NIR-predicted versus XRD-measured MFAY plot using radial NIR spectra (model 11) is
shown in Figure 2 while the NIR predicted versus XRD measured 100/MFAY plot using
tangential NIR spectra (model 12) is presented in Figure 3.
In comparison with other studies using Eucalyptus wood, the R²p presented in Table 6 were
slightly lower than those shown by Schimleck et al.10 who evaluated by NIRS the density and microfibril angle of Eucalyptus delegatensis R.T. Baker. Using MFA estimated on SilviScan-2, Schimleck et al.10 reported good PLS-R models in independent validations with R²
p=0.74
and SEP=1.73 for MFA, and R²p=0.78 and SEP=0.97 for 100/MFA in E. delegatensis. Our
PLS-R calibrations for MFA (models 9 and 11) and for 100/MFA (models 10 and 12) had lower coefficients of determination, but our RMSEP were also lower than the Schimleck et
al.10 models. These results (Table 6) were slightly better for the model statistics presented by
Schimleck et al.11 who used an established mixed species calibration to predict MFA and 100/MFA on a Eucalyptus delegatensis sample set. They reported R²p ranging from 0.45 to
0.61 for MFA and R²p varying from 0.58 to 0.66 for 100/MFA. In short, the calibration
statistics presented in this work were restricted mainly by the narrow range of MFA variation.
7 Numerous papers have demonstrated that NIR spectroscopy is a suitable tool for quick estimation of several non-chemical wood traits, such as mechanical properties and microstructural features, including MFA. However, it is not explained in the literature how NIR, based on vibrational spectroscopic analysis, could be used to estimate the orientation of cellulose in the secondary layers of the cell wall in vascular plants. In regard to this fundamental issue, an interpretation is proposed, based on the regression coefficients of the PLS-R models for wood density and MFA and based on chemical properties and MFA links. Figure 4 shows the plot of weighted regression coefficients for 100/MFAY (solid line) using
tangential NIR spectra (model 12) and MFAY (broken line) using radial NIR spectra (model
11). For the MFAY and 100/MFAY calibrations, the wavelengths around 1,875 nm (index 5);
2,050 nm (index 9); 2,080 nm (index 10); 2,200 nm (index 12); 2,270 nm (index 13); 2,425 nm (index 15) and 2,488 nm (index 16) represent high PLS regressions coefficients. These important absorption bands are related to the O-H, C-O, C-H and C-C stretching observed in crystalline regions of cellulose, as well as to the C-O stretching and C=O combination observed in aromatic groups of lignin. Moreover, we identified two specific bands which may play a major role in NIR calibrations for MFA and 100/MFA: (i) a minima at 1,875 nm (index 5) and maxima/minima at 2,425 nm (index 15). The loadings for MFA and 100/MFA are shown in Figure 4 (A).
3.6. Effect of chemical properties on MFA
Based on studies of reaction tissues produced in hardwoods and softwoods to straighten the stem, which possess special features in cell wall composition, one may assume that cellulose MFA and lignin content in the S2 layer could be generally related to each other.37 In
coniferous wood, Via et al.38 showed that MFA and lignin content are associated, the higher the lignin content, the higher the MFA. In hardwoods, this trend has been observed in a range of wood species39, both in reaction and normal wood, but some studies have reported no correlations between MFA and chemical components.37 Baillères et al.40 investigated hybrids of Eucalyptus clones from the Republic of the Congo demonstrating clearly that decreases in microfibril angles of cellulose are linked to the decrease in lignin content and increase in syringyl to guaiacyl ratio (S/G). Thus, these findings suggested that the calibrations for MFA can be related to changes in lignin contents or S/G ratio, at least partially, since these properties vary simultaneously in most woods and can play a key role in NIR models. On the other hand, Jungnikl et al.37 examinated the correlation between microfibril angle and lignin content in Picea abies tissues and did not find any correlation, neither for the individual tissue types nor for the compiled data of all tissues.
In the present study, MFA showed a low coefficient of correlation with NIR-based predicted lignin content. We used our earlier NIR-based models for klason lignin content established for trees from the same progeny trial28 in order to predict Klason lignin content in the 175 tangential sections. The correlation between the NIR-based estimates of lignin content and XRD measured microfibril angle values was 0.4. It is important to note that this lignin model was calibrated from NIR spectra measured on the transverse face of the wood discs (such discs were surfaced using a plane). Despite the low correlation (r=0.4), this finding seems to indicate that the lignin content may play a key role in NIR-based calibrations for microfibril angle.
8
3.7. Challenges of this study
To undertaking this work, several problems and limitations were faced which are addressed here: 1) the narrow range of microfibril angle of woods (previously discussed) was a restrictive factor in this work. Indeed, the narrow range of the MFA did not represent a limitation for comparing PLS-R calibrations based on tangential and radial NIR spectra, but makes difficult the achievement of stronger calibration/prediction statistics. For NIR calibration purposes, the larger the property variability, the greater the likelihood of obtaining a better coefficient of determination (between references and predicted values) of the predictive model; however, for Eucalypt woods it is unlikely that MFA range would be much greater. For instance, Lima et al.41 found no significant differences in MFA from pith to bark for E. grandis × E. urophylla clones; 2) we used a Fourier transform spectrometer which measures the diffuse reflected light through a window size of 10 mm. Hence, the NIR spectra measured on tangential and radial wood surfaces has information averaged over 78.5 mm² of wood surface whereas the surface area of the X-ray incident beam was less than 1 mm². In order to minimise this problem, three T parameters were recorded on each tangential section, but the scanned area of NIR measurement remained much larger. In regard to this issue, we also used a NIR device equipped with a fiber optic probe (spectrometer ASD Labspec Pro) to investigate the supposed scale effect on these tangential sections, but we found quite similar results and decided to work only with the NIR information obtained with the Bruker device. 3) an important limitation of the proposed method is the difficulty in cutting tangential sections, which is time-consuming and is not compatible with the high throughout phenotyping objectives for genetic studies.
Despite all challenges we faced, the association of X-ray diffraction and NIR spectroscopy to evaluating MFA in these woods had two substantial advantages: speed and accuracy; sufficient, at least to distinguish classes in genetic studies. The NIR calibrations for MFA generate estimates with errors (RMSEP=1.32° or 10.5% for radial spectra against 3% of error from X-ray approach), but they are able to distinguish trees that produce wood with large range microfibril angles.
It is important to note that the wood radial surfaces were sanded while the tangential sections were not sanded. The mini-circular bandsaw machine used to produce the tangential sections provided high quality surfaces while the vertical bandsaw machine used to cut the radial strips from the discs provided irregular surfaces which were sanded (300-grit sandpaper for approximately 30 seconds). Hence, using different wood faces and surface qualities, the attempt was made to simulate a real situation in which established NIR-based models should be applied to predicting such wood properties of unknown samples, frequently prepared under different experimental conditions. Therefore, these PLS-R models showed the robustness of the NIR-based validations for MFA (based on X-ray diffraction) from both tangential (R²p=0.72) and radial (R²p=0.64) wood surfaces, and with different wood quality surfaces.
4. CONCLUSIONS
It was possible to develop PLS-R calibrations for microfibril angle in Eucalyptus wood based on reference values recorded on tangential sections by the X-ray diffraction technique using both radial and tangential NIR spectra. Using a calibration set to build the models, and a test set to validate them, the PLS-R model for 100/MFA based on tangential NIR spectra presented the best statistics (R²p=0.72) while the model based on radial NIR spectra was the
9 best for MFA (R²p=0.64). With respect to the models for MFA, the reference data based on
Yamamoto formula generated better statistics.
Considering the differences between experimental conditions, these results showed the robustness of the NIR models for MFA: NIR spectroscopy tool was able to predict MFA of
Eucalyptus wood, using both different wood faces, and wood quality surfaces.
5. ACKNOWLEDGMENTS
The authors would like to thank Arie van der Lee from Institut Européen des Membranes, CNRS, University of Montpellier for assistance with X-ray diffraction measurements and Joseph Gril from CNRS for critical reading of the manuscript; to Nina Ognouabi and Emilie Villar from CRDPI (Republic of Congo) and the “Bureau des Ressources Génétiques” (BRG) project for providing material and funding; especially to Dr. Jean Marc Gion and to Dr. Philippe Vigneron (coordinators of the BRG project “CCR gene in Eucalyptus: a model of functional variability in forest trees”) from UPR39 and UPR40 of CIRAD-Montpellier for providing technical support. PRG Hein was supported by the National Council of Technological and Scientific Development (CNPq, Brazil - process no. 200970/2008-9).
6. REFERENCES
01. S-Z. Fang, W-Z. Yang and Y. Tian, “Clonal and within-tree variation in microfibril angle in poplar clones”, New Forests 31, 373-383 (2006).
02. S. Andersson, R. Serimaa, M. Torkkeli, T. Paakkari, P. Saranpfifi and E. Pesonen, “Microfibril angle of Norway spruce (Picea abies [L.] Karst.) compression wood: comparison of measuring techniques”, J. Wood Sci. 46, 343-349 (2000).
03. C.A. Raymond, “Genetics of Eucalyptus wood properties”, Ann. For. Sci. 59, 525-531 (2002).
04. L.R. Schimleck, E. Sussenbach, G. Leaf, P.D. Jones and C.L. Huang, “Microfibril angle prediction of Pinus taeda wood samples based on tangential face NIR spectra”, IAWA J. 28, 1-12 (2007).
05. L. Donaldson, “Microfibril angle: measurement, variation and relationships – a review”,
IAWA J. 29, 345-386 (2008).
06. R. Evans, S.A. Stuart and J. Van der Touw, “Microfibril angle scanning of increment cores by X-ray diffractometry”, Appita J. 49, 411 (1996).
07. R. Evans, “A variance approach to the x-ray diffractometric estimation of microfibril angle in wood”, Appita J. 52, 283-289 (1999).
08. R. Washusen and R. Evans, “The association between cellulose crystallite width and tension wood occurrence in Eucalyptus globulus”, IAWA J. 22, 235-243 (2001).
09. B. Clair, T. Alméras, H. Yamamoto, T. Okuyama and J. Sugiyama, “Mechanical behaviour of cellulose microfibrils in tension wood, in relation with maturation stress generation”, Biophys. J. 91, 1128-1135 (2006).
10. L.R. Schimleck, R. Evans and J. Ilic, “Estimation of Eucalyptus delegatensis wood properties by near infrared spectroscopy”, Can. J. For. Res. 31, 1671-1675 (2001).
11. L.R. Schimleck, R. Evans and J. Ilic, “Application of near infrared spectroscopy to a diverse range of species demonstrating wide density and stiffness variation”, IAWA J. 22, 415-429 (2001).
12. L.R. Schimleck and R. Evans, “Estimation of microfibril angle of increment cores by near infrared spectroscopy”, IAWA J. 23, 225-234 (2002).
10 13. L.R. Schimleck, C. Mora and R.F. Daniels, “Estimation of the physical wood properties of green Pinus taeda radial samples by near infrared spectroscopy”, Can. J. For. Res. 33, 2297-2305 (2003).
14. R.P. Cogdill, L.R. Schimleck, P.D. Jones, G.F. Peter, R.F. Daniels and A. Clark, “Estimation of the physical wood properties of Pinus taeda L. radial strips using least square support vector machines”, J. Near Infrared Spectrosc. 12, 263-269 (2004).
15. L.R. Schimleck, R. Stürzenbecher, P.D. Jones and R. Evans, “Development of wood property calibrations using near infrared spectra having different spectral resolutions”, J. Near
Infrared Spectrosc. 12, 55-61 (2004).
16. L.R. Schimleck, R. Evans, P.D. Jones, R.F. Daniels, G.F Peter, A. Clark III, “Estimation of microfibril angle and stiffness by near infrared spectroscopy using sample sets having limited wood density variation”, IAWA J. 26, 175-187 (2005).
17. L.R. Schimleck, R. Stürzenbecher, C. Mora, P.D. Jones and R.F. Daniel, “Comparison of
Pinus taeda L. wood property calibrations based on NIR spectra from the radial-longitudinal
and radial-transverse faces of wooden strips”, Holzforschung 59, 214-218 (2005).
18. L.R. Schimleck, P.D. Jones, G.F. Peter, R.F Daniels and A. Clark III, “Success in using near infrared spectroscopy to estimate wood properties of Pinus taeda radial strips not due to autocorrelation”, J. Near Infrared Spectrosc. 13, 47-52 (2005).
19. P.D. Jones, L.R. Schimleck, G.F. Peter, R.F. Daniels and A. Clark III, “Nondestructive estimation of Pinus taeda L. wood properties for samples from a wide range of sites in Georgia”, Can. J. For. Res. 35, 85-92 (2005).
20. L.R. Schimleck, G.M. Downes and R. Evans, “Estimation of Eucalyptus nitens wood properties by near infrared spectroscopy”, Appita J. 59, 136-141 (2006).
21. L.R. Schimleck, J.A. Tyson, P.D. Jones, G.F. Peter, R.F Daniels and A. Clark III, “Pinus
taeda L. wood property calibrations based on variable numbers of near infrared spectra per
core and cores per plantation”, J. Near Infrared Spectrosc. 15, 261-268 (2007).
22. P.D. Jones, L.R. Schimleck, C.-L. So, A. Clark III and R.F. Daniels, “High resolution scanning of radial strips cut from increment cores by near infrared spectroscopy”, IAWA J. 28, 473-484 (2007).
23. F. Antony, L. Jordan, L.R. Schimleck, R.F. Daniels and A. Clark III, “The effect of mid-rotation fertilization on the wood properties of loblolly pine (Pinus taeda)”, IAWA J. 30, 49-58 (2009).
24. A. Huang, F. Fu, B. Fei and Z. Jiang, “Rapid estimation of microfibril angle of increment cores of Chinese fir by near infrared spectroscopy”, Chin. For. Sci. Technol. 7, 52-56 (2008). 25. S.S. Kelley, T.G. Rials, L.R. Groom and C.-L. So, “Use of Near Infrared Spectroscopy to predict the mechanical properties of six softwoods”, Holzforschung 58, 252-260 (2004). 26. S. Tsuchikawa, “A review of recent near infrared research for wood and paper”, Appl.
Spectrosc. Rev. 42, 43-71 (2007)
27. P.R.G. Hein, J.T. Lima and G. Chaix, “Robustness of models based on near infrared spectra to predict the basic density in Eucalyptus urophylla wood”, J. Near Infrared
Spectrosc. 17, 141-150 (2009).
28. P.R.G. Hein, J.T. Lima and G. Chaix, “Effects of sample preparation on NIR spectroscopic estimation of chemical properties of Eucalyptus urophylla S.T. Blake wood”,
Holzforschung 64: 45-54 (2010).
29. I.D. Cave, “Theory of X-ray measurement of microfibril angle in wood”, For. Prod. J. 16, 37-42 (1966).
11 30. H. Yamamoto, T. Okuyama and M. Yashida, “Method of determining the mean microfibril angle of wood over a wide range by the improved Cave´s method”, Mokuzai
Gakkaishi 39, 118-125 (1993).
31. A. Savitzky and M.J.E. Golay, “Smoothing and differentiation of data by simplified least-squares procedures”, Anal. Chem. 36, 1627-1639 (1964).
32. F. Westad and H. Martens, “Variable selection in near infrared spectroscopy based on significance testing in partial least square regression”, J. Near Infrared Spectrosc. 8, 117-124 (2000).
33. AACC, AACC Method 39-00, American Association of Cereal Chemists (AACC), 15, (1999)
34. T. Fujimoto, Y. Kurata, K. Matsumoto and S. Tsuchikawa, “Application of near infrared spectroscopy for estimating wood mechanical properties of small clear and full length lumber specimens”. J. Near Infrared Spectrosc. 16, 529-537 (2008).
35. C.R. Mora and L.R. Schimleck, “On the selection of samples for multivariate regression analysis: application to near-infrared (NIR) calibration models for the prediction of pulp yield in Eucalyptus nitens”, Can. J. For. Res. 38, 2626-2634 (2008).
36. J.J. Workman and L. Weyer, Practical Guide to Interpretive Near-Infrared Spectroscopy. CRC Press, Boca Raton, p. 332 (2007)
37. K. Jungnikl, G. Koch and I. Burgert, “A comprehensive analysis of the relation of cellulose microfibril orientation and lignin content in the S2 layer of different tissue types of
spruce wood (Picea abies (L.) Karst.)”, Holzforschung 62, 475-480 (2008).
38. B.K. Via, C.L. So, T.F. Shupe, L.H. Groom and J. Wikaira, “Mechanical response of longleaf pine to variation in microfibril angle, chemistry associated wavelengths, density, and radial position”, Composites: Part A 40, 60-66 (2009).
39. J.R. Barnett and V.A. Bonham, “Cellulose microfibril angle in the cell wall of wood fibres”, Biol. Rev. 79, 461-472 (2004).
40. H. Baillères, B. Chanson, M. Fournier, M.T. Tollier and B. Monties, “Structure, composition chimique et retraits de maturation du bois chez les clones d’Eucalyptus”, Ann.
For. Sci. 52, 157-172 (1995).
41. J.T. Lima, M.C. Breese and C.M Cahalan, “Variation in microfibril angle in Eucalyptus clones”. Holzforschung 58, 160-166 (2004).
12 7. LIST OF TABLES
Table 1 - Most important papers on MFA evaluation by NIR spectroscopic models, including the method used as reference, the species, its age (in years), and its range of variation, and the model statistics.
Reference Method Species Age MFA range R²p SEP RPD
Schimleck et al.10 SilviScan
E. delegatensis mature 0.74 1.73
Schimleck et al.10* SilviScan E. delegatensis mature 0.78 0.97
Schimleck et al.11 Silviscan
E. delegatensis 0.45-0.61 1.91-2.56
Schimleck et al.11 Silviscan
P. radiata 0.55-0.63 3.05-4.62
Schimleck and
Evans12 Silviscan P. radiata 26 10.7-41.6 0.96-0.98 1-2.5
Schimleck et al.13 SilviScan
P. taeda ~20 10.7-36.4 0.76-0.80 3.4-4.0 1.9-2.2
Codgill et al.14 SilviScan
P. taeda 21-26 11-45.2 0.85-0.91 2.9-2.2 2.5-3.3
Schimleck et al.15 SilviScan
P. taeda 21-26 11-45.2 0.88 3.2 2.3
Schimleck et al.16 SilviScan
P. radiata 26 0.79-0.99 0.4-1.9 2.2-9.1
Schimleck et al.16 SilviScan
P. taeda 21-26 0.41-0.96 1.1-3.4 1.3-4.9
Schimleck et al.17 SilviScan
P. taeda 10.7-37.4 0.81-0.89 2.5-3.2 2.3-3
Schimleck et al.18 SilviScan
P. taeda 21-26 11.6-40.7 0.85-0.88 5.2-9.9 0.8-1.5
Jones et al.19 SilviScan
P. taeda 21-26 9.7-45.2 0.80-0.84 3.12-7.22 1.01-2.34
Schimleck et al.20 SilviScan E. globulus and
E. nitens 8 12.0-26.8 0.20 2.9
Schimleck et al.21 SilviScan
P. taeda 21-26 8.7-51.7 0.79-0.85 2.72-4.92
Jones et al.22 SilviScan
P. taeda 21-26 0.48-0.84 3.8-6.03 1.21-2.07
Antony et al.23 SilviScan
P. taeda 33 0.83 2.4 1.8 Schimleck et al.4 XRD P. taeda 30-33 7.5-60.8 0.81-0.91 3.89-4.66 2.3-2.4 Huang et al.24 XRD C. lanceloata 0.77 Kelley et al.25 XRD P. taeda 6.5-43 0.31-0.46 6.8-8
* Refers to the 100/MFA transformation
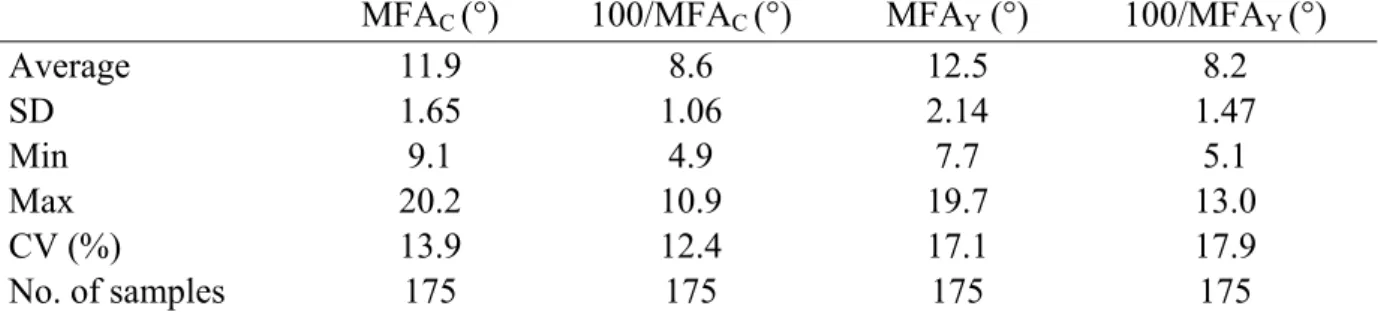
Table 2 - Descriptive statistics, including average, standard deviation (SD), minimum (Min), maximum (Max) and coefficient of variation (CV) for microfibril angle (MFA) measurements in 14-year Eucalyptus urophylla
MFAC (°) 100/MFAC (°) MFAY (°) 100/MFAY (°)
Average 11.9 8.6 12.5 8.2 SD 1.65 1.06 2.14 1.47 Min 9.1 4.9 7.7 5.1 Max 20.2 10.9 19.7 13.0 CV (%) 13.9 12.4 17.1 17.9 No. of samples 175 175 175 175
13 Table 3 - Cross-validated PLS-R models for microfibril angle using tangential NIR spectra Properties Model Treat R²c RMSEC R²cv RMSECV LV Outliers RPD
MFAC 1 1d 0.65 0.79 0.57 0.88 6 2 1.85
100/MFAC 2 2d 0.69 0.55 0.57 0.66 6 1 1.62
MFAY 3 2d 0.68 1.17 0.6 1.32 5 0 1.62
100/MFAY 4 2d 0.72 0.73 0.64 0.84 6 3 1.76
1d - first derivative; 2d - second derivative; R2cal - coefficient of determination of the calibration model; RMSEC - root mean standard error of calibration; r2cv - coefficient of determination of the cross-validation; RMSECV - root mean standard error of cross-validation; LV - latent variables and RPD - Ratio of Performance to Deviation
Table 4 - Cross-validated PLS-R models for microfibril angle using radial NIR spectra
Properties Model Treat R²c RMSEC R²cv RMSECV LV Outliers RPD
MFAC 5 2d 0.61 0.83 0.48 0.97 5 4 1.70
100/MFAC 6 1d 0.64 0.60 0.56 0.67 5 2 1.58
MFAY 7 2d 0.66 1.24 0.59 1.36 6 0 1.57
100/MFAY 8 2d 0.63 0.87 0.56 0.95 5 1 1.55
1d - first derivative; 2d - second derivative; R2cal - coefficient of determination of the calibration model; RMSEC - root mean standard error of calibration; r2cv - coefficient of determination of the cross-validation; RMSECV - root mean standard error of cross-validation; LV - latent variables and RPD - Ratio of Performance to Deviation
Table 5 - Descriptive statistics, including average, standard deviation (SD), minimum (Min) and maximum (Max) values and coefficient of variation (CV) for microfibril angle (MFAY) of
the calibration and validation data set
Set Average SD Min Max CV (%) No. of samples
Calibration 12.3 1.75 7.7 17.3 14.2 115
Validation 12.5 1.82 8.4 16.1 14.5 60
Table 6 - PLS-R calibrations and independent validations for microfibril angle according to surface used to collect NIR spectra
Traits Model Surface Treat R²c RMSEC R²p RMSEP LV Outlier RPD
MFAC 9 tang 2d 0.66 1.24 0.60 1.35 6 0 1.59
100/MFAC 10 rad 2d 0.70 0.65 0.63 0.94 6 3 1.6
MFAY 11 rad 2d 0.67 1.21 0.64 1.32 6 0 1.63
100/MFAY 12 tang 2d 0.72 0.64 0.72 0.89 7 3 1.65 tang - tangential NIR spectra; rad - radial NIR spectra; 2d - second derivative; R2c - coefficient of determination of the calibration model; RMSEC - root mean standard error of calibration; r2p - coefficient of determination of the prediction by test set validation; RMSEP - root mean standard error of the prediction by test set validation; LV - latent variables and RPD - Ratio of Performance to Deviation
14 Table 7 - NIR absorption bands normally associated to the main wood components (cellulose, hemicelluloses, lignin, polysaccharides and water) according to Workman and Weyer.36 Numbers assigned to the specific bands and regression coefficients are presented in Figure 4.
Index nm Bond vibration Structure
1 1,410 OH stretching 1st OT lignin or first overtone of an O-H
stretching vibration of phenolic hydroxyl groups Lignin
2 1,428 O-H stretching Amorphous cellulose
3 1,672 1st overtone CH stretching Lignin 4 1,685 C-H (2v), ArC-H: C-H aromatic associated C-H Lignin 5 1,875 not assigned
6 1,916 O-H stretching + OH deformation Water 7 1,930 O-H stretching + HOH bending combination
8 2,012 N-H/C=O combination Polyamide
9 2,050 N-H/C-N/N-H amide II and III combination Amides
10 2,080 O-H stretching + CH deformation Semi-crystalline or crystalline regions of cellulose
11 2,140 C-H + C-C stretching Amorphous cellulose 12 2,200 C-H stretching and C=O combination Lignin
13 2,270 O-H stretching + C-O stretching combination Cellulose 14 2,280 C-H stretching and CH2 deformation Polysaccharides
15 2,425 not assigned Cellulose
15
8. LIST OF FIGURES
Figure 1 - Sampling protocol. Radial strips (A) cut from discs; tangential sections for X-ray diffraction measurement (B). The dotted arrows represent NIR spectra for MFA calibrations
Figure 2 - NIR predicted versus measured values for MFAY using radial NIR spectra. The
calibration set samples are represented by white circles and the validation set samples are represented by black circles
16 Figure 3 - NIR predicted versus measured values for 100/MFAY using tangential NIR spectra. The calibration set samples are represented by white circles and the validation set samples are represented by black circles
Figure 4 - Regression coefficients of the PLS-R models to predict 100/MFAY and MFAY
using tangential and radial NIR spectra. Bands assigned to chemical compounds are represented by numbers and listed in Table 6.