Publisher’s version / Version de l'éditeur:
Canadian Journal of Civil Engineering, 6, 3, pp. 447-455, 1979-09
READ THESE TERMS AND CONDITIONS CAREFULLY BEFORE USING THIS WEBSITE. https://nrc-publications.canada.ca/eng/copyright
Vous avez des questions? Nous pouvons vous aider. Pour communiquer directement avec un auteur, consultez la première page de la revue dans laquelle son article a été publié afin de trouver ses coordonnées. Si vous n’arrivez pas à les repérer, communiquez avec nous à [email protected].
Questions? Contact the NRC Publications Archive team at
[email protected]. If you wish to email the authors directly, please see the first page of the publication for their contact information.
NRC Publications Archive
Archives des publications du CNRC
This publication could be one of several versions: author’s original, accepted manuscript or the publisher’s version. / La version de cette publication peut être l’une des suivantes : la version prépublication de l’auteur, la version acceptée du manuscrit ou la version de l’éditeur.
Access and use of this website and the material on it are subject to the Terms and Conditions set forth at
Dynamic testing of a modern concrete bridge
Rainer, J. H.; Pernica, G.
https://publications-cnrc.canada.ca/fra/droits
L’accès à ce site Web et l’utilisation de son contenu sont assujettis aux conditions présentées dans le site LISEZ CES CONDITIONS ATTENTIVEMENT AVANT D’UTILISER CE SITE WEB.
NRC Publications Record / Notice d'Archives des publications de CNRC:
https://nrc-publications.canada.ca/eng/view/object/?id=c2e9559a-48fa-467e-95db-c23850c67f92 https://publications-cnrc.canada.ca/fra/voir/objet/?id=c2e9559a-48fa-467e-95db-c23850c67f92
T H 1 I
National Research Conseil national
$
Council
Canada de recherchesCanada
DYNAMIC TESTING OF A MODERN CONCRETE BRIDGE
by J . H. Rainer and G . Pernica
Reprinted from
Canadian Journal of Civil Engineering Vol. 6, No. 3, September 1979
pp. 447-455
r
Division DBR Paper No. of Building Research 852 IThis publication is being distributed by the Division of Building Research of the National Research Council of Canada. It should not be reproduced in whole or in part without permis- sion of the original publisher. The Division would be glad to be of assistance in obtaining such permission.
Publications of the Division may be obtained by mailing the appropriate remittance (a Bank, Express, or Post Office Money Order, or a cheque, made payable to the Receiver General of Canada, credit NRC) to the National Research Council of Canada, Ottawa. KIA 0R6. Stamps are not acceptable. A list of all publications of the Division is available and may be obtained from the Publications Section, Division of Building Research, National Research Council of Canada, Ottawa. KIA 0R6.
Dynamic testing of a modern concrete bridge
J . H. RAINER A N D G. PERNICA
Noise and Vibration, Diuision ofBuilding Research, National Research Council of Canada, Ottawa, Ont., Canada K I A OR6 Received January 12, 1979
Accepted April 5, 1979
A posttensioned reinforced concrete bridge, slated for demolition, was tested to obtain its dynamic properties. The 10 year old bridge consisted o f a continuous flat slab deck o f variable thickness having a total width o f 103 ft (31.39 m ) and spans o f 28ft 6in. (8.69m), 71 ft Oin. (21.64 m ) , and 4 2 f t 6 in. (12.95 m). The entire bridge was skewed 10°50' and thedeck was slightly curved in plan.
The mode shapes, natural frequencies, and damping ratios for the lowest five natural modes o f vibration were determined using sinusoidal forcing functions from an electrohydraulic shaker. These modes, located at 5.7,6.4,8.7, 12.0, and 17.4 Hz, were found t o be highly dependent on the lateral properties o f the bridge deck. Damping ratios were determined from the widths o f resonance peaks. The modal properties from the steady state excitation were compared with those obtained from measurements o f traffic-induced vibrations and good agreement was found between the two methods.
Can. J. Civ. Eng., 6, 447-455 (1979)
Introduction
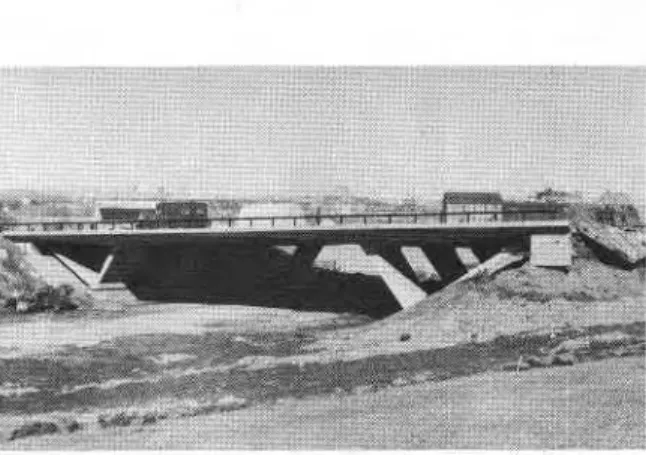
The Ottawa River Parkway Service Road Bridge in the City of Ottawa. Ontario. was located iust west of the National ~ i b r a r ~ on ~ e l l i n ~ t o i Street. Completed in 1967, it carried two lanes of relatively light traffic in each direction; trucks and commercial vehicles were prohibited from using the Parkway. When the Portage Bridge was constructed across the Ottawa River between Ottawa and Hull in 1973, the Service Road Bridge had to be removed to accom- modate the approaches for the new bridge. This provided a unique opportunity to test a modern prestressed concrete bridge.
A 2 week period between the date of closure of the bridge and the date of demolition was arranged to permit a series of static and dynamic tests. Un- fortunately, the preparation time for the tests was considerably reduced when the demolition date for the bridge was advanced, so that only a ,limited series of dynamic tests could be performed. This report describes the test program and the results that were obtained.
Description of Bridge
The bridge consisted of a continuous three-span, flat slab deck having a total width of 103 ft (31.39 m) and spans of 28 ft 6 in. (8.69 m), 71 ft 0 in. (21.64 m), and 42 ft 6 in. (12.95 m). The deck was posttensioned in both directions, supported at each end on four sets of V-shaped struts equally spaced across the width of the bridge (Fig. 1). Because the design requirements for the bridge included a shallow centre-span section, both bridge abutments were vertically posttensioned by means of six rock anchors
FIG. 1. View o f Ottawa River Parkway Service Road Bridge, looking N W .
at locations shown in Fig. 2. This applied a bending moment to the centre span that countered both dead and live load effects.
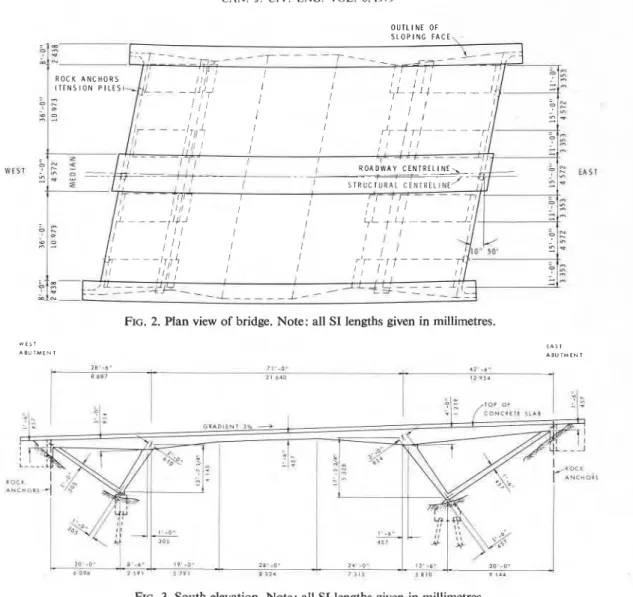
The bridge roadway was slightly curved in plan to accommodate a curve in the Parkway. It had a longitudinal gradient of 3% rising towards the east and a transverse gradient of 3.8% rising towards the south. The entire bridge deck, V-supports, and anchorage system were skewed 10°50' relative to the structural control line of the bridge. The geometry and major dimensions of the bridge are shown in plan in Fig. 2 and in elevation in Fig. 3.
Cables of the posttensioning system of the deck consisted of twelve x 0.6 in. (1 5 mm) diameter Freyssinet strands in 3 in. (76 mm) diameter sheaths. The cables were tensioned at both ends to a force varying from 459 to 480 kips (2043 to 2136 kN), depending on location, and were subsequently grouted. The layout of the posttensioning cables is shown in Fig. 4a for a typical longitudinal deck 03 15- 1468/79/030447-09$01 .OO/O
448 CAN. J . CIV. ENG. VOL. 6,1979
O U T L I N E O F
FIG. 2. Plan view of bridge. Note: all SI lengths given in millimetres.
w r i l
A B U I M E N T
E A S T A B U T M E N T
FIG. 3. South elevation. Note: all SI lengths given in millimetres.
section and in Fig. 4 b and c for transverse sections concrete counterweight of 516 kips (2296 kN) cen-
:
over the interior supports. All 52 longitudinal cables trally hung from the abutment wall.had the same profile in elevation, as shown in Fig. 4a, The base of each of the V-supports at the east end and were approximately equally spaced across the formed a concrete hinge with a reinforced concrete + deck width. In plan, however, they followed the foundation beam, continuous across the full width
,
same curvature as the roadway centreline. of the bridge. This beam rested on groups of eightThe centre median and the two sidewalks were piles under each V-support; as shown in Fig. 3 each posttensioned longitudinally (two cables for the pile was inclined at a slope of 1: 5. At the west end median and one cable for each sidewalk) and sub- each of the V-support bases was provided with two sequently bolted to the deck. The transverse cables Andrt bearings capable of f
4
in. (13 mm) trans- away from the interior supports were parallel to the verse movement. These rested on a continuous top of the bridge deck throughout the width of the reinforced concrete foundation beam supported bybridge. a group of four piles under each V-support; each
At the east abutment three vertical rock anchors pile was inclined at a slope of 1 : 10 alternating to the (see Figs. 2, 3) were tensioned to a cable force of east and to the west. All compression piles were of 429 kips (1910 kN) and then grouted within a precast reinforced concrete with a bearing capacity "tension pile." The same procedure was followed at of 250 kips (1 113 kN) and driven to refusal. The soil the west abutment, except that anchorage problems consisted of 40 ft (12.2 m) of sandy silt overburden encountered during construction led to replacement on a shale base.
of the centre rock anchor by a 40 ft (12.2 m) long The specified concrete design strength for the deck
RAINER A N D PERNICA 449 (a) S E C T I O N @ W E S T I S F C T T O N
9
E A S T T R A N S V E R S E T R A N S V E R S E C A B L E S A S I N C A B L E S A S I N ' I r L O N G l T U D l N A L C A B L E ' F I G . 4 c F I G . 4 b ( T Y P I C A L ) 1 ( T Y P I C A L ) S E C T I O N ($ NOTE: L O N G I T U D I N A L C A B L E S N O T S H O W NFIG. 4. Layout of posttensioning cables. (a) Longitudinal section @.(b) Transverse section @.(c) Transverse section @. and V-supports was 5000 psi (34 500 kPa) at 28 days.
Tests on two core samples of 2.7 in. (69 mm) diameter and 8.0 in. (203 mm) length, taken from the deck at time of testing, gave ultimate strengths of 6300 and 7000 psi (43 500 and 48 300 kPa) and initial moduli of 4190 and 4630 ksi (28 900 and 32 000 MPa), respectively. The bridge was designed for live loads specified by the American Association of State Highway and Transportation Officials (AASHTO H20-S16).
Testing Program
Traffic Vibrations stations for: FIG. 5. Instrumentation layout on bridge deck. Transducer A traffic vibrations; setup A and setup B
Measurement Procedure (both shaker tests).
Vibration measurements were made on the bridge
prior to closure. Traffic across it consisted of with various seismometer layouts, but only results C
passenger cars travelling at approximately 40 mph from runs 1 and 4 are reported here. (64 km/h) and fully loaded tandem and single- AnalysirProcedure
I axle dump trucks that entered the Parkway from the The recorded signals were displayed on a 7-
construction site of the Bridge and channel Honeywell visicorder. Several paper speeds the Bridge at 20 m ~ h were used in order to examine the quality of the
(32 km/h). recorded signals, which were then analysed on a
Mark 'I seismometers were used to real-time Fourier spectrum analyser. Only the measure vertical and horizontal vibrations of the results for stations and 6, located at the midspan
i
bridge deck and V - s u ~ ~ o r t s . The locations of of the north and south sidewalks (Fig. 5), were seismometers oriented to measure vertical vibrations examined in detail.and placed on both bridge sidewalks are shown in
Fig. -5. The other seismometer locations are not ForcedHarmonic Vibrations shown because their data were not used in ,sub- Shaker Description and Operation
sequent evaluations. The signals from the seis- Forced harmonic vibrations of the bridge deck mometers were recorded on a 7-channel FM tape were generated by an electrohydraulic inertial shaker recorder. Four 30 min recording sessions were made with a maximum capacity of 6000 1b (26 700 N)
450 CAN J. CIV ENG VOL 6. 1979
peak-to-peak force. The shaker system comprises . .
I
three major components: the power pack, which supplies a 20 gal/min (90 L/min) flow of oil under 3000 psi (20 700 kPa) pressure; the shaker, which consists of a mounting plate and a jack containing the moving piston and attached inertial weights; and a control panel that operates, controls, and monitors the complete shaker system. Figure 6 presents a view
of the shaker mounted on the bridge A number of
-
I100 lb (45.4 kg) inertial weights are attached to the
top of the piston. Three servo-valves driven by a
--
,sinusoidal voltage from the control panel regulate the flow of oil to the piston, thereby controlling the amplitude and frequency of the piston motion. A sinusoidal vertical motion of the piston would thus
impart a sinusoidal vertical force to the supporting FIG. 6 . Electrohydraulic shaker mounted on bridge median.
structure.
quency increments for .the shaker jack so that a Measurement Procedure well-defined resonance peak could be obtained a t Transducer layout was governed by the require- each natural frequency of the bridge; (2) to select ment for obtaining the lower modes of vibration of appropriate frequency increments other than those the bridge in as few tests as possible, using available in the immediate neighbourhood of a natural transducers and recording channels. Two transducer frequency so that bridge response increments would layouts were chosen for the tests (Fig. 5), designated not be too large; and (3) to ensure that the response layouts A and B. At each station an MB Electronics of the bridge to a given frequency of excitation had Model 120 velocity transducer having a sensitivity of stabilized before the next frequency increment was 98 mV.in.-'.s (3.86 V.m-'as) was used. applied. The latter was generally achieved by holding
The output signals from the transducers were each frequency constant for 15-20 s.
brought to a laboratory parked near the The amplitude of the shaker force displayed on western approach the bridge, amp1ified, and then the control panel was held constant during each test. recorded on a 7-channel FM tape recorder. This required manual adjustment of the gain control Test Procedure to compensate for variations in the force amplitude Two shaker locations were selected (Fig. 5) on the with frequency.
bridge deck as points of excitation: NO. 1 on the Analysis of Data
longitudinal centreline of the bridge and NO. 2 to The recorded signals were displayed in the lab- one side of the centreline. These locations were oratory on a 7-channel Honeywell visicorder. For chosen SO that both symmetrical and unsymmetrical each test the quality of signals was examined in
transverse modes of vibration of the bridge could be some detail and the peak amplitudes and phase
readily excited. between signals were determined for each frequency.
Ten dynamic tests were carried out. The shaker An example of signals displayed in this manner is location, amplitude of the shaker force, frequency shown in Fig. 7. The transition from one frequency range, and transducer layout for each of the ten to the next is discernible where there is a change in tests are listed in Table 1. Tests 1 and 2 were pre- signal amplitude. Initially, an attempt was made to liminary, and were used to check the operation of all obtain rms amplitudes and phase using a wave analy- instrumentation and to locate, approximately, the ser, but this was ineffective and was abandoned. natural frequencies of the lower modes of vibration.
The results of these tests are therefore not presented.
Test 7 was a repetition of test 3, except that it was Results performed after the backfill at the east abutment had Trafic Vibrations
largely been removed. As there were no noticeable Examination of the vibration records showed that differences in the response of the bridge for the two in run 1 the peaks of several transducer signals were tests, the results of test 7 are also omitted. repeatedly clipped owing to overloading of the tape For each test the root mean square (rms) output recorder. This affects the amplitudes of the Fourier of one of the MB transducers was displayed on a spectrum of the clipped signal and will be discussed strip chart recorder (1) to select appropriate fre- later.
RAINER A N D PERNICA 45 1 TABLE 1. Test schedule for forced harmonic vibrations
Shaker force
Frequency Shaker Transducer
Test Peak-to-peak range * location layout
No. (Ib) (N) Hz (Fig. 5) (Fig. 5) Remarks
1 1500 6 700 4-1 5 1 A Trial runs, results
2 2500 11 100 4-15 1 A not evaluated 3 4000 17 800 4-1 5 1 A 3A 4000 17 800 15-23 1 A 4A 4000 17 800 4-1 5-23 1 B 4B 2000 8 900 4-1 5-23 1 B 4C 5500 24 500 4-1 5-23 1 B 5 4000 17 800 4-15-23 2 B 6 4000 17 800 4-1 5-23 2 A 7 4000 17 800 4-1 5 I A Repetition of test 3 after removal of fill *The instrument panel of the shaker required a change in frequency range at 15 Hz.
I 5 . 6 5 H z I 5 . 70 H z I V E L O C I T Y S C A L E i n . I s ( m m l s ) S T A T I O N I S T A T I O N L
'A
FIG. 7. Bridge response to shaker excitation, test 6.
The Fourier amplitude spectrum for station 3, run 1, is shown in Fig. 8. Figure 9 a and b shows the I spectra for the addition and subtraction of signals from stations 3 and 6, from which the in-phase or out-of-phase relation of the two stations was deter-
I mined for each mode of vibration.
The Fourier amplitude spectrum for station 3, run 4, is shown in Fig. 10. The two peaks at 2.7 and 13.5 Hz are surmised to have been caused by con- struction machinery operating nearby since they are present only in the traffic vibration spectra of run 4. It is also possible that the two peaks represent vehicle suspension resonances. A summary of the natural frequencies derived from the traffic vibration measurements is given in Table 2.
Forced Harmonic Vibrations
Representative results from the forced vibration tests are presented in the frequency-amplitude curves of Figs. 11 and 12. The transducer station and the test number are contained in the caption or labelling of each diagram. The natural modes of vibration of the bridge were determined from these frequency-amplitude curves and from the phase relations of station signals. The natural frequencies are summarized in Table 2 and the associated modes of vibration of the bridge deck are presented in Fig. 13 a-e. Alongside.each two-dimensional mode shape of the bridge deck are shown the corresponding modal amplitudes along the transverse centreline connecting stations U and L.
452 CAN. J . CIV. ENG. VOL. 6,1979 1 5 u 0 3 ; I 0 2 a 5 I I I I -
Jbdk5
I 0 I I-
0 = + < ? 0 5 - OoJfJ'& i0 5 : FREQUENCY H zFIG. 10. Fourier spectrum of traffic vibrations, run 4,
station 3, centre span, north sidewalk.
FREQUENCY Hz I
FIG. 8. Fourier spectrum of traffic vibrations, run 1, station two modes are very close, the value of the modal
,
3, centre span, north sidewalk. damping ratio computed for either or both of the
closely spaced modes may be somewhat less reliable than that of well-spaced modes. This is the case for
1 5 I I
;JLYk+
mode 2, although not for mode 1, in the frequency-
i
: l o
2 0 5
10
amplitude curves of the forced vibration tests. Because signals from a symmetrically placed trans- ducer station such as station K do not contain significant contributions of antisymmetric modes, the resonant peak for mode 1 (Fig. 1 lb), a symmetric mode, is virtually free of interference from mode 2, an antisymmetric mode. Unfortunately, no data were available from the forced vibration tests that would have eliminated this effect for mode 2. If a sym-
I
FREQUENCY. Hz metrical placement of transducers relative to the
longitudinal bridge centreline had been employed
2 o I
.
with shaker location 2, resonant peaks of all sym--
*
-
z l o - a
metrical modes could have been eliminated by subtracting the signals from the symmetrically placed transducers, leaving only the resonant peaks of the antisymmetric modes. This was demonstrated % ", > - < d ", E o I I
-
(b)for the traffic vibration spectra in Fig. 9 a and b. Damping ratios for run 1 (traffic vibrations) were calculated from Fig. 9 a and b, which contains the
-
5 10 15 20 spectra obtained from the addition and subtraction F R E Q U E N C Y HZ
of the signals from stations 3 and 6. Both spectra
FIG. 9. ( a ) Fourier spectrum of sum of signals from stations have almost no modal interference; stations 3 and 6
3 and 6, run 1 . (b) Fourier spectrum of difference of signals are located on the transverse centreline on opposite
from stations 3 and 6, run 1. sides of the bridge. As station 6 was not recorded,
Damping Ratio it was not possible to employ a similar technique for
A modal damping ratio for each natural mode was the data from run 4. Thus, the damping ratios of determined from both the forced vibration data and modes 1 and 2, obtained from the Fourier amplitude traffic data, using the half-power bandwidth relation spectrum of station 3 (Fig. 10) may have been
affected by the interference between these modes. hi = Afi/2fi
Although the damping ratios from run 1 were not where
h i
is the damping ratio; f i is the natural influenced by modal interference, they may havefrequency; Afi is the frequency bandwidth at 0.707 been affected by signal clipping that occurred during times the peak amplitude Ai; and subscript i refers tape recording. A clipped signal results in a smaller to the ith mode. For the forced vibration tests Ai is Fourier amplitude at frequencies that contribute the amplitude atf, in the frequency-amplitude curve, significantly to the amplitude of the signal. As the and for the traffic vibration tests
A i
is the Fourier ratio is calculated from the width of the spectrumspectrum amplitude at f,. peak at 0.707 of peak amplitude, a lowering of the As the widths of resonant peaks are affected when peak will result in a slightly higher damping ratio
RAINER A N D PERNICA 453
TABLE 2. Modal properties as determined from forced harmonic vibration tests and
vibrations induced by traffic
Forced harmonic vibrations Traffic vibrations
Damping ratio
Damping (% critical)
Frequency ratio Frequency
Mode (Hz) (% critical) (Hz) Run 1 Run 4
than would otherwise have been obtained. It is judged, however, that for run 1 the calculated damping values are overestimated by not more than about 10%. The modal damping ratios calculated from runs 1 and 4 are given in Table 2.
For symmetric modes 1, 3, and 5 (forced harmonic vibrations) only amplitude-frequency curves for station K and shaker location 1 were used to cal- culate the modal damping ratios. -These were the curves judged to be essentially free of interference from adjacent modes (see Fig. 1 lb). Table 2 contains a summary of the modal damping ratios determined from the forced vibration tests.
Discussion of Results
In the forced vibration tests two shaker locations, one on the longitudinal centreline of the bridge and the other to one side of the centreline, were chosen so that all significant symmetrical and antisymmetrical transverse modes of vibration of the bridge would be readily excited. The necessity of selecting two such lo- cations of excitation can be seen from the amplitude- frequency curves. With the shaker at location 1 the amplitude-frequency curves in Fig. 11 a and b show an almost complete absence of the transverse anti-
I
symmetrical modes at 6.3 and 12.0 Hz. As location 1 was on the longitudinal centreline of the bridge, the two antisymmetrical modes were barely detectableI (Fig. 13 b, d). When the shaker was moved to
location 2, to one side of the longitudinal centreline, the two transverse antisymmetrical modes were easily excited (Fig. 12 a, b).
This consideration does not arise with traffic- induced vibrations because it is more than likely that all significant modes of vibration are excited by the usual mix of vehicle type, speed, driving path, direction of travel, and impact of vehicles on entering and leaving the bridge. For both the forced vibration
0 1 I I I I I I I
la) -
S H A K E R L O C A T I O N 1
F R E Q U E N C Y . H z
FIG. 11. (a) Frequency response curve for station U, test 4B.
(b) Frequency response curve for station K, test 4C.
and traffic vibration tests, however, it is still possible that a significant natural frequency might go un- detected, even when excited, if too few transducer stations were used and if they all happened to be placed at or near modal nodes.
The Fourier amplitude spectra derived from the traffic vibrations and the amplitude-frequency curves
454 CAN. J . CPV. ENG. YOL. 6 , 1979 [I I I
i
l
I I I I-
1 ( 0 ) S H A X E ~ L D C ~ ~ ~ O Y a a000 I h T l P C t P t * t - t O . P I * I :-
* - ' < - ' & - 3 : - M O D A L A M P L I T U D E S F R O M T R A F F I C V I B R A T I O N S 0 S H A K E R T E S T S I ? 10 12 14 16 16 PC 22 !1 F R E Q U E N C Y H z I 1 . 4 I I I I I ' I I T It (b) 4 6 A h l t P 1OChllOll 1 400a II i D R C t m t h l - l O , ? t t l - I P I-
I
- I \ - 6 z \ 5 o n -n
- ,
i-
,i
I - I F R E Q U E N C Y HzFIG. 12. (a) Frequency response curve for station X, test 5.
(b) Frequency response curve for station AA, test 5.
for the forced vibration tests for shaker location 2 Id)
are qualitatively similar throughout the given frequency range. This similarity is especially striking when results for comparable transducer stations are examined, (for example, station 3, Figs. 8, 10; station AA, Fig. 12b).
The mode shapes and modal frequencies deter- mined from the forced vibration tests demonstrate
the two-dimensional nature of the bridge deck. &
Except for mode 5, the mode shapes of the deck in
the longitudinal direction are similar to the funda- mental mode shape of a three-span beam element; in the transverse direction the deck has a mode shape that contains the number of nodes corres- ponding to the mode number. The two-dimensional nature of the bridge deck is also demonstrated by the sequence of modal frequencies, since they are more
closely spaced than would be the case for one- FIG. 13. Mode shapes of bridge deck. (a) Mode 1 : 5.7 Hz.
dimensional deck behaviour. B~~~~~~ of this ,.lose
(4
Mode 2: 6.4 Hz. (4 Mode 3: 8.7 Hz. (4 Mode 4: 12.0 Hz.(e) Mode 5: 17.4 Hz.
spacing, the contribution of modes other than the
fundamental should also be considered when the natural frequencies of the lower modes of vibration
response of the bridge deck to dynamic loads from for both the traffic and forced vibration tests are
traffic, earthquakes, etc., is calculated. virtually the same. For higher modes, however, the
KAINER A N D PERNICA 455 are slightly lower than those from thd forced vibra-
tion tests. This could be attributed to the slight increase in the modal masses of the bridge as a result of the vehicle loads. As the equivalent modal mass for the higher modes is smaller than that for the lower ones, the additional mass from travelling vehicles would have a greater effect on the higher modal frequencies than on the lower ones. For this bridge the differences in modal frequencies for the two test procedures were not that significant.
For
other bridges this could change, however, depending on the size of the bridge and the type of traffic moving across it. A preponderance of heavy vehicles across this bridge might aIso have produced some diKerences in the natural frequencies of the lower modes.The damping ratios derived from the traffic and forced vibration tests, although not identical, are quite similar in magnitude. Damping ratios from run 1 of the traffic vibrations tend to be somewhat larger than those from the forced vibration tests. This may, in part, be a result of signal clipping that occurred during the recording stage.
The modal amplitudes, as determined from both the traffic and forced vibration tests, indicate that the south side of the bridge has larger centre-span modal amplitudes than the north side. A similar trend can be observed in the side-span modal amplitudes at stations M and N. This difference is most pronounced in mode 1, Fig. 13. It appears from these results that the north side of the bridge deck has stiffness properties slightly different from those of the south side. This could be due to differ- ences in the posttensioning system or to differences in abutment anchorages of the bridge.
Conclusions
Dynamic tests conducted on the Ottawa River Parkway Service Road Bridge demonstrate the following.
• 1. The dynamic properties (natural frequencies, mode shapes, and modal damping ratios) of this type of bridge structure can readily be determined by
1
forced harmonic vibration tests using a shaker that generates a sinusoidal force with controlled fre- quency and amplitude. Care needs to be exercised in the choice of shaker location and transducer layout if one wishes to obtain a complete set of natural modes of vibration.2. The natural modes of vibration identified for this bridge have mode shapes that depend, to a large
extent, on the transverse properties of the bridge. This results in a number of modes of vibration having natural frequencies close to that of the fundamental. Because of this close spacing of modes, it is necessary to consider the contribution of these lower modes, in addition to the fundamental, when the response of the bridge to traffic or to other types of dynamic loading is determined.
3. Natural frequencies obtained from traffic vibration tests agree closely with those from the forced harmonic vibration tests. Mode shape com- parisons were not possible because traffic measure- ments were not conducted in sufficient detail. There is every indication, however, that a full set of dynamic properties could also be obtained from traffic vi- bration tests. As these are simpler to perform than forced harmonic vibration tests, they could be used to advantage in many practical situations in deter- mining the dynamic properties of similar types of bridges. The effect of vehicular mass on the dynamic properties of the bridge and the presence of spurious frequency peaks in the Fourier amplitude spectra from sources such as nearby construction machinery, traffic, or instrumentation characteristics need to be considered in interpreting the results.
4. Modal damping ratios derived from the forced vibration tests and traffic vibration tests are quite similar in magnitude.
Acknowledgement
Permission to perform tests on the Ottawa River Parkway Service Road Bridge was given by the owners of the bridge, the Department of Public Works of Canada (DPW); the cooperation of the bridge design section of DPW is gratefully acknowl- edged. The tests were conducted with the help of members of the staff of the Division of Building Research: E. C. Rowe, E. C. Luctkar, R. G. Diment, D. W. Monk, and W. von Tobel. Transportation of the shaker system and ancillary equipment to the bridge site, drilling of concrete core samples from the bridge deck, and attachment of the shaker to the deck were performed by Plant Engineering, NRCC. The cooperation, also, of M. M. Dillon Ltd., Ottawa, designers of the Service Road Bridge, and of Demers-Parker Ltd., consulting engineers for the Portage Bridge, is gratefully acknowledged.
This paper is a contribution from the Division of Building Research, National Research Council of Canada, and is published with the approval of the Director of the Division.