Publisher’s version / Version de l'éditeur: Building Practice Note, 1985-07-01
READ THESE TERMS AND CONDITIONS CAREFULLY BEFORE USING THIS WEBSITE.
https://nrc-publications.canada.ca/eng/copyright
Vous avez des questions? Nous pouvons vous aider. Pour communiquer directement avec un auteur, consultez la
première page de la revue dans laquelle son article a été publié afin de trouver ses coordonnées. Si vous n’arrivez pas à les repérer, communiquez avec nous à PublicationsArchive-ArchivesPublications@nrc-cnrc.gc.ca.
Questions? Contact the NRC Publications Archive team at
PublicationsArchive-ArchivesPublications@nrc-cnrc.gc.ca. If you wish to email the authors directly, please see the first page of the publication for their contact information.
NRC Publications Archive
Archives des publications du CNRC
For the publisher’s version, please access the DOI link below./ Pour consulter la version de l’éditeur, utilisez le lien DOI ci-dessous.
https://doi.org/10.4224/20378984
Access and use of this website and the material on it are subject to the Terms and Conditions set forth at
Energy considerations in the design of northern housing
Larsson, N. K.
https://publications-cnrc.canada.ca/fra/droits
L’accès à ce site Web et l’utilisation de son contenu sont assujettis aux conditions présentées dans le site LISEZ CES CONDITIONS ATTENTIVEMENT AVANT D’UTILISER CE SITE WEB.
NRC Publications Record / Notice d'Archives des publications de CNRC: https://nrc-publications.canada.ca/eng/view/object/?id=9127a53d-9e1b-4a07-a922-96b839507b2b https://publications-cnrc.canada.ca/fra/voir/objet/?id=9127a53d-9e1b-4a07-a922-96b839507b2b
ENERGY CONSIDERATIONS IN THE DESIGN OF
NORTHERN HOUSING
zyxwvutsrqponmlkjihgfedcbaZYXWVUTSRQPONMLKJIHGFEDCBA
by N.K. Larsson
BPN 55 July 1985
@National Research Council Canada 1985 ISSN 0701-5216
TABLE OF CONTENTS
zyxwvutsrqponmlkjihgfedcbaZYXWVUTSRQPONMLKJIHGFEDCBA
..
zyxwvutsrqponmlkjihgfedcbaZYXWVUTSRQPONMLKJIHGFEDCBA
FOREWORD
. . .
11PREFACE
. . .
111A WORKING DEFINITION O F THE NORTH
. . . 2
CLIMATIC CONDITIONS
. . .
3EXISTING PATTERNS O F ENERGY CONSUMPTION AND COSTS
. . . 7
VENTILATION AND AIR EXCHANGE
. . .
11THE BUILDING ENVELOPE
. . .
17WINDOWS. DOORS AND OTHER OPENINGS
. . .
20HEATING SYSTEMS AND EQUIPMENT
. . .
22OTHER ENERGY ISSUES
. . .
25CURRENT PRACTICE I N THE DESIGN O F THE BUILDING ENVELOPE
. . .
27CONCLUSIONS
. . .
30REFERENCES
. . .
31...
FOREWORD
zyxwvutsrqponmlkjihgfedcbaZYXWVUTSRQPONMLKJIHGFEDCBA
During the preparation of the Measures for Energy-Efficient Northern Housing it became clear that many problems with northern construction had not been resolved. The basic principles of satisfactory design and construction were either not known or not sufficiently well developed as to avoid differing interpretation. In addition, some designers lack either adequate understanding of fundamental principles or of the application of these principles to northern conditions. Many design and construction practices that are satisfactory for southern Canada, even in the coldest locations, do not work in the North.
Thus a consensus developed among those preparing the “Northern Measures” that the time is not ripe for mandatory requirements to be laid down; for this reason the Northern Measures are being issued by Energy, Mines and Resources Canada on a trial basis as an advisory document.
A need was also recognized for a handbook setting out in non-legal terms what is con- sidered to be good practice. Since it would not be in code form, such a handbook could give an explanation of the good or bad aspects of design and explore the dilemmas that confront the designer. Canada Mortgage and Housing Corporation, Indian and Northern Affairs Canada, and the Division of Building Research of the National Research Coun- cil Canada agreed to collaborate in the preparation of such a publication, to be called A
Handbook of Northern Canadian Residential Building Practice. As a contribution towards the preparation of this handbook, DBR/NRCC is preparing a number of technical papers discussing a variety of topics from a northern point of view. These are to be published individually as they become available.
This Building Practice Note has been prepared by N.K. Larsson Consulting Ltd., under contract to DBR, as one of these papers. Comments on it would be welcomed and should be sent to:
J.K.
Latta, HeadBuilding Performance Section Division of Building Research National Research Council Canada Montreal Road, Building M-20 Ottawa, Ontario K1A OR6
L.W.
GoldAssociate Director DBR/NRCC
zyxwvutsrqponmlkjihgfedcbaZYXWVUTSRQPONMLKJIHGFEDCBA
..
zyxwvutsrqponmlkjihgfedcbaZYXWVUTSRQPONMLKJIHGFEDCBA
PREFACE
zyxwvutsrqponmlkjihgfedcbaZYXWVUTSRQPONMLKJIHGFEDCBA
It would clearly be very ambitious to attempt to discuss northern housing energy issues in a comprehensive way. This paper makes no such claim, and should rather be seen as an attempt to touch on broad issues that are unique to housing design in the North. The author has also attempted to raise certain issues that require further discussion, notably the role of solar gain and actual infiltration rates under northern conditions.
The author also wishes to express his reluctance to make pronouncements about northern conditions from the vantage point of an Ottawa office, but it is hoped that the report will be accepted by northern designers in the spirit in which it is offered, as the start
of
a more intense dialogue on northern technical issues.Nils
K.
Larsson, MRAICzyxwvutsrqponmlkjihgfedcbaZYXWVUTSRQPONMLKJIHGFEDCBA
ABSTRACT
zyxwvutsrqponmlkjihgfedcbaZYXWVUTSRQPONMLKJIHGFEDCBA
The severe climatic conditions in the North (the region north of the southern limit of scat-tered discontinuous permafrost) and the high energy costs and consumption in northern housing are discussed. Ventilation and air exchange issues are reviewed in the context of
current norms and standards. Formulae for air infiltration are applied to “tight” buildings in severe northern conditions; these indicate very high rates of air exchange. The combi- nation of mechanical ventilation and natural air infiltration during severe conditions may result in an unexpectedly high rate of total air exchange. Northern construction issues are outlined in the context of energy conservation, and the characteristics of typical heating and heat recovery equipment are discussed. An overview of other energy issues is also provided. Current practices in the design of the building envelope in northern housing are
described.
zyxwvutsrqponmlkjihgfedcbaZYXWVUTSRQPONMLKJIHGFEDCBA
RESUME
Cette communication traite des conditions climatiques rigoureuses dans le Nord (zone situke au nord de la limite sud du pergCliso1 de transition sporadique) ainsi que du coQt et de la consommation d’knergie trks dlev6s dans ces rdgions. Les questions de ventilation et de renouvellement d’air y sont examindes ti la lumikre des normes actuelles. Des formules
permettant de calculer l’infiltration de l’air dans des biitiments “dtanches”
,
zyxwvutsrqponmlkjihgfedcbaZYXWVUTSRQPONMLKJIHGFEDCBA
construits dans ces rdgions froides, indiquent des taux trks klevks de renouvellement de l’air. Leseffets combin& de la ventilation et de l’infiltration naturelle de l’air dans ces conditions rigoureuses peuvent se solder par un taux de renouvellement d’air beaucoup plus Clev6 qu’on ne l’aurait escomptd. L’auteur passe bricvement en revue, dans l’optique de la conservation de l’dnergie, les probkmes de construction particuliers aux rCgions nordiques, et discute des caractCristiques des installations types de chauffage et de rdcupkration de la chaleur. I1 aborde dgalement d’autres questions knergdtiques et ddcrit les techniques actuelles de conception de l’enveloppe des biitiments des rdgions nordiques.
A WORKING DEFINITION OF THE NORTH
zyxwvutsrqponmlkjihgfedcbaZYXWVUTSRQPONMLKJIHGFEDCBA
The terms “North” and “northern housing” are frequently used in this report. Although some would argue that all Canadian locat,ions are northern, the extreme cold and per- mafrost soils are clearly different from conditions in most parts of the Provinces. A docu- ment has recently been published by Energy, Mines and Resources Canada, which provides suggested design and construction requirements for this type of environment. The Mea-
sures for Energy-Efficient Northern Housing
zyxwvutsrqponmlkjihgfedcbaZYXWVUTSRQPONMLKJIHGFEDCBA
[l], or the Northern Measures, as it is more commonly called, adopted the definition of the North as the area north of the southern limitof the zone of scattered discontinuous permafrost, and this study uses the same definition.
u s
zyxwvutsrqponmlkjihgfedcbaZYXWVUTSRQPONMLKJIHGFEDCBA
I S
As
zyxwvutsrqponmlkjihgfedcbaZYXWVUTSRQPONMLKJIHGFEDCBA
Figure 1 indicates, the area in question t,akes in all parts of the two Territories and a significant, portion of the provinces, but the line is not exact. The boundary line of thearea bears some relationship to the isotherms of mean annual air temperature, but the relationship is by no means perfect.
Identification of the population and number of dwellings that lie within the permafrost zone is difficult, since the calculation involves defining the specific sub-areas for each province that lie within the zone. Data for the number of dwellings in the permafrost, regions of provinces (Table 1) are therefore only approximate; this figure is based on interpolations of data at the Census Division level. The provincial figure should therefore be considered only as an indication of the order of magnitude.
Table 1. Estimated total occupied dwellings in permafrost zone, 1981* N W T Yukon Provinces Urban areas 10000
zyxwvutsrqponmlkjihgfedcbaZYXWVUTSRQPONMLKJIHGFEDCBA
+
0 5065 5000-9999 6985 0 2500-4999 3250 0 1000-2499 1850 0 Rural non-farm 4965 2830 Rural farm 5 0 Total 11 955 7900 50 000+/-
*Statistics Canada, Occupied Private Dwellings, and Census Divisions, 1981.
Despite the uncertainty in the provincial figures, it is evident that approximately 70 000 dwelling units may lie within the zone in question. Not all of these dwellings are located on permafrost soils, but all are exposed to the severe climatic conditions outlined in the following section.
CLIMATIC CONDITIONS
Temperature and Heating Degree Days
A major factor in high energy consumption in the North is the climate, but this all- embracing term includes many factors that need specification.
One measure of the severity of the climate is the number of heating degree days in northern communities. The heating degree day
(HDD)
measure is defined as the difference between the daily mean temperature for that day and a reference temperature of 18°C. Data is available in both tabular 131 and map form for the degree day regime of most Canadian locations. The following examples ofHDD
data and January 2%
design temperatures give an indication of the range ofHDD
variation between northern and southern communities.Table 2 Heating degree days and design temperatures for selected communities
zyxwvutsrqponmlkjihgfedcbaZYXWVUTSRQPONMLKJIHGFEDCBA
[3] Design temperatureNorthern Communities HDD, “ C Jan. Si%,OC Whitehorse Teslin Labrador City Dawson Yellowknife Churchill Frobisher Bay Inuvik Eureka Southern Communities 6878 7121 7770 8272 8591 9214 9844 10174 13612 -41 -41
zyxwvutsrqponmlkjihgfedcbaZYXWVUTSRQPONMLKJIHGFEDCBA
- 35 - 50 - 43 - 39 - 40 - 46 - 47 Sidney B.C. Vancouver Toronto Ottawa Edmonton Winnipeg Saskatoon 2800 3005 4082 4674 5590 5887 6077 -6 -7 -18 - 25 - 32 -33 - 35zyxwvutsrqponmlkjihgfedcbaZYXWVUTSRQPONMLKJIHGFEDCBA
The minimum design temperature (January 1% or 2;%) is an important factor in de- termining the capacities of heating systems, but the design temperature correlates only approximately with differences in degree days. Dawson is a clear example of a marked deviation in this respect.
Solar Radiation
The availability of solar radiation is important in determining the feasibility of using a
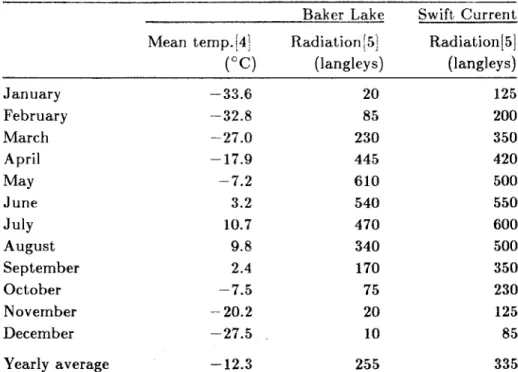
solar design approach. Although there is a generally accepted notion that there is little solar radiation available in the North during the heating season, the following data, which provide comparisons of Baker Lake (64O18/N7 HDD 11012) with the southern community of Swift Current (50°10’N, HDD 5483) give an indication that there may be potential for a selective approach.
As Table 3 indicates, daily global solar radiation, averaged over the year, is considerably less in the northern community than in the southern one; but the yearly average masks the fact that Baker Lake receives considerable amounts of solar radiation in spring and summer (March to August), and very little during winter months.
Table 3 Approximate mean daily global solar radiation
and mean daily temperature for 2 communities
zyxwvutsrqponmlkjihgfedcbaZYXWVUTSRQPONMLKJIHGFEDCBA
[4,5]Baker Lake Swift. Current
Mean temp. 141 Radiation [5] Radiation [
zyxwvutsrqponmlkjihgfedcbaZYXWVUTSRQPONMLKJIHGFEDCBA
51 (langleys) (langleys) January February March April June July August September October November December Yearly average May -33.6 -32.8 -27.0 - 17.9 -7.2 3.2 10.7 9.8 2.4 - 7.5 - 20.2 -27.5 - 12.3 20 85 230 445 610 540 470 340 170 75 20 10 255 125 200 350 420 500 550 600 500 350 230 125 85 335Note: Radiation data interpolated from isobar charts in source.[5]
zyxwvutsrqponmlkjihgfedcbaZYXWVUTSRQPONMLKJIHGFEDCBA
It is unfortunate that the net gain that might be expected through a south-facing window cannot be estimated from these data, since separate readings for direct and diffuse radiation would be required. In relating the radiation and temperature data for Baker Lake, however, it is clear that the combination of relatively high levels of global radiation and low outdoor temperatures indicates a potential for making effective use of solar radiation for space heating purposes a t least during the March to June period.
In summary, the very uneven distribution of sunshine hours and solar radiation in northern areas means that southern-type passive designs, which are based on a premise of consider- able solar assist during the winter months, are not appropriate for the far North. A passive solar strategy for the North should therefore be based on the following general parameters. An emphasis should be placed on designing for solar assist during the spring months, when a considerable demand for space heating coincides with significant amounts of solar radiation. This implies the use of south-facing glazing, combined with a relatively open plan or a mechanical heat-distribution system to prevent excessive temperature swings.
Insulating shutters or blinds should be installed to account for the fall and winter conditions of high radiative heat loss and little or no solar radiation. The use of external shutters should be considered.
Measures may be needed to reduce occasional overheating or excessive brightness during the summer.
1. 2.
Wind and Precipitation
zyxwvutsrqponmlkjihgfedcbaZYXWVUTSRQPONMLKJIHGFEDCBA
The Supplement to the Xational Building Code contains design data tables that include ground snow loads and hourly wind pressure5. These data are based on records of precip- itation and wind velocities that have one chance in 10, 30 or 100 of being exceeded in any one year. The following data for 1/30 ground snow loads and wind pressures in selected communities are taken from the NBC Table and also show wind speeds corresponding to the given wind pressures. Both sets of data indicate conditions that are exceptional.
Table
zyxwvutsrqponmlkjihgfedcbaZYXWVUTSRQPONMLKJIHGFEDCBA
4 indicates that ground snow loads show a wider range of variation in southern Canada than in the North. Maximum wind speeds in the N W T are more variable thanin the South or the Yukon, and higher wind speeds are reached in the NWT. The global impact of this is somewhat mitigated, from the national point of view, by the fact that the
NWT communities with high wind speeds tend to be small settlements. The fact remains that buildings located in these communities may be exposed to very severe wind pressures. Even if these are exceptional circumstances (1/30 chance in a year) having little impact on seasonal energy consumption, they do create a challenge in preventing physical damage which could subsequently cause high energy losses.
Table 4 Ground snow loads, maximum wind speeds and wind pressures for selected communities[3]
Ground snow load Wind pressure Wind speed Northern Communities kPa k Pa km/h Dawson Whitehorse Destruction Bay Hay River Fort Smith Yellowknife Inuvik Frobisher Bay Isac hsen Resolution Island Coral Harbour Southern Communities 2.6 1.7 2.6 2.6 2.0 2.0 2.2 2.2 1.3 4.6 3.1 0.24 0.34 0.35 0.32 0.37 0.43 0.55 0.69 0.83 1.10 1.20 68 83 83 79 86 94 104 119 130 148 155 Kenora Melfort Edmonton Swift Current Argentia Port Cartier Gaspk 3.1 0.24 68 2.4 0.32 79 1.5 0.40 90 1.2 0.56 104 2.0 0.69 119 5.7 0.83 130 5.8 0.98 140
zyxwvutsrqponmlkjihgfedcbaZYXWVUTSRQPONMLKJIHGFEDCBA
EXISTING PATTERNS OF ENERGY CONSUMPTION AND COSTS
As
zyxwvutsrqponmlkjihgfedcbaZYXWVUTSRQPONMLKJIHGFEDCBA
expected, energy consumption and costs are higher in the North than in the South, butit is commonly held that act,ual levels are out of proportion with the difference in climatic conditions. This assumption is open to question.
Current Levels of Energy Consumption
In Qukbec, almost all housing in northern settlements is owned and operated by the Soci6t6 d’Habitation du Qukbec (SHQ). The SHQ estimates that public housing north of the 55th parallel constitutes about 2% of the total Qudbec public housing stock, but accounts for about 10% of the energy costs (J. Desbiens, SHQ, personal communication). A typical SHQ unit in the South consumes about 0 . 7 G J / m 2 per year, whereas a northern unit consumes about 2.65 G J / m 2 per year.
Data on the number and energy consumption of housing units located north of the dis- continuous permafrost line in other provinces are not available, and few reliable data are available on the energy consumption levels of the existing housing stock in the NWT or the Yukon, except for units administered by Public Works Canada (PWC). PWC operates “Crown Housing”, units that are leased to other Federal departments. Records are avail- able, since PWC pays for energy costs and subsequently charges the client departments. In reviewing the following data on Crown Housing energy consumption, it should be re- called that part of the high cost is due to charges for electricity, and that space heating
consumption accounts for about
zyxwvutsrqponmlkjihgfedcbaZYXWVUTSRQPONMLKJIHGFEDCBA
75% of the total.Table 5 Annual energy consumption of Crown Housing units, 1983”
Average consumption Location No. Units Area, m2 $/unit $/m2 GJ/unit GJ/m2 Inuvik 359 36706 6227 60.90 239 2.34 Yellowknife 400 32857 2392 29.11 170 2.07 Norman Wells 31 5117 4609 27.92 207 1.25 Frobisher Bay 116 7374 5624 88.76 169 2.65 Fort Smith 64 7356 2320 20.19 202 1.76 Hay River 55 5503 4154 41.50 301 3.01 Pine Point 10 1037 3835 36.98 285 2.75 Fort Simpson 44 5620 6590 51.59 271 2.12 Total/Average 1079 101570 4313 45.81 209 2.21
*Source: A. Greiner, Public Works Canada, Ottawa.
Other northern data are also available. A 1981 NWT Science Advisory Board report [6]
provided energy consumption data for 849 NWT Government and 3774 Northwest Ter- ritories Housing Corporation (NWTHC) units in 47 communities. The findings can be summarized as follows (units of measurement have been modified),
Table 6 Annual energy consumption of NWT staff and NWTHC units, 1979*
zyxwvutsrqponmlkjihgfedcbaZYXWVUTSRQPONMLKJIHGFEDCBA
_ _
_ _ _
zyxwvutsrqponmlkjihgfedcbaZYXWVUTSRQPONMLKJIHGFEDCBA
total energy consumption
total energy consumptior1 = 280 C J 'unit
1.293 821 G J for 4623 units
electrical consumption = 66 GJjunit (23%)
oil consumption = 214 G J / u n i t (77%) *Source: A. Greiner, Public Works Canada, Ottawa.
Although the actual energy consumption of a building depends on several factors, con- sumption is closely correlated with the number of annual heating degree days (HDD). For example, a recent NRC study of 1478 houses in Saskatchewan concluded that the
.HDD
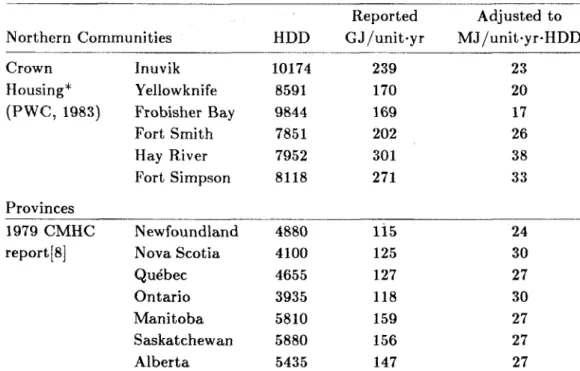
explained the variation in fuel consumption to a satisfactory level in 92% of cases 171. Ta- ble 7 relates northern energy consumption figures to the HDD of various locations, and provides a useful comparison with southern housing.
Table 7 Approximate reported total energy consumption in Southern and Northern Housing
Reported Adjusted t o Northern Communities HDD GJ/unit-yr MJ/unit-yr-HDD
Crown Inuvik 10174 239 23 Housing* Yellowknife 8591 170 20 (PWC, 1983) Frobisher Bay 9844 169 17 Fort Smith 785 1 202 26 Hay River 7952 30 1 38 Fort Simpson 8118 271 33 Provinces 1979 CMHC Newfoundland 4880 i i 5 24
report [8] Nova Scotia 4100 125 30
QuCbec 4655 127 27
Ontario 3935 118 30
Manitoba 5810 159 27
Saskatchewan 5880 156 27
Alberta 5435 147 27
*Source: A. Greiner, Public Works Canada, Ottawa. HDD for provinces were converted
from estimates of degree days Fahrenheit provincial averages developed in the CMHC report.
The results are unexpected. The adjusted energy consumption figures for northern lo- cations are similar or lower than those for southern communities, which runs counter to
the popular viewpoint that the existing northern housing stock is inferior to the southern housing stock in construction quality and performance. Caution must be used in interpret- ing the data, however, since heating degree days are not the only climatic factor affecting energy consumption. The comparison also neglects differences in the characteristics of the
&-as-
zyxwvutsrqponmlkjihgfedcbaZYXWVUTSRQPONMLKJIHGFEDCBA
.... .
, .
... . . . I
zyxwvutsrqponmlkjihgfedcbaZYXWVUTSRQPONMLKJIHGFEDCBA
.. . .zyxwvutsrqponmlkjihgfedcbaZYXWVUTSRQPONMLKJIHGFEDCBA
housing stock, such as size and age (the CMHC data includes pre-war housing stock). On the other hand. the PWC data cover all units built in the post-war period and most of the energy supplied t o these units is in the form of oil: which should lower their energy performance. Furthermore, wind conditions are generally more severe and the amount of
usuable solar radiation in the North is less during the heating season, two factors which would tend to increase total energy consumption in northern units, relative t o comparable southern units.
The rate of energy consumption in northern housing, relative to t1ia.t of southern housing, appears to be in line with the climatic conditions. The high unit, cost of energy, however, combines with the high absolute levels of energy consumption to make the total cost of
purchased energy very high.
zyxwvutsrqponmlkjihgfedcbaZYXWVUTSRQPONMLKJIHGFEDCBA
Causes of High Energy Costs
Specific reasons for high costs of residential energy in the North are complex, since there is much variation in the accessibility and conditions of individual communities. Given this qualification, the following factors appear to. be relevant.
High
fuel
costsElectrcity is used for space heating in some communities with access to a hydro grid, notably Whitehorse, but oil is the only practical form of fuel in remote locations with no hydro grid or natural gas. In such locations, diesel fuel is used to generate the electricity required for uses other than space heating, at a level of efficiency of only about 30%. The primary energy source for residential space heating in most northern settlements is oil, either P50/P40 oil used in space heaters, or No. 1 “Arctic” heating oil burned in oil
furnaces. The cost of transporting the oil results in very high retail costs in these com- munities. In many cases the costs to the consumer would be still higher were it not for a complex system of subsidies. The following selection of 1984 oil prices indicates that the cost of heating oil in the northern communities is generally high and is subject t o consid- erable variation. However, retail oil prices in Yellowknife and Whitehorse, communities which account for a substantial portion of the population of the Yukon and N W T , are close t o southern levels.
Table 8 A selection of estimated 1984 oil prices
zyxwvutsrqponmlkjihgfedcbaZYXWVUTSRQPONMLKJIHGFEDCBA
($/L)*
Community Wholesale Retail Whitehorse
Yellowknife Aklavik
Fort McPherson Arctic Red River Pangnirtung Tuktoyaktuk Raker Lake Cambridge Bay Pelly Bay Northern QuCbec Toron to Montreal Calgary Canadian Average 0.41 0.31 0.41 0.38 0.46 0.51 0.55 0.57 0.61 0.77 0.80 0.65 0.37 0.38 0.37 0.38
*Adapted from original data provided by
zyxwvutsrqponmlkjihgfedcbaZYXWVUTSRQPONMLKJIHGFEDCBA
N W T Department of Public Works. Southern prices supplied by Energy, Mines and Resources, Ottawa.The use of oil-burning equipment
High oil prices have a larger effect on total energy costs in the North than in the South because oil-fired space heating equipment is more prevalent. The following table, adapted from a 1984 report, illustrates the extent of this pattern.
Table 9 Distribution of residential heating fuels, 1981[9] NWT Yukon Canada Number of households 11 530 7 585 8 281 535
Percentage using
Oil or kerosene 82% 64% 34% Piped or bottled gas 4 2 38 Electricity 6 17 24 Other 8 18 4
The high cost of purchased energy is not only caused by the greater use of oil, but also by the relative inefficiency of domestic oil burning equipment as a means of converting this energy to space heating. Space heaters have been a common form of heating in the North and they operate a t efficiency levels of only about 40 to 70%, whereas current oil furnaces can operate at seasonal efficiencies of about 70 to 80%. Even though oil burning furnaces are greatly preferable to space heaters for safety reasons, they are more adversely affected by poor maintenance than are gas burners and, where the dwelling is well-insulated, a
lack of small oil-burning furnaces may lead to the insta.llation of oversized units which will
operate at low levels of efficiency.
zyxwvutsrqponmlkjihgfedcbaZYXWVUTSRQPONMLKJIHGFEDCBA
Lack of incentives to conserve energy
Another factor that helps to explain the high energy costs in NWT public housing is the lack of incentives for occupant,s to save energy, since rent payments include heating and
are based on income rather than actual opemting costs.
zyxwvutsrqponmlkjihgfedcbaZYXWVUTSRQPONMLKJIHGFEDCBA
Poor performance of the housing stock
An obvious reason for a high rate of energy consumption is a housing stock that has deteriorated in performance, or that was poorly constructed to begin with. In the North, as in the South, both problems are present. Much of the current public housing stock operated by the NWTHC or the Yukon Housing Corporation (YHC) was constructed in
an era of cheap oil, when 89 mm
zyxwvutsrqponmlkjihgfedcbaZYXWVUTSRQPONMLKJIHGFEDCBA
(4 in) stud walls were common, resulting in thermal resistance values of aboutRSI
2.2. New housing is built to a much higher standard, butit will take time before new or rehabilitated housing has an opportunity to affect average consump tion figures.
VENTILATION AND AIR EXCHANGE Ventilation Standards
Codes have traditionally relied on the looseness of the building envelope and on the open- ing of windows to provide enough fresh air for the occupants. With the advent of tight construction many authorities have begun to insist on the provision of mechanical venti- lation to assure adequate amounts of outdoor air. The 1985 National Building Code, for example, requires a ventilation system that can provide a minimum of one-half air change per hour (ac/h) to rooms or spaces.
Mechanical ventilation is especially important in the North, where windows may be inoper- ative during the cold months. In this situation the concern is not only that the occupants should have enough air and that contaminants be removed, but also that the building envelope not be damaged by an excessive buildup of humidity.
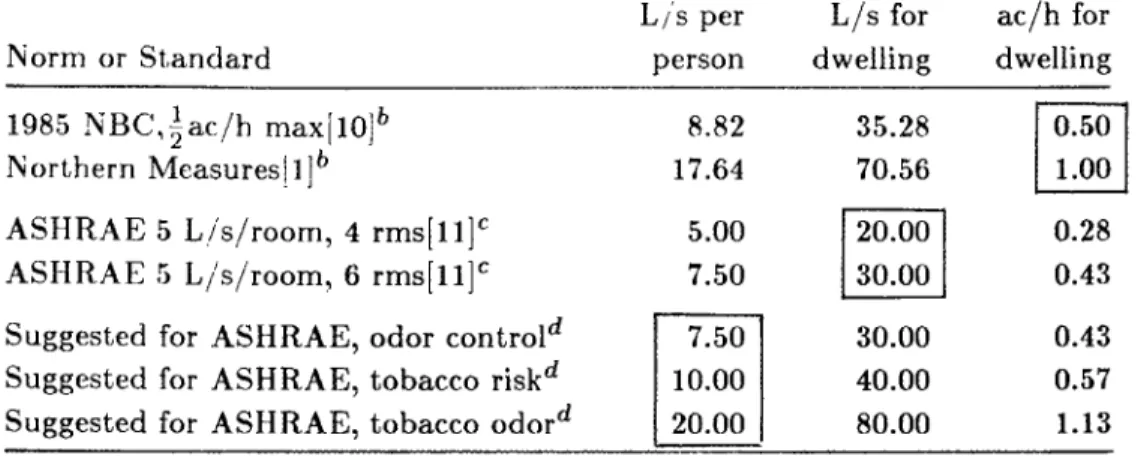
Some ventilation standards and norms are based on air change rates, while others are based on a minimum amount of fresh air per person or per room. Table 10 allows a comparison to be made between a number of existing and potential norms and standards, as applied to a conventional small house. The considerable variation in Table 10 underlines t h e relative lack of consensus on minimum ventilation rates. The figures do not take into account distribution to individual rooms, nor do they allow for air requirements of combustion equipment.
Table 10 Selected norms and standards for mechanical ventilation”
zyxwvutsrqponmlkjihgfedcbaZYXWVUTSRQPONMLKJIHGFEDCBA
L i s per L/s for ac/h for horm or Standard person dwelling dwelling 1985 NBC,$ac/h maxi10Ib 8.82 35.28
Eorthern Measuresl1jb 17.64 70.56 20.00 7.50
5.00
zyxwvutsrqponmlkjihgfedcbaZYXWVUTSRQPONMLKJIHGFEDCBA
[SI
30.00ASHRAE 5 Lis/room,
zyxwvutsrqponmlkjihgfedcbaZYXWVUTSRQPONMLKJIHGFEDCBA
4 rms[ll]‘ASHRAE
zyxwvutsrqponmlkjihgfedcbaZYXWVUTSRQPONMLKJIHGFEDCBA
5 Ljsjroom, 6 rms[llIc30.00 10.00 40.00 Suggested for ASHRAE, odor controld
Suggested for ASHRAE, tobacco riskd
0.28
0.43 0.43 0.57 Suggested for ASHRAE, tobacco odord 120.00
I
80.00 1.13boxed figures are the actual norm or requirement, others are resulting figures,
assuming a dwelling of 254 m3 with
zyxwvutsrqponmlkjihgfedcbaZYXWVUTSRQPONMLKJIHGFEDCBA
4 occupants, 2 smokers and 2 non-smokers.plus intermittent fan capacity in bathrooms and kitchen.
ventilation levels suggested for revision of ASHRAE 62-81 by J.E. Janssen, “Indoor Air ’84” Conference, Stockholm, Sweden, 1984. As of April 1985 it ap- pears t h a t the new ASHRAE standards will not differentiate between smoking a n d non-smoking environments.
a
‘
maximum requirements, assumes variable control.Actual Mechanical Ventilation Rates
The ventilation levels required by standards can be related to actual ventilation rates provided in the following examples of current designs:
1. 1983 NWTHC 3 bedroom house: 45 L/s exhaust fan capacity is provided in a dwelling with a volume of 280 m3, resulting in an ac/h of 0.58, without consideration of pressure drops in the system.
2. 1983 NWTHC 4 bedroom house: 45 L/s exhaust fan capacity is provided in a dwelling with a volume of 314 m3, resulting in an ac/h of 0 . 5 2 , without consideration of pressure drops in the system.
1984 SHQ “Jumele”
,
3 bedroom semidetached house: approximately 47 L/s exhaust capacity is provided in a dwelling with a volume of 250 m3, resulting in an ac/h of 0.68, without consideration of pressure drops in the system. The amount of mechanical ventilation air provided in these recent public housing designs indicates t h a t the designers were using thef
ac/h norm. In all three cases, fresh air is drawn into the system from under the dwelling by means of a duct, since the units have relatively “tight” envelopes and the assumption has been made t h a t the effects of infiltration would be negligible. This assumption may be open to question.The ability to deliver the intended rate of air change in a particular room is highly depen- dent on measures taken to promote air movement between rooms. As northern designers
turn increasingly to providing for total air change requirements by mechanical systems (at least for winter conditions), the question of inter-room air transfer becomes more critical. The high rates of air change likely to be required to compensate for smoking will also place more demands on the ventilation system. In these circumstances it would appear logical to explore the use of ventilation systems that provide one or two central air supply outlets, coupled with small air returns in each habitable room. This would constitute the reverse of current practice and would ensure that contaminated air could be removed close to the source of contamination, rather than being circulated through other spaces before being removed by a central air return. The technique would not be applicable to hot-air systems, where much of the return air is in any case recirculated, but could be effective in a hydronically-heated dwelling that has a small supplementary ventilation system. In this
case the amount of fresh air required to compensate for pollution (as in the draft
zyxwvutsrqponmlkjihgfedcbaZYXWVUTSRQPONMLKJIHGFEDCBA
ASHRAEstandards) could be minimized, thereby conserving energy.
Air Tightness and Air Infiltration
Identification of the volume of air that may infiltrate in a dwelling under normal operating conditions is relatively complex. In the
EMR
R2000 program, dwellings which are designed to limit air change to 1.5 ac/h at 50Pa
are assumed to provide an air change of 0.05 ac/h under non-test conditions. As the following section indicates, this may be a considerable underestimation for normal winter design temperatures and wind conditions.Air infiltration or exfiltration occurs due to pressure differences across the building enve-
lope, which tend to drive the air from a high pressure zone to a low pressure zone. Air movements of this type are caused by two basic factors, and are of concern in energy con- servation, since the mechanism can transport considerable quantities of cold outdoor air into the dwelling during winter.
One cause of pressure differentials is the difference between indoor and outdoor temper- atures during winter conditions. Since the density of air changes with temperature, the difference in weight between the internal (warm and therefore light) and the external columns of air (cold and heavy) creates the potential for convective flow. The resulting movement of air through imperfections in the building envelope is often referred to as the “stack effect”; if openings in the envelope are located at a low level and at a high level, the building will be especially susceptible to air flow of this type. The presence of vents and flues (open to the dwelling) will increase the air flow due to the stack effect.
Infiltration and exfiltration can also be caused by pressure differentials produced by winds. The determination of the wind forces t h a t the building is subject to is not a simple matter.
The maximum wind speeds provided by the Supplement to the NBC (Table 4)
zyxwvutsrqponmlkjihgfedcbaZYXWVUTSRQPONMLKJIHGFEDCBA
are not very useful here, since these maximum wind velocities and pressures do not necessarily indicateaverage values during the heating season. Weather station data are available, but these values may have to be scaled down to reflect the lower velocities usual in built-up areas.
. '
zyxwvutsrqponmlkjihgfedcbaZYXWVUTSRQPONMLKJIHGFEDCBA
The actual pressure differential acting on the envelope is also difficult to calculate, since itdepends greatly on the direction of the wind and the shape of the building. In the simplified case of a low detached building. the pressure coefficient (the ratio of wind-induced pressure
to the stagnation pressure of the wind speed a t a reference height,) may vary from about
zyxwvutsrqponmlkjihgfedcbaZYXWVUTSRQPONMLKJIHGFEDCBA
- 2 to about t-1.5 13,121.
Three other factors make it difficult to determine the total volume of air likely to be infiltrated or exfiltrated. First, the air exchange due to the combined effects of stack action and wind is not the simple sum of the individual values. Second, the volume of air that passes through the envelope will also clearly be related to the tightness of the envelope, and the degree of tightness varies with specific local factors, including the design and the degree of supervision of the construction process. Finally, the operation of a mechanical ventilation system and combustion equipment will also affect the rate of total air exchange.
Despite these limitations, estimates can be made using formulae developed in previous studies
[
131, which combine theoretical and empirical approaches. The basic equations and assumptions shown in Table 11 have been used to produce the estimates in Table 12for the volume of air change that might be expected in a modest two-storey house under
a variety of conditions.
Table 12 shows that the air change rates and commensurate energy required to heat ven- tilation air to indoor temperatures can be considerable. The relatively severe conditions of example 1 produce a very high infiltration rate of 0.83, but even in the relatively mild winter conditions of example 3, an air exchange rate of 0.38 ac/h is reached.
The wall flow coefficient
zyxwvutsrqponmlkjihgfedcbaZYXWVUTSRQPONMLKJIHGFEDCBA
( C , ) is an indicator of the tightness of the exterior wall, and acomparison of examples 2, 4 and 5 shows that, under moderate conditions of 30 km/h station wind speed and outdoor temperatures of -25"C, the air change rate varies from
0.38 to 0.76, where C , varies from 0.050 to 0.100. The value of 0.075 used for C , in most of the examples was derived from data supplied in a study of Saskatchewan housing [14]
and represents a value that is consistent with the standard of 1.5 ac/h at 50 P a used in
the R2000 program of Energy, Mines and Resources. The new Northern Measures calls for an equivalent leakage area of 170 m m 2 / m 2 (determined in comformance with (draft)
CAN2 149.10 [ 1 5 ] ) , a level of performance approximately equal to the R2000 standard. Both of these standards are high, but Table 12 indicates that even tight construction can produce a high level of air infiltration under severe conditions.
A comparison of examples 2 and 6 indicates that the value of
zyxwvutsrqponmlkjihgfedcbaZYXWVUTSRQPONMLKJIHGFEDCBA
p,
the ratio of the location of neutral pressure plane toH,
has a less dramatic but still significant effect on air exchangerates. The value of
p
will usually vary between 0.75 and 1.0, but it can exceed 1.0 if flues and vents exit above the roof line.Table 11 Assumptions and equations for estimates of air infiltration
zyxwvutsrqponmlkjihgfedcbaZYXWVUTSRQPONMLKJIHGFEDCBA
1. Assumptions and Variables Long wall dimension, m
Short wall dimension, m
Height of floor
zyxwvutsrqponmlkjihgfedcbaZYXWVUTSRQPONMLKJIHGFEDCBA
1 above grade, mGross height floor 1, m Gross height floor 2, m
Gable wall envelope height, m
Net area, floor 1, m 2 Net area, floor 2, m 2 Total volume, m3
A,, total area of wall envelope, m 2
E,
local wind speed coefficientF,
envelope wind speed coefficientDegree-days Celsius
zyxwvutsrqponmlkjihgfedcbaZYXWVUTSRQPONMLKJIHGFEDCBA
T,,
interior design temperature,"CH,
height, grade t o top floor ceiling, mzyxwvutsrqponmlkjihgfedcbaZYXWVUTSRQPONMLKJIHGFEDCBA
n, flow coefficient 9.00 5.50 1.50 2.75 2.50 2.00 41.16 41.16 234.20 134.55 0.75 0.75 10 500 20 7.60 0.71
*Stat ion wind velocity
zyxwvutsrqponmlkjihgfedcbaZYXWVUTSRQPONMLKJIHGFEDCBA
*V8, local wind speed
*To,
outdoor temperature*Td,
difference in temperaturezyxwvutsrqponmlkjihgfedcbaZYXWVUTSRQPONMLKJIHGFEDCBA
*Cw, wall air flow coefficient
zyxwvutsrqponmlkjihgfedcbaZYXWVUTSRQPONMLKJIHGFEDCBA
*p,
ratio of neutral pressure plane t o H (0.6-1.2)*Values for these variables are shown in Table 12
2. Equations for Determination of
Q s ,
Qw
,
Q tzyxwvutsrqponmlkjihgfedcbaZYXWVUTSRQPONMLKJIHGFEDCBA
(taken from Tamura, Ref. 13)
Calculation of Qs, air flow in L/s due t o stack action
Q 8 = 3C,A,,81-65Hn[%]n
Calculation of Q w , air flow in L/s due t o wind pressure
Qw = 0.24[9]AwC,Fn[EVs]1.3 Calculation of Q t , combined air flow
Q t = QIrg[I
+
0*24[Qlrp] QamizyxwvutsrqponmlkjihgfedcbaZYXWVUTSRQPONMLKJIHGFEDCBA
3 3 *]
where Qlrg is the larger of Q8 and Qw and where Qsml is the smaller of Q8 and Q w .
Table 12 Estimated air infiltration under various conditions
zyxwvutsrqponmlkjihgfedcbaZYXWVUTSRQPONMLKJIHGFEDCBA
Variables
Combined ac/h Watts* Flow(Qt) 1. 2. 3. 4. 5. 6.
Station wind vel., 40 km/h
Ext. Temperature, -45OC
zyxwvutsrqponmlkjihgfedcbaZYXWVUTSRQPONMLKJIHGFEDCBA
p
zyxwvutsrqponmlkjihgfedcbaZYXWVUTSRQPONMLKJIHGFEDCBA
= 0.75zyxwvutsrqponmlkjihgfedcbaZYXWVUTSRQPONMLKJIHGFEDCBA
cw
= 0.075 L/s.m2-PanStation wind vel., 30 km/h Ext. Temperature, -25OC
p
= 0.75zyxwvutsrqponmlkjihgfedcbaZYXWVUTSRQPONMLKJIHGFEDCBA
c,
= 0.075 L/sm2-PanStation wind vel., 15 km/h Ext. T e m p e r a t ~ r e , - 2 5 ~ C
p
= 0.75zyxwvutsrqponmlkjihgfedcbaZYXWVUTSRQPONMLKJIHGFEDCBA
C , = 0.075 L/s.m2.Pan
Station wind vel., 30 km/h Ext. Temperature, -25°C
p
= 0.75c,
= 0.050 L/s.m2.PanStation wind vel., 30 km/h
Ext. Temperature, -25OC
p
= 0.75C , = 0.100 L/s-m2.Pan
Station wind vel., 30 km/h Ext. Temperature, -25OC C , = 0.075 L/s.m2-Pan
p
= 1.00 32.6 23.7 23.7 15.8 31.6 38.0 50.9 35.0 14.2 23.3 46.7 35.0 53.7 37.3 24.7 24.9 49.7 45.0 0.83 0.57 0.38 0.38 0.76 0.69 4753 2400 1591 1600 3201 2893*power required t o heat infiltrated air t o room temperature.
Specific Sites of Air Infiltration
Southern studies have identified many potential sites for air leakage, most of which are due to penetrations of the envelope for vents, flues, wiring etc., leakage around windows or doors, or difficulties in obtaining a proper seal at structural connections such as sill plates or headers 116,171.
A
recent formulation of projected air leakage for use in the CMHC-2 computer program[
161 makes the assumption that most leakage sites are concentrated at the ground floor, the top of the envelope or the tops of flues. This assumption would, if borne out by empirical studies, have relatively greater effect in northern conditions. This, combined with the fact that a recentEMR
study of 200 houses [17] found that two-storey houses were about 12% leakier than single-storey houses under test conditions, would imply that the theoreticaladvantage of reduced ratio of surface area to volume enjoyed by two-storey units may be counteracted by other factors.
Korthern buildings with open crawl spaces and insulated floors present potential sites
for air leakage tha.t do not occur in southern housing, especially at floor-wall junctions. Northern housing also presents a special problem with regard to penetration of electrical
or mechanical services through the envelope because of the need for water fill and overflow
pipes, sewage tank pumpouts and oil supply lines.
zyxwvutsrqponmlkjihgfedcbaZYXWVUTSRQPONMLKJIHGFEDCBA
Combined Effects of Ventilation and Air Infiltration
The total amount of air change within a dwelling will be further increased if stack and wind infiltration occur while a mechanical ventilation system is in operation, and the result could be a total volume of air change considerably in excess of levels required for health or comfort. The specific increase in total air exchange, however, will depend upon the type
of mechanical system and the location of intakes and exhausts.
THE BUILDING ENVELOPE
Exterior walls, roofs and floors, often referred to collectively as the building envelope, have different structural functions but are alike in their task of maintaining an effective separation between the indoor and outdoor environments. Building envelopes in the North fulfill the same basic functions as in the South, but greater temperature differentials higher humidity differentials (in some cases) and greater exposure to high winds, all place great burdens on the ability of the building envelope to fulfill these functions.
Many modifications from southern design practice are therefore required. As a start, the building site should be chosen to minimize the effects of winter winds and to obtain the maximum benefit from spring and fall sunshine. The area of the building envelope should be kept to a minimum through the use of a simple and compact plan and shape. Beyond these site-related measures, the building envelope becomes the next most important area for design measures.
Reduction of Conductive Heat Losses
A wall that provides adequate thermal resistance in a 4000-5500
HDD
southern location will allow very high rates of conductive heat loss in the 6500-12 500HDD
regimes more typical of northern locations. Thermal upgrading of the wall is therefore a good first step to ensure interior comfort (prevention of drafts and reduction of radiative skin losses) and to control energy consumption and costs but the extent to which the thermal resistance of the building envelope should be increased is a more complex decision.In practice it is not possible for the designer to provide a wall or floor with an exact
that can be used, and each structural configuration will provide certain minimum and maximum thresholds of space available for insulation.
For example, it is a relatively simple matter to replace 89 mm stmuds with
zyxwvutsrqponmlkjihgfedcbaZYXWVUTSRQPONMLKJIHGFEDCBA
140 mm studs and in most cases the 140 mm studs can be spaced at 600 mm instead of the usual 400 mmspacing for 89 mm studs; this is not only structurally efficient but also reduces heat losses due to thermal bridging. To increase stud depth to 184 mm, however, is a dubious step.
True, the depth of the insulation cavity has increased by
zyxwvutsrqponmlkjihgfedcbaZYXWVUTSRQPONMLKJIHGFEDCBA
44 mm (providing an additional RSI 0.92 if fibreglass is used), but the wall is no longer structurally efficient, since codeswill not allow a spacing greater than 600 mm. Other minor practical issues also arise: framing costs increase because the 184 mm material is commonly available only in the more expensive kiln-dried form, and the difficulty and cost of framing increase because of weight and sizes of material.
The solution to this type of problem is to use a different type of wall, such as the standoff, double-stud or strapped wall. Each of these has a certain range of practicality and economy. A similar argument applies to floor designs, and to a lesser extent, to roof assemblies. The general point is that the designer does not have an infinite number of choices in designing the assemblies for the building envelope, but must work within certain ranges and thresholds.
The question of economics must occupy a central position in the design of the envelope. An insulated 140 mm stud wall with an additional 75 mm of semi-rigid insulation may perform well in Yellowknife, while a higher performance may be required in the more severe conditions of Baker Lake, but this type of rule of thumb should be refined to reflect the capital cost and the financial benefits of the increased performance.
The Northern Measures provides a formula that allows the designer to establish an aver- age RSI value for the building envelope, taking into account factors such as the degree-day regime, the capital cost of increasing the thermal resistance, the current cost of fuel and its rate of increase, the efficiency of the heating system, the mortgage rate, and the amortiza- tion period. The formula, called RSI O P T for Optimum RSI, selects the average RSI value that provides the maximum cost-benefit, i.e., it selects the point at which any additional increase in RSI performance costs more than it provides in benefits.
The use of fuel costs in the formula must be handled with care in cases where, as in N W T , fuel prices are subsidized. In such a case, the use of the subsidized figure in the formula would provide a distorted view of the economic benefits of the thermal performance re- quired by the envelope, from the point of view of governments providing the subsidies. Another difficulty is that the formula demands the use of oil to establish fuel costs, re- gardless of the type of fuel that is actually planned to be used for the building in question. This procedure is based on the assumption that the envelope and its performance cannot easily be improved after construction, whereas the initial use of a different and cheaper fuel does not guarantee that it will always be used or available. Although the rationale
is apparent, the measure does penalize those who have access to cheaper energy, such as
users of firewood in the Yukon.
zyxwvutsrqponmlkjihgfedcbaZYXWVUTSRQPONMLKJIHGFEDCBA
Structural Integrity
Permafrost conditions tend to create a greater possibility of movement of the structure than is the case for a structure built on other soils. Although current designs reduce the amount of heat transmitted from the building into the soil, subsequent movement is still a problem. In any case, buildings on permafrost soils are not continuously supported on foundation walls, but on piles or posts. This type of support requires a system of beams to support the floor joists of the building, with an inherent risk of considerable movement at a few critical points. The high winds encountered in some areas of the eastern Arctic will also place dynamic loads on the structure, increasing the possibility of local movement. Movement can cause damage to interior finishes and services, but it may also increase the dimensions of unintentional flaws in the weather barrier* or the air-vapour barrier, reducing the performance of the envelope. This possibility should be considered both in the selection of materials (tearing strength) and in the type and location of supports.
Protection of the Envelope from Wind and Precipitation
Even where an air-vapour barrier provides an effective seal between the indoor environment and the main insulation layer, high wind speeds can cause considerable air movement through the insulation layer unless care is taken to minimize air movement behind the cladding. The effectiveness of air-permeable insulation such as fibreglass is considerably reduced under such conditions, and will be further reduced if the insulation becomes wet. There are three basic solutions. If an insulation is not air-permeable but is still vapour- permeable, wind and precipitation will not be able to enter the insulation cavity, while any moisture that is migrating outwards through imperfections in the air-vapour barrier (AVB) will be able to escape. A similar solution is to cover an air-permeable insulation with a barrier that sheds water, minimizes air flow and permits vapour diffusion. A third option, that may profitably be combined with the second, is to divide the insulation cavity at intervals into compartments that prevent the horizontal and vertical movement of air. This technique is especially useful and important at corners of buildings, where the wind pressure coefficient may change within a very short distance from a high positive value to
a high negative value.
zyxwvutsrqponmlkjihgfedcbaZYXWVUTSRQPONMLKJIHGFEDCBA
*
A layer in the building envelope provided to keep wind-induced air flow out of insulationIntegrity of Air-Vapour Barrier
zyxwvutsrqponmlkjihgfedcbaZYXWVUTSRQPONMLKJIHGFEDCBA
Even greater attention must be paid to the integrity of the air-vapour barrier in the North than in the South, due to the greater thermal and moisture gradients. The pressure differentials caused by temperature differences across the envelope are low in absolute terms, but northern conditions still provide relatively greater opportunities for leakage. Designers of energy-efficient houses have learned that polyethylene air-vapour barriers ap- pear to have a magnetic attraction for the sharp-edged tools and equipment of electricians and interior finishers. The best way to minimize punctures due to electrical work is to avoid placing electrical services in an exterior wall, but code requirement will seldom allow it. The placement of electrical services in the outer wall also has, in most cases, the disad- vantage of reducing the amount of insulation behind the electrical boxes. Another method is continuous supervision, but this is expensive. Yet another technique is to sandwich the
AVB between the finish and a layer of sheathing on the interior side of the studs.
None of the options outlined above solves the problem of punctures made subsequent to construction, due to installation (and subsequent removal) of screws, nails, etc., through the interior finish.
One method that appears to avoid most of the problems outlined above is to provide a
strapped space (38 or 64
zyxwvutsrqponmlkjihgfedcbaZYXWVUTSRQPONMLKJIHGFEDCBA
mm) on the inner side of the structural elements. In all assemblies of this type, the AVB can be located at the line of the structure, leaving a free space of 38or 64 mm for services and (optionally) insulation. In walls and ceiling assemblies, shallow electrical boxes will have to be used if the 38 mm space is opted for; if an insulated 64 mm space is used, calculations must be carried out to ensure that the AVB is not cooled to a
temperature lower than the dew point of the room air.
WINDOWS, DOORS A N D
OTHER
OPENINGSWindows, doors and other exterior openings are significant sources of heat loss. Whereas conventional current northern housing typically has walls with a thermal resistance of about RSI 3.5 (and the Northern Measures will require a minimum of RSI 5.0), even a first-class modern wood-framed window with operable double glazing will have a unit RSI value of only about 0 . 3 3 to 0.43, depending on the frame material and glass spacing. Doors can provide better performance, mainly because of their (usually) smaller glazed area; but even a good modern insulated exterior door will provide a maximum of only about 2.1 RSI. Added to the poor thermal performance of doors and windows is their inherently greater susceptibility to air infiltration; current window and door technology typically results in air infiltration values in the order of 0.50 t o 0.77 L/s for each metre of sash crack (at 75 Pa) for windows and exterior swing doors. Sliding doors are leakier, with typical infiltration
rates in the range of 0.5 to 3.8 L/s for each metre, again at 75 Pa.
zyxwvutsrqponmlkjihgfedcbaZYXWVUTSRQPONMLKJIHGFEDCBA
A
new standard,CAN3-A440-M84
zyxwvutsrqponmlkjihgfedcbaZYXWVUTSRQPONMLKJIHGFEDCBA
[
181, specifies an upper limit for openable windows in low-rise buildings of 2.79 m3/h for each metre of sash crack length (equivalent to the old figure of 0.77 L/s),and adds a limit, of
zyxwvutsrqponmlkjihgfedcbaZYXWVUTSRQPONMLKJIHGFEDCBA
0.25 m'/h (0.07 L/s) for fixed glazing. The latter figure underlines the desirability of using fixed windows to the maximum extent possible.The total air exchange that may occur through windows in a particular dwelling is consider- able, since pressure differences of about 75 P a could occur in winds of 40 km/h (depending on building shape and wind direction). Table 13 illustrates the potential difference in in- filtration due to the difference in characteristics and standards for three different window
types. The table assumes a dwelling of 120 m2 with a total of 14 windows, each 0.6 x
zyxwvutsrqponmlkjihgfedcbaZYXWVUTSRQPONMLKJIHGFEDCBA
1.2 m (in total just over 8% of floor area), evenly distributed on the windward and leeward sides.Table 13 Maximum possible air exchange by window
Total window Total sash Max. infiltr. Total possible area/side crack/side by standard infiltration
Double hung
zyxwvutsrqponmlkjihgfedcbaZYXWVUTSRQPONMLKJIHGFEDCBA
5 m2 29.4 m 0.77 L/s-m 22.6 L/sCasement
zyxwvutsrqponmlkjihgfedcbaZYXWVUTSRQPONMLKJIHGFEDCBA
5 m 2 25.2 m 0.77 L/s-m 19.4 L/sFixed 5 m2 25.2 m 0.07 L/s-m 1.8 L/s
Although Table 13 presents an oversimplified case under severe conditions, it does indicate that windows can be a considerable source of infiltration of cold air, which requires energy to be heated. When these air exchange figures are considered in conjunction with the poor thermal resistance of windows and doors, it is not surprising that considerable efforts are being made to improve their performance. The poor performance of windows is even more obvious in the context of energy-efficient houses, where conductive losses are low and wall RSI values in excess of 5.0 are not uncommon.
The Measures for Energy Conservation in New Buildings (NRC Measures) [19] and the Northern Measures both place considerable emphasis on minimizing the heat loss and maximizing the heat gain from windows. In both cases, heat losses are reduced by requiring a higher degree of thermal resistance and by reducing the amount of glazed area.
The NRC Measures require that glazing in areas with more than 6500 HDD shall have a thermal resistance of more that 0.45 RSI, or be triple glazed. The Northern Measures has the same provision. In practice, triple glazing provides a thermal resistance in the range of
0.45 to 0.60 RSI, so the improvement over double glazing (RSI 0 . 2 9 to 0 . 3 5 ) is substantial. Another major provision of the NRC Measures, adopted by the Northern Measures, is a limitation on the area of glazing. The NRC Measures requires that the total area of
glazing material shall not exceed 15% of the floor area in question, and not more than 40%
of the total area of the exterior wall. The Northern Measures has adopted the clause, but reduces the maxima to 12% and 32010, respectively, and includes the full area of door in the calculation. In both cases, a bonus is provided for South-facing glazing, in recognition of the fact that solar gain can be Considerable during the fall and spring heating seasons.
Methods of obtaining fresh air other than through windows should be a priority in the design of northern buildings. Windows that open can ice up in mid-winter due to water vapour condensing in the opening areas. If this occurs, it may be very difficult to close them again, causing very high rates of heat loss.
Thus it has been suggested that opening windows be replaced by a combination of fixed glazing and openings designed for ventilation only, closed with a solid and insulated panel. This type of unit has been used by some northern designers in the past, on the grounds
that,
zyxwvutsrqponmlkjihgfedcbaZYXWVUTSRQPONMLKJIHGFEDCBA
a higher RSI value can be achieved in the vent closure. Another argument in itsfavour i s
zyxwvutsrqponmlkjihgfedcbaZYXWVUTSRQPONMLKJIHGFEDCBA
that the separation of the visual and air circulation functions allows the vent to be designed with an air-entry profile that discourages the entry of wind-driven snow. TheNorthern Measures encourages the use of vent closures.
Other measures can do much to reduce heat losses. The use of insulating blinds or shutters can add significantly to the thermal resistance of glazing as long as precautions are taken to minimize the possibility of condensation or glazing breakage from thermal stress. The application of this technology in the North would appear to be especially appropriate be- cause of the large seasonal variations in solar radiation, making heat gain through windows very attractive during the spring and fall, while high RSI levels are very important during the severe winter.
In southern Canada, insulating shutters and curtains are almost inevitably placed on the interior side of the glazing, since they must be adjusted on a daily basis. In the northern context it may be practical to use external shutters, since these could be left permanently in place during the late fall and winter, assuming that there are other windows available for view.
Development work in the design of glazing and frames has been going on within the Division of Energy at NRC (until recent budget cuts) which are likely to lead to units with a thermal resistance of RSI 1.0 or more.
HEATING SYSTEMS AND EQUIPMENT Overview
Small residential heating systems in the North are generaly limited to space heaters, hy- dronic or hot air systems. Hot air systems were installed in the great majority of housing built u p to the 1970’s. There has been a recent shift towards hydronic systems, however,
to the point where NWTHC is installing this type of system (with glycol fluid) in over
zyxwvutsrqponmlkjihgfedcbaZYXWVUTSRQPONMLKJIHGFEDCBA
90% of new units.
The Yukon presents a more diverse picture. Just over half of Yukon units have hot air systems, but other units are almost evenly split between hydronic, electric and space heaters. One popular recent Yukon system is the wood-oil furnace or (in Whitehorse) a wood stove with electrical baseboard backup.
![FIGURE 1. The permafrost region in Canada [2]](https://thumb-eu.123doks.com/thumbv2/123doknet/14297733.493531/7.918.100.784.359.917/figure-permafrost-region-canada.webp)

![Table 2 Heating degree days and design temperatures for selected communities Design temperature zyxwvutsrqponmlkjihgfedcbaZYXWVUTSRQPONMLKJIHGFEDCBA [3]](https://thumb-eu.123doks.com/thumbv2/123doknet/14297733.493531/9.918.216.684.140.575/table-heating-temperatures-selected-communities-design-temperature-zyxwvutsrqponmlkjihgfedcbazyxwvutsrqponmlkjihgfedcba.webp)