Publisher’s version / Version de l'éditeur:
Questions? Contact the NRC Publications Archive team at
PublicationsArchive-ArchivesPublications@nrc-cnrc.gc.ca. If you wish to email the authors directly, please see the https://publications-cnrc.canada.ca/fra/droits
L’accès à ce site Web et l’utilisation de son contenu sont assujettis aux conditions présentées dans le site LISEZ CES CONDITIONS ATTENTIVEMENT AVANT D’UTILISER CE SITE WEB.
Research Report (National Research Council of Canada. Institute for Research in
Construction), 2005-05-01
READ THESE TERMS AND CONDITIONS CAREFULLY BEFORE USING THIS WEBSITE. https://nrc-publications.canada.ca/eng/copyright
NRC Publications Archive Record / Notice des Archives des publications du CNRC :
https://nrc-publications.canada.ca/eng/view/object/?id=887b7415-93e4-4334-a2d5-7e3618309253 https://publications-cnrc.canada.ca/fra/voir/objet/?id=887b7415-93e4-4334-a2d5-7e3618309253
NRC Publications Archive
Archives des publications du CNRC
For the publisher’s version, please access the DOI link below./ Pour consulter la version de l’éditeur, utilisez le lien DOI ci-dessous.
https://doi.org/10.4224/20378032
Access and use of this website and the material on it are subject to the Terms and Conditions set forth at
Experimental Studies for Evaluating the Fire Endurance of
High-Strength Concrete Columns
Experimental Studies for Evaluating the Fire
Endurance of High-Strength Concrete Columns
V.K.R. Kodur, R. McGrath*, P. Leroux and J.C. Latour (*CAC)
Research Report No. 197
May 2005
Fire Research Program
Institute for Research in Construction
National Research Council Canada
EXPERIMENTAL STUDIES FOR EVALUATING THE FIRE ENDURANCE OF HIGH-STRENGTH CONCRETE COLUMNS
by
V.K.R. Kodur, R. McGrath*, P. Leroux and J.C. Latour * Cement Association of Canada
EXPERIMENTAL STUDIES FOR EVALUATING THE FIRE ENDURANCE OF HIGH-STRENGTH CONCRETE COLUMNS
by
V.K.R. Kodur, R. McGrath*, P. Leroux and J.C. Latour (* Cement Association of Canada)
ABSTRACT
Experimental studies were carried out to determine the fire resistance performance of high-strength concrete columns. The results of fire endurance experiments on ten full-scale columns are described in this report. The test variables included concrete strength, type of aggregate in concrete, silica fume, tie configuration and spacing, load intensity and eccentricity of loading. These studies were conducted as part of a collaborative research program, aimed at studying fire endurance of high-strength concrete columns.
EXPERIMENTAL STUDIES FOR EVALUATING THE FIRE ENDURANCE OF HIGH-STRENGTH CONCRETE COLUMNS
by
V.K.R. Kodur, R. McGrath*, P. Leroux and J.C. Latour (* Cement Association of Canada)
ACKNOWLEDGEMENTS
This research is part of a Joint Research Project between the National Research Council of Canada (NRC), the Portland Cement Association (PCA), and the Cement Association of Canada (CAC). The authors appreciate the technical and financial contributions of PCA and CAC.
The research reported in this report (PCA R&D Serial No. 2112A) was conducted by the National Research Council of Canada, with the sponsorship of the Portland Cement Association (PCA Project Index No. 97-06) and the Cement Association of Canada. The contents of this report reflect the views of the authors, who are responsible for the facts and accuracy of the data presented. The contents do not necessarily reflect the views of the sponsors.
EXPERIMENTAL STUDIES FOR EVALUATING THE FIRE ENDURANCE OF HIGH-STRENGTH CONCRETE COLUMNS
by
V.K.R. Kodur, R. McGrath*, P. Leroux and J.C. Latour (* Cement Association of Canada)
INTRODUCTION
In recent years, the construction industry has shown significant interest in the use of high-strength concrete (HSC). In addition to increased compressive strength, HSC can provide improved durability, compared to traditional normal strength concrete (NSC). The use of HSC, previously used in applications such as bridges, offshore structures and infrastructure projects, is becoming more popular in high-rise buildings. One of the major uses of HSC in buildings is for columns. Generally, concrete up to a compressive strength up to 70 MPa (10 ksi) is referred to as Normal Strength Concrete (NSC), while concrete with a compressive strength in excess of 70 MPa (10 ksi) is classified as High Strength Concrete (HSC).
In buildings, HSC structural members are designed to satisfy the requirements of serviceability and safety limit states. One of the major safety requirements in building design is the provision of appropriate fire safety measures for structural members [1]. The basis for this requirement can be attributed to the fact that, when other measures for containing or suppressing the fire fail, structural integrity is the last line of defence.
With the increased use of HSC, concern has developed regarding the behaviour of such concretes in fire. In particular, the occurrence of spalling at elevated temperatures when HSC is subjected to rapid heating, as in the case of a fire, is one of the reasons for this concern [2,3]. Results of other fire endurance tests in a number of laboratories [4,5,6,7] have shown that there are well-defined differences between the properties of HSC and NSC, such as loss of cross section and faster loss of strength, at elevated temperatures.
Studies are in progress at the National Research Council of Canada (NRC), in collaboration with the concrete industry, to develop fire resistance design guidelines for high-strength concrete for possible incorporation into codes and standards [1,8]. As part of this effort, a collaborative research project between the Institute for Research in Construction (IRC), National Research Council of Canada (NRC), the Portland Cement Association (PCA) and the Cement Association of Canada (CAC), was recently completed where full-scale fire endurance experiments were conducted on ten HSC columns [9]. Results from this study have clearly indicated that the fire endurance of HSC columns is different from that of NSC columns and depends on a number of factors. However, in earlier studies, only limited parameters such as column size, type of aggregate, and tie configuration were considered. The present study is intended to carry out additional experiments to investigate the influence of other parameters, such as tie spacing and configuration, concrete strength and the addition of silica fume, on the fire endurance of high-strength concrete columns.
Due to limitations of the test apparatus, the largest sections tested had a square cross-section of 406 mm x 406 mm, (16 in x 16 in.). Such dimensions are not representative of typical HSC column sizes in actual practice. HSC columns tend to have minimum cross-sectional dimension of 22 inches – nearly twice the
The experimental program consisted of fire endurance tests on 10 reinforced concrete columns sized so as not to exceed the loading capacity of the testing apparatus. All 10 columns were made of high-strength concrete and were designated as HS2-1 to HS2-10. The tests were performed between December 1999 and May 2001.
Dimensions
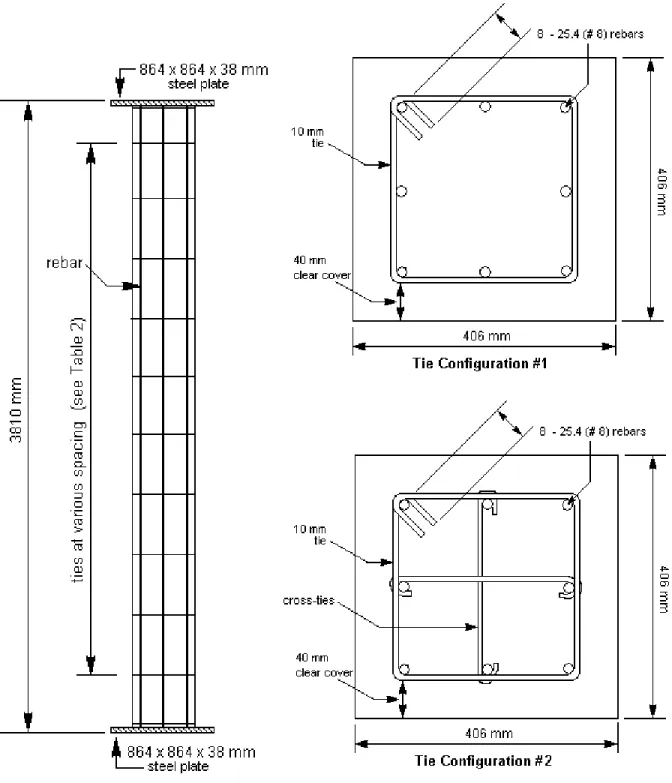
All columns were of square cross-section, 406 mm (16 in.) x 406 mm (16 in.) and 3810 mm (12 ft 6 in.) long from end plate to end plate. The cross-sectional dimensions of each column are listed in Table 1.
Materials Cement
ASTM C150, Type I Portland cement, a general purpose cement for construction of reinforced concrete structures, was used for constructing the reinforced concrete columns.
Aggregates
Two types of coarse aggregates, namely siliceous aggregate and carbonate aggregate, were used. When concrete is made with normal weight coarse aggregate composed mainly of silica and silicates (quartz), it is referred to as siliceous aggregate concrete. However, when concrete is made with coarse aggregate, consisting mainly of calcium carbonate or a combination of calcium and magnesium carbonate (for example limestone and dolomite), it is referred to as carbonate aggregate concrete. The fine aggregate used in the concrete mix was natural sand.
Reinforcement
Deformed bars meeting the requirements of ASTM A615-80 [10] were used for both main longitudinal bars and ties. All reinforcement had a specified yield strength of 400 MPa (58 ksi). The longitudinal reinforcement in all columns was comprised of eight 25 mm (No. 8) bars symmetrically placed with 40 mm (1.6 in.) clear cover to the tie reinforcement. The main reinforcing bars were welded to steel end plates. The percentage of longitudinal steel in all columns was 2.42%. The details of reinforcing bars and ties are given in Figure 1 and Table 2.
The lateral reinforcement consisted of 10 mm (No.3) ties. All the ties terminated with 135° bends at the ends, anchoring the ties back into the core of the column. The spacing of the ties varied from a maximum dimension of ‘h’, to a minimum of dimension ‘h/2’, where ‘h’ represents the cross-sectional dimension of the column, equal to 406 mm (16 in.). In columns HS2-1, HS2-4 and HS2-7 the ties were spaced at a distance of 'h/2', while in columns HS2-2, HS2-5, HS2-8 and HS2-9, the spacing was at '3h/4'. For columns HS2-3, HS2-6 and HS2-10 the ties were provided at a spacing of 'h'. The spacing of the ties, together with the tie configuration, is given in Table 2. The location and layout of the ties are shown in Figure 1.
The confinement effect in Columns HS2-3, HS2-6, HS2-9 and HS2-10 was enhanced by providing two additional cross-ties (Tie Configuration #2) as shown in Figure 1. All ties were lapped with 135° bends at the ends. The clear concrete cover of the ties was 40 mm (1.6 in.) in all columns. Full
Concrete Mix
Three batches of concrete were used for fabricating the columns. The three batches of concrete were made at the Construction Technology Laboratories Inc. (CTL) in Skokie, Illinois, USA. Batches 1 and 3 were made with carbonate aggregate, while Batch 2 was made with siliceous aggregate.
Batch quantities and measured properties of the concrete are given in Table 3. The 28-day cylinder compressive strength of concrete batches ranged from 75 MPa (10.88 ksi) to 128 MPa (18.56 ksi). The corresponding compressive strength on the day of the fire endurance tests ranged from 85 MPa (12.35 ksi) to 138 MPa (20.06 ksi).
Fabrication
Columns were fabricated and cured at CTL in the USA, and then shipped to NRC, Canada. The columns were cast horizontally in specially-designed forms. Chromel-alumel thermocouples were secured to the reinforcing steel at specific locations before the cage was precisely positioned in the form. The longitudinal bars were welded to the threaded rods which were bolted to the end plates. In order to avoid any possible dislocation of the thermocouples during casting, a careful working plan was followed as described below.
Reinforcing Bars and Steel Plates
All columns were 3810 mm (12 ft 6 in.) in length, measured from end plate to end plate. The longitudinal reinforcing bars, were cut to 3790 mm (12 ft 5 in.) and machined at both ends to the diameters (measured by micrometer), shown in Figure 1.
The details of end plates, including dimensions, are shown in Figure 1. Holes, with a diameter 1.6 mm (1/16 in.) greater than that of the machined ends, were drilled through the plates to accommodate the longitudinal bars.
The main reinforcing bars and lateral ties were tied together to complete the steel cage. The cage was then placed vertically on a levelled end plate in such a way that the machined segments of the bars were positioned in the holes.
Welding
The provisions of AWS Designation D12.1-75 [11] were followed when welding the plates and bars. Special attention was given to the centering and squaring of the end plates during welding. Mild steel welding rods were used to fill the holes, which had been drilled to accommodate the reinforcing bars, on the outer face of the plates. The rough surface of the welded joints on the drilled outer face of the plate was ground to a smooth finish.
The welding of the top steel plate was performed before casting the columns. Before positioning the top plate, a layer of mortar was spread over the top of the column to ensure good contact between steel plate and concrete. Using a similar procedure for the bottom plate, the top plate was welded onto the outer side to the bars and smoothed.
Type K chromel-alumel 0.91 mm (1/28 in.) thick thermocouples were used for measuring concrete and steel temperatures at several locations. The thermocouples were tied to a steel rod that was secured to the reinforcing bars of the column. The bar was fixed at both ends of the column, as shown in Figure 1.
To measure the concrete temperatures, thermocouples were mounted on a supplemental support, while steel temperatures were measured by mounting the thermocouples on rebars and ties. A total of 15 thermocouples, 10 on concrete and 5 on reinforcement, were installed at mid-height of each column. Exact locations and numbering of thermocouples are shown in Figure 2.
Forms
Forms were made of smooth plywood. The columns were cast horizontally with the top side left open for concrete placement.
Concrete Placement
The concrete was mixed in a truck mixer. The columns were cast with the forms in a horizontal position. A concrete placement bucket, shovels and scoops were used to deposit the concrete in the forms. An internal vibrator was used to consolidate the concrete. As the casting progressed upward, the window pieces were successively closed and tightly bolted to the form to avoid possible mortar leaks. The open surface of the columns was screened and finished with a small trowel.
In general, a year or more elapsed between the time a column was cast and the time it was tested. Curing
The columns were moist-cured in their forms for approximately seven days. After the forms were removed, the columns were transferred to a drying chamber in order to reduce the internal moisture content. These columns were dried until the internal relative humidity was 75% or less or until they had cured for at least six months. After that, the columns were shipped to NRC for undertaking fire endurance tests.
Test Apparatus
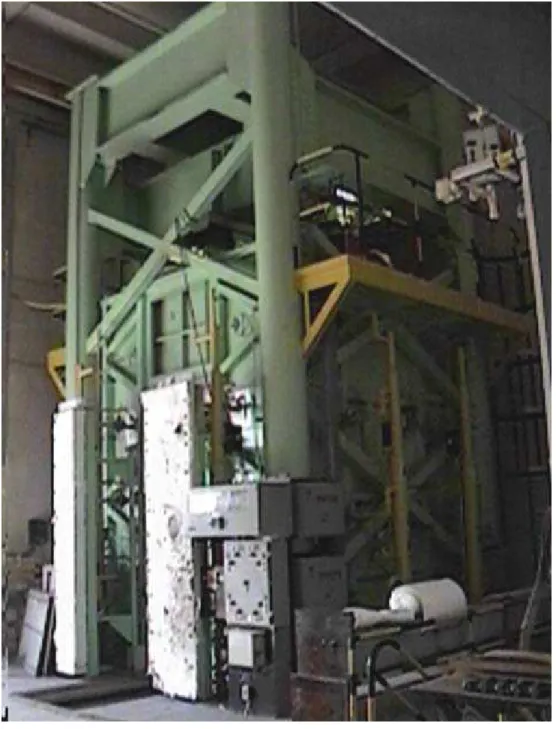
The fire endurance experiments were carried out by exposing the columns to heat in a furnace specially built for testing loaded columns. The test furnace was designed to produce conditions to which a member might be exposed during a fire, i.e., temperatures, structural loads and heat transfer and to meet the requirements of ASTM E119. It consisted of a steel framework supported by four steel columns, with the furnace chamber inside the framework (Figure 3). The characteristics and instrumentation of the furnace are described in detail in Reference 12. Only a brief description of the furnace and the main components are given here.
Loading Device
Eccentric loads can be applied by means of hydraulic jacks, one at the top and one at the bottom of the column, located at a distance of 508 mm (20 in.) from the axis of the column. The capacity of the top jack is 587 kN (133 kips) and the bottom jack is 489 kN (110 kips).
Furnace Chamber
The furnace chamber has a floor area of 2642 x 2642 mm (8 ft 8 in. x 8 ft 8 in.) and is 3048 mm (10 ft) high. The interior of the chamber is lined with insulating materials that efficiently transfer heat to the specimen. The ceiling and floor insulation protects the column end plates from fire. It should be noted that only 3200 mm (10 ft 6 in.) of the column is exposed to fire.
There are 32 propane gas burners in the furnace chamber arranged in eight columns containing four burners each. The total capacity of the burners is 4700 kW (16 million Btu/h). Each burner can be adjusted individually, which allows for a high degree of temperature uniformity in the furnace chamber. The pressure in the furnace chamber is also adjustable and was set somewhat lower than atmospheric pressure.
Instrumentation
The furnace temperatures were measured with the aid of eight Type K chromel-alumel thermocouples. The thermocouple junctions were located 305 mm (1 ft) away from the test specimen, at various heights. Two thermocouples were placed opposite each other at intervals of 610 mm (2 ft) along the height of the furnace chamber. The locations of their junctions and their numbering are shown in Figure 4. Thermocouples 4 and 6 were located at a height of 610 mm (2 ft) from the floor, Thermocouples 2 and 8 at 1220 mm (4 ft), Thermocouples 3 and 5 at 1830 mm (6 ft) and Thermocouples 1 and 7 at 2440 mm (8 ft). The temperatures measured by the thermocouples were averaged automatically and the average temperature was used to control the furnace temperature.
The loads were controlled by servocontrollers and measured with pressure transducers. The accuracy of controlling and measuring loads is about 4 kN (1 kip) at lower load levels and relatively better at higher loads.
The axial deformation of the test columns was determined by measuring the displacement of the jack that supported each column. The rotation of the end plates of the columns were determined by measuring the displacement of the plates at a distance of 500 mm (20 in.) from the centre of the hinge, at the top and bottom respectively. The displacements were measured using transducers with an accuracy of 0.002 mm (1/80-in.).
TEST CONDITIONS AND PROCEDURES
The columns, with fixed ends, were installed in the furnace by bolting their end plates to the loading head at the top and the hydraulic jack at the bottom.
In the case of columns with pinned ends, they were installed by bolting the top plate to the loading head and by securing the bottom plate to the hydraulic jack using carbide teeth.
Before testing, the relative humidity of a column was measured by inserting a Vaisala∗ moisture sensor into a hole drilled in the concrete. In general, a moisture content, corresponding to approximately 57% to 98% relative humidity, was measured. The relative humidity of each column is given in Table 1.
For columns HS2-1 to HS2-5 the relative humidity (RH) was computed as an average of the RH measurements taken at three locations: the top, bottom and central heights of the column. For the remaining columns the RH represents the measured values close to the central height of the column. The high RH values in columns HS2-1 to HS2-5, as compared to columns HS2-6 to HS2-10, can be attributed to the low measured RH values at the top and bottom of the columns.
End Conditions
Six columns were tested with both ends fixed, i.e., restrained against rotation and horizontal translation. For this purpose, eight 19 mm (3/4 in.) diameter bolts, spaced regularly around the column, were used at each end to bolt the end plate to the loading head at the top and to the hydraulic jack at the bottom. Columns HS2-7 to HS2-10 were tested under hinged end conditions, i.e., with restraint against horizontal translation only. The hinged condition was obtained by bolting the end plates to the receiving plates with roller bearings at each end.
Loading
Columns HS2-1 to HS2-6 were tested under a concentric load. The remaining four columns (HS2-7 to HS2-10) were tested under a load which was eccentric by 27 mm (1 1/16”). The applied load on the columns ranged from 66% to 100% of full service load determined in accordance with CSA Standard CSA-A23.3-94 [8]. The factored compressive resistance of each column, as well as the applied loads, are given in Table 1. The factored compressive resistances of the columns were calculated using the effective length factor, K (0.65 for fixed ends and 1 for pinned ends). The factored resistance, computed using the PCACOL computer program [13], together with applied loads on the column, are given in Table 1.
The columns were subjected to applied loads ranging from 3546 kN (797 kips) to 5373 kN (1208 kips), as given in Table 1.
All loads were applied approximately 45 min before the start of the fire endurance test and were maintained until a steady state condition was reached at which no further change of axial and rotational deformations could be measured. This condition was selected as the initial condition of the column deformation. The load was constant throughout the fire endurance test.
Fire Exposure
The ambient temperature at the start of each test was approximately 20°C (68oF). During the test, each column was exposed to heating controlled in such a way that the average temperature in the furnace followed, as closely as possible, the CAN/ULC-S101 [14] which is equivalent to the ASTM-E119 [15] standard temperature-time curve. This curve can be approximately expressed using the following equation:
t
t
e
f
T
20
750
1
3
.
79533
+
170
.
41
−
−
+
=
where: t = time in hours
Tf = temperature of furnace in °C
Recording of Results
The furnace, concrete and steel temperatures, as well as axial deformations of the columns were recorded at one-minute intervals. In the case of the eccentrically-loaded columns, the rotation of the end plates of the column was also measured with varying frequencies, depending on the rate of change of the measured quantities. The crack propagation and occurrence of spalling in columns were monitored, during the test, through the observation windows in the column furnace. The magnitude of deformations, cracks, and spalling could not be accurately determined during the tests, as visibility was restricted by flames, size and position of the observation portals, and protective eye wear.
Failure Criterion
The columns were considered to have failed, and the tests were terminated, when the axial hydraulic jack, which has a maximum speed of 76 mm/min (3 in./min), could no longer maintain the load.
RESULTS AND DISCUSSION
The results of the 10 column tests are summarized in Table 1, in which the column characteristics, test conditions, fire endurance and failure modes are given for each column. The furnace, concrete and steel temperatures recorded during the tests, as well as the axial deformations of the column specimens, are given in Tables A.1 to A.10 in Appendix A. The temperatures and the axial deformations are also plotted in Figures A.1 to A.10 in Appendix A, where positive axial deformation values indicate expansion of the column. For Columns HS2-7, HS2-8, HS2-9 and HS2-10, which had pinned ends, the rotation at the ends are also given in relevant tables and figures. A typical view of HSC columns after fire endurance tests is shown in Figures B.1 to B.10 in Appendix B.
The temperature plots for Column HS2-9 show an erratic trend, from the 90 min to 100 min. mark of fire exposure. This was due to the shutting-off of the furnace which occurred because of exhaust damper controller problems in the furnace. As a result of furnace shut-off, the temperatures in the furnace dropped. This problem was rectified and the furnace was immediately restarted to complete the test. The temperature drop did not likely alter the test results since the duration of the furnace shut-off was short (approximately 3-5 min) and also, the effect of the drop in furnace temperature on the temperature of the inner layers of the steel and concrete was minimal (see Figures A.9).
General Observations
During the fire endurance tests, visual observations were made to record spalling, and crack propagation, in the columns. Also, after the completion of fire tests, post-test observations were made to document performance characteristics not considered endpoint criteria for ASTM E 119, such as extent and nature of spalling and condition of rebars and ties. An approximate idea on the extent and nature of spalling, as well as the failure pattern, can be gauged from Figures B.1 to B.10 in Appendix B which show typical view of HSC columns after fire endurance tests. The following is a summary of the observations that were recorded.
Column HS2-1 (Test Load = 90% of Full Service Load)
Time Observations
hr:min
0:00 Column subjected to predetermined axial load for about 45 min. prior to fire exposure.
0:10 A bang is heard from the furnace, and minor spalling occurs on the east face at about 1/4 height from the bottom of the column.
0:20 Water escaping out of the small hole, drilled for measuring relative humidity (RH) at mid-height of the column.
0:30 Water continues to escape out of the RH hole in the west face. 1:15 No cracking was observed on any face of the column.
1:50 Longitudinal cracks appear on the west face of the column. 3:00 Longitudinal cracks propagate on all faces of the column. 4:00 The rate of change of axial deformation increases.
4:30 The width of cracks widens on the west face of the column. No reinforcement is directly exposed to fire.
4:59 Load could not be maintained, and failure of column occurs by crushing. Post failure:
The concrete stayed in place throughout the duration of the test. No buckling of rebars or deformation of ties occurred in the column. See Figure B-1.
Column HS2-2 (Test Load = 100% of Full Service Load)
Time Observations
hr:min
0:00 The column was subjected to predetermined axial load for 1 hour prior to fire exposure. 0:05 No spalling was observed, in the column.
0:10 Spalling is observed on the east face, at 1/4 height, from the bottom of the column. 0:25 Spalling on west face, at mid-height of the column.
0:30 Spalling stops.
1:00 Column is still in the expansion phase.
1:40 Cracks appear on the east face, at the edge of the tie spacers, at mid height of the column. 2:00 A sudden jump in axial expansion of the column is observed.
3:00 Contraction of the column begins.
4:00 Axial deformation is progressing at a slower rate.
Sudden compression appeared to be initiated by the failure of a tie at the mid-point of the failed section. The tie failed at a continuous corner of the tie. Spalling of chunks of concrete was observed at the lower quarter point from the bottom of the column. The cover concrete stayed in place over most of the column height. See Figure B-2.
Column HS2-3 (Test Load = 100% of Full Service Load)
Time Observations
hr:min
0:00 The column was subjected to axial load for about 45 min. prior to fire exposure.
0:15 Moisture is observed escaping from the RH hole on the north face at mid-height of the column. 1:00 No further escaping moisture could be observed. No spalling on any face of the column. 4:00 Cracks appear on the east face of the column.
5:00 Longitudinal cracking is observed on the north and west faces. Cracks run diagonally through the north-east and north-west corners.
6:00 Cracking on north and east faces expands. Spalling is also occurring on all faces of the column. 6:19 Pure compression failure of the column occurs. A bang is heard at failure. Crushing occurs
between the ties at roughly the lower 1/3 point of the column. Chunks of concrete fell off the column.
Note: Observations on rate of axial deformation were not recorded. Post failure:
The failure appears to have taken place between the ties. The majority of spalling occurred at the lower third point, of the column. Ties were broken and buckling of rebars occurred along the length of the column on all faces of the column. See Figure B-3.
Column HS2-4 (Test Load = 85% of Full Service Load)
Time Observations
hr:min
0:00 The column was subjected to predetermined axial load for 45 min. prior to fire exposure.
0:10 A bang is heard from within the furnace. No spalling observed on any face of the column. Water is escaping from the north face of the column.
0:15 Another bang is heard from within the furnace. No spalling is observed to this point.
0:45 Spalling on the north and west faces of the column. Moisture escapes from RH hole on south face, at 1/3 height from top of the column.
1:00 Noise is heard from within the furnace. Spalling occurs and exposes reinforcement on the east and north faces of upper 1/3 height of the column.
1:30 Spalling on the south face of the column occurs exposing vertical rebars and ties. Rebars in north face are completely exposed.
2:00 No change in the behaviour of the column.
2:12 Another noise is heard. Additional spalling occurs, but column still carrying the load. 2:26 A bang is heard from the furnace. Sudden failure of the column occurs.
at mid-height appeared to have helped to hold a large part of the concrete within the core of the column. See Figure B-4.
Column HS2-5 (PCA III-6) (Test Load = 100% of Full Service Load)
Time Observations
hr:min
0:00 The column was axially-loaded for 45 minutes prior to fire exposure. 0:15 No spalling, on any face of the column, is observed.
0:30 Hairline cracks on the corner of the east face of the column. 1:00 No spalling, but long cracks occur on corners of the column.
1:30 Column begins to shorten. Cracks appear on all faces of the column. Rebars and ties become exposed.
1:38 Pieces of concrete fall off of the column on the east and west faces.
1:41 Bang is heard in the furnace, and more spalling occurs. Vertical cracks develop along the full length of the column.
1:48 A bang is heard in the furnace. Sudden compression failure of the column occurs. Severe loss of section occurs with several ties failing along the length of the column. Section loss extends into the core of the column.
Post failure:
Bent ties and buckled re-bars were observed. Some concrete within the reinforcement cage was lost. See Figure B-5.
Column HS2-6 (Test Load = 66% of Full Service Load)
Time Observations
hr:min
0:00 The column was subjected to predetermined axial load for 40 min. prior to fire exposure. 0:10 No spalling was observed on any face of the column.
0:15 Minor spalling is observed on west face, at mid-height. A spall occurred on the north face of the column as well. Water escapes from the south, north and west faces through the RH holes. The moisture loss occurs at the spalled areas and the RH holes.
0:20 Spalling on the west face of the column.
0:30 Moisture escapes out of drilled RH holes in the column.
0:33 Escaping of moisture through RH holes stops. A bang is heard from the furnace and a large crack develops on the upper 1/3 height of the column.
0:35 A big piece of concrete falls off from the south face near top of the column. 1:00 Big cracks appear on west face of the column.
1:10 Another bang is heard from the furnace and the cracks on the south face lengthen. The concrete cover to the reinforcement spalls off at some locations along the length of the column.
1:15 Concrete chunks falls off of the west face of the column.
1:30 Rebars on north-west corner and west face of the column are fully exposed to fire over the mid-height of the column.
Post failure:
Chunks of concrete are observed on the floor around the base of the column. See Figure B-6.
Column HS2-7 (Test Load = 85% of Full Service Load; eccentricity of load = 27 mm (1.1 in.))
Time Observations
hr:min
0:00 The column was subjected to predetermined eccentric load for about 1 hour prior to fire exposure. It was noted that the column had some (eccentric) alignment problems, (the column was possibly crooked).
0:10 No spalling was observed in the initial stages of fire exposure.
0:13 Spalling was observed on the east face at mid-height of the column, . Water was observed escaping from the spalled section of the column.
0:15 Moisture continues to escape from RH hole drilled in the column. 0:20 Water stops escaping from the column. No further spalling was noticed. 0:40 Some additional spalling is observed on the east face of the column. 2:00 No new spalling or cracking is observed.
2:40 The axial deformation of column enters contraction phase. 4:08 Sudden compression failure of column occurs.
Post failure:
Rebars were exposed at mid-height on east, west and north faces of the column. The failed section extended approximately 7 tie spacing along the length of the column on all faces. See Figure B-7.
Column HS2-8 (Test Load = 100% of Full Service Load; eccentricity of load = 27 mm (1.1 in.))
Time Observations
hr:min
0:00 The column was subjected to eccentric load for about 1 hour prior to fire exposure. 0:15 No spalling is observed in the column.
1:00 The column attains maximum axial deformation. 1:30 No spalling or cracking is observed in the column.
1:58 Sudden failure occurs. A bang is heard. Deflection had been increasing at a slow rate, but the column suddenly fails. Large pieces of concrete spall off along the length of the column. A layer of concrete down to the tie reinforcement fell off in small concrete pieces.
Post failure:
Concrete cover to the reinforcement is lost over most of the column length on all faces. Rebars are buckled at some sections around the mid-height of the column. The concrete within the core of the column ( within the reinforcement cage) was intact. See Figure B-8.
Time Observations hr:min
0:00 The column was eccentrically loaded for 45 minutes prior to fire exposure.
0:12 No spalling was observed on any face of the column. Moisture escaping from the west face, at 1/3 point from top of the column.
0:15 Spalling on east and north faces at about mid-height of the column. Moisture was observed escaping from the north face of the column.
0:20 A crack develops, at the point where moisture is escaping, on the north face of the column. 0:25 Water stops escaping from the north face, but starts escaping from the west face of the column. 0:30 The crack continues to develop on the north face of the column. Spalling occurs in a small area
on the east face of the column.
1:00 Spalling approximately is observed on the west face of the column. The cracking at the lower 1/3 of the column has continued to expand . Axial expansion of the column starts to reach a plateau. 1:15 The column reaches peak axial expansion.
1:30 Spalling occurs on the west face of the column. Some cracks also occur on the east face of the column.
1:50 The cracks propagate on the east and west faces of the column. Indication of a change in the rotation of the top end of the column.
1:57 A bang is heard from the furnace and sudden compressive failure of the column occurs. Post failure:
Spalling occurred around mid-height and at the four corners of the column. The compression failure in the concrete was most acute at the north-west corner, where failure of a confinement tie at a continuous bend was observed at the upper third point along the length of the column. Some rebars around mid-height were exposed on the east and north faces of the column. The west face suffered the most severe loss of concrete section due to the eccentric placement of the load (most rebars and ties were completely exposed). The ties failed at 1/3 height from the top of the column and potentially leading to failure of the column. See Figure B-9.
Column HS2-10 (Test Load = 100% of Full Service Load; eccentricity of load = 27 mm (1.1 in.))
Time Observations
hr:min
0:00 Column subjected to eccentric load for about 45 minutes prior to fire exposure. 0:15 Spalling approximately is observed on the east face, at mid-height of the column. 0:30 No cracks or further spalling occurs in the column.
2:00 A crack develops on the west face of the column.
2:30 The crack continues to develop on the west face of the column.
2:40 Rotations and deflection increases at a faster rate, and the cracks widen.
2:46 Failure of the column is accompanied by a bang. Numerous chunks of concrete spall off of the column, principally at the ends.
Post failure:
The rebars are fully exposed throughout the height of the column. Large concrete pieces on the floor of the furnace. Buckling deformation of the rebars is observed along the mid-height of the
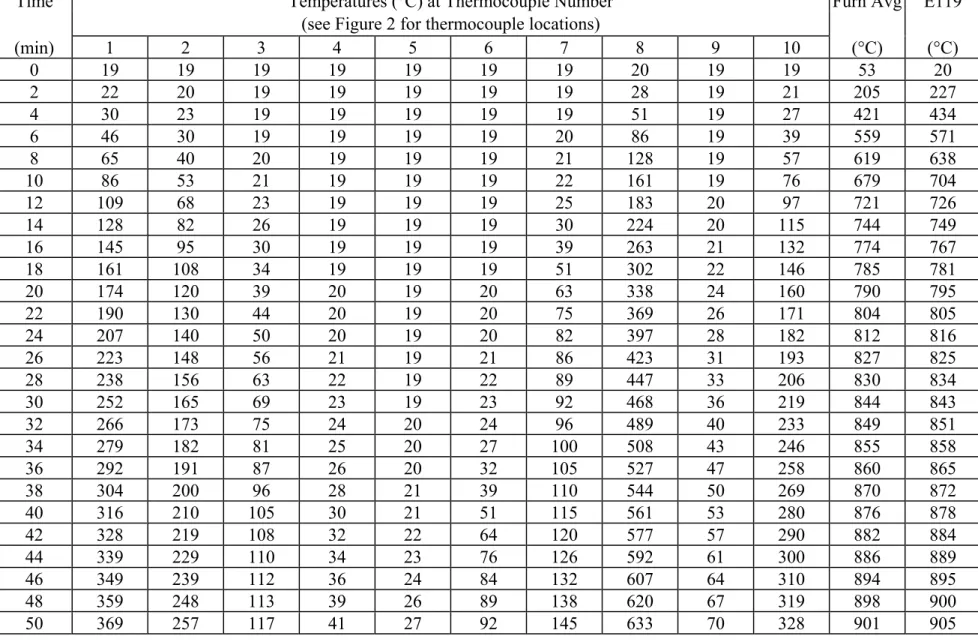
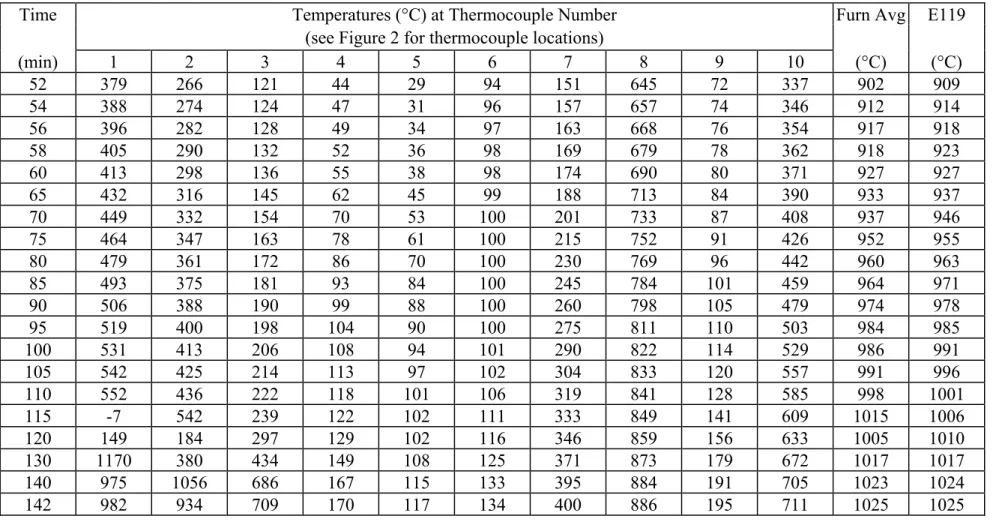
The measured furnace temperatures are compared with standard temperatures for ten columns in Figures A.1(a) to A.10(a). From the figures it can be seen that the measured temperature in the furnace closely followed the standard ASTM E-119 temperature-time curve [15].
All the columns had thermocouples in the concrete and at the steel reinforcement to measure representative cross-sectional temperatures. Temperatures at the various thermocouple locations are shown for columns HS2-1 through HS2-10 in Figures A.1(b) to A.10(c) respectively. The recorded temperatures in some thermocouples show erratic trends over some intervals for columns HS2-1 to HS2-6 and HS2-10. This is mainly due to the dislocation or damage to the thermocouples as a result of concrete spalling. It is also possible that the damage may have occurred during fabrication or transportation.
In all of these columns, the temperatures inside the columns rose rapidly to about 100oC after which the temperature rise was much slower. Lie and Ceilikkol [16] have shown that this temperature behavior is due to the thermally-induced migration of moisture toward the center of the column and the transformation of water in the concrete from liquid to vapor phase. The influence of moisture migration is the highest at the center of the column. While there are slight differences in the temperature propagation of various HSC columns, overall, they follow a similar trend.
Variation of Deformations
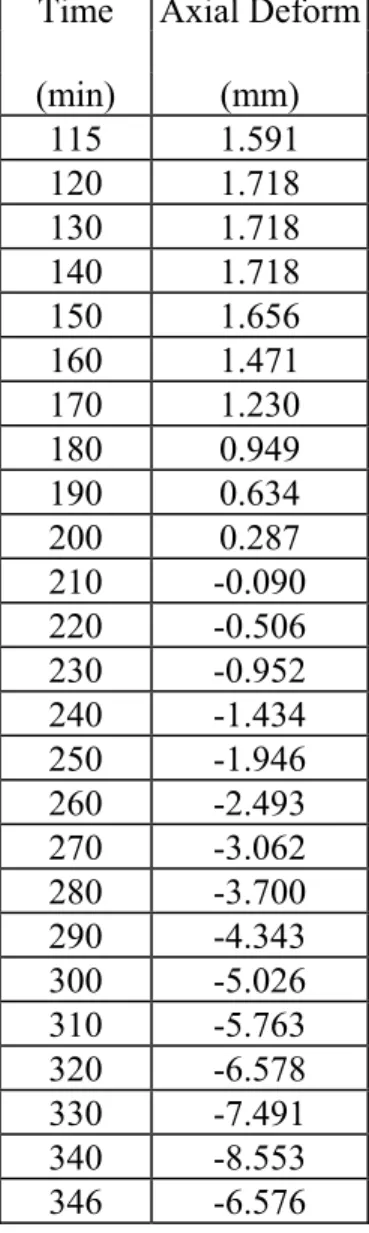
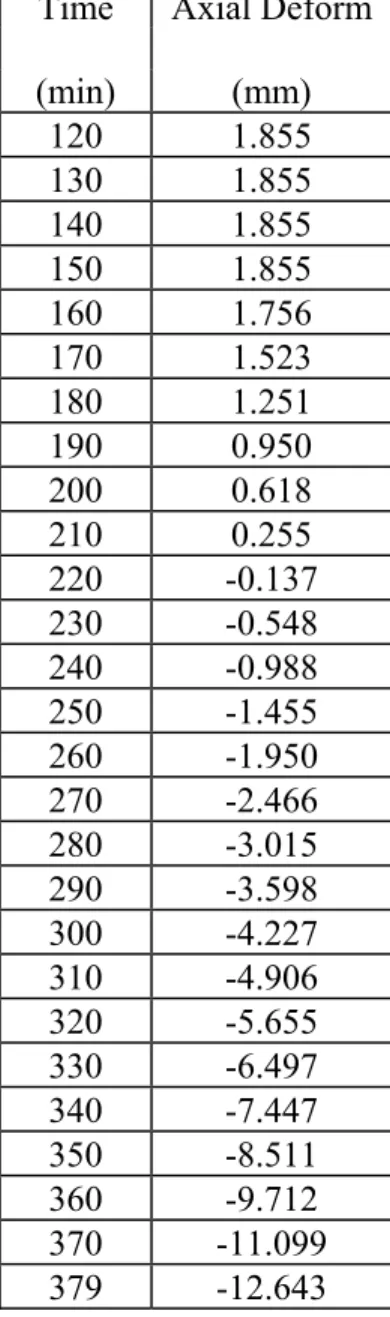
Plots of “Axial Deformation vs Time” for the ten columns are shown in Figures A.1(d) to A.10(d).
Spalling Pattern and Failure Mode
The concentrically loaded columns failed in pure compression, while the eccentrically loaded columns failed in combined flexure/compression mode. Columns HS2-1 and HS2-6 failed in a ductile mode. Some degree of spalling occurred in all columns, however, the extent of spalling (severity) and the stage at which it occurred varied for each case. At higher load levels and under eccentric loads, a significant amount of spalling occurred just prior to failure of the columns.
In general the size of concrete chunks, due to spalling, varied from 12.5 mm x 12.5 mm x 3 mm (1/2" x 1/2" x 1/8") to about 100 mm x 50 mm x 25 mm (4" x 2" x 1"). The size of concrete chunks was smaller at the initial and mid-stages of fire tests, while the size of chunks was larger prior to failure of the columns. The state of the column, as well as the extent of spalling, can be seen from Figures B.1 to B.10, in Appendix B, which show the view of HSC columns after fire endurance tests.
Spalling was generally very minimal in columns HS2-1 to HS2-3, moderate in columns HS2-7 to HS2-10 and very significant in columns HS2-4 to HS2-6. In columns HS2-1 to HS2-3 spalling was minimal at early stages of fire exposure, nonexistent at intermediate stages, and moderate in the final stages of fire exposure (prior to failure). In columns HS2-4 to HS2-6 spalling was very minimal in initial stages of fire exposure, significant at intermediate stages, and very significant in the final stages of fire exposure. This variation in spalling in different columns can be attributed to factors such as the presence of silica fume, aggregate type, and loading type.
Columns (HS2-1 to HS2-3) made with carbonate aggregate concrete and subjected to axial exhibited very little spalling. Siliceous aggregate concrete columns (HS2-4 to HS2-6) exhibited more spalling. This could be attributed to the effect of aggregate, as well as the absence of any silicafume in columns HS2-1 to HS2-3. Due to the endothermic reaction in carbonate aggregate, the specific heat of
temperature rise in siliceous aggregate concrete. This increase in specific heat is caused by the dissociation of the dolomite in the carbonate concrete and is beneficial for fire endurance and also in reducing spalling of concrete [3,17].
Columns HS2-4 to HS2-6 had higher spalling during intermediate stages of fire exposure and prior to failure. This could be attributed to the presence of higher silica fume and siliceous aggregate in the concrete. Columns HS2-7 to HS2-10, in spite of having higher silica fume content and subjected to eccentric loading (more prone to spalling), had moderate spalling. Further, most of the spalling in these columns (HS2-7 to HS2-10) was on the compression face of the column, which could be partly attributed to the stress gradients due to eccentric loading.
When steel reinforcement yields, the concrete carries a progressively increasing portion of the load. The strength of the concrete also decreases with temperature and, ultimately, when the column can no longer support the load, failure occurs.
The effect of high relative humidity on spalling in the columns was not significant. There was no severe spalling in HSC columns, even when the relative humidity was as high as 99%.
Fire Endurance
A comparison of fire endurance for all columns is given in Table 1. The time to reach failure is defined as the fire endurance of the column. HSC columns, HS2-1 to HS2-3, attained higher fire endurance as compared to other columns. The decreased fire endurance for the higher strength HSC columns (HS2-4 to HS2-6), as compared to the columns HS2-1 to HS2-3, can be attributed to a number of factors including the mix proportions of the concrete. Further, significant spalling which results in the decrease in the cross-section at later stages of fire exposure, also contributed to lowering the fire endurance of HSC columns HS2-4, HS2-5 and HS2-6.
A comparison of fire endurance of various columns indicates that Columns HS2-1 to HS2-3 had the highest fire endurance, while Columns HS2-7 to HS2-10 (with eccentric load) had moderate fire endurance and Columns HS2-4 to HS2-6 had the lowest fire endurance in the series.
Columns HS2-1 to HS2-3, made with carbonate aggregate and no silica fume, had higher fire resistance than Columns HS2-4 to HS2-6, which were made with silica fume and siliceous aggregate.
HSC columns, HS2-1 to HS2-3, composed of carbonate aggregate, have a higher fire resistance than HSC columns composed of siliceous aggregate (HS2-4 to HS2-6).
Table 1 lists the fire performance of the HSC columns tested in the program described above. The results of tests conducted between May 1993 and August 1997 on similar columns confined with 90˚ ties, were reported in Reference 9 and are shown in Table 4 for the convenience of the reader. Comparing the results of Table 1 with HSC columns 1 to 6 in Table 4 demonstrates the improved fire performance afforded by the use of 135˚ ties. Columns 7 to 10 in Table 4, while smaller than columns 1 to 6, also demonstrate improved performance utilizing 135˚ ties at reduced spacing.
SUMMARY OF TEST RESULTS
increased concrete strength, load eccentricity, spacing and detailing of ties, have an influence on the fire performance of HSC columns.
2. In all columns no significant spalling was observed in the initial stages of fire exposure. Generally, the spalling in HSC columns was significant only towards the end of the tests.
3. The type of aggregate has a visible influence on the performance of HSC columns at elevated temperatures. The presence of carbonate aggregate in HSC increases fire endurance. Also, the extent of spalling is generally much lower for carbonate aggregate columns as compared to those of siliceous aggregate concrete columns.
4. The primary purpose of the test program was to investigate the influence of confinement and in particular the use of 135˚ ties on the fire resistance of HSC columns. The use of 135˚ ties was generally shown to improve the fire performance of the HSC columns when compared with similar HSC columns confined with 90˚ ties in earlier programs. Additional factors investigated include concrete strength, aggregate type and the use of silica fume in the concrete mix. The tests results can be used for assessing the fire endurance of HSC columns with parameters that lie within the range of the parameters examined in this study.
5. The authors recommend that numerical fire endurance modeling studies be conducted to define the relationship of the investigated variables to fire endurance. The test data presented in this report can be used to validate the numerical fire endurance methodology.
REFERENCES
1. National Building Code of Canada, National Research Council of Canada, Ottawa, ON, 1995.
2. Phan, L.T. “Fire Performance of High-Strength Concrete: A Report of the State-of-the-Art”, National Institute of Standards and Technology, Gaithersburg, MD, 1996.
3. Kodur, V.R., "Spalling in high strength concrete exposed to fire - concerns, causes, critical parameters and cures," Proceedings: ASCE Structures Congress, 1-8, Philadelphia, U.S.A., 2000. 4. Diederichs, U., Jumppanen, U.M. and Schneider, U., “High Temperature Properties and Spalling
Behaviour of High-strength Concrete”, Proceedings of Fourth Weimar Workshop on High Performance Concrete, HAB Weimar, Germany, 1995., pp.219-235.
5. Kodur, V.R. "Studies on the fire resistance of high strength concrete at the National Research Council of Canada" Proceedings: Fire Performance of High Strength Concrete, 75-86, (NIST Special Publication vol. 919), Gaithersburg, MD., U.S.A., 1997.
6. Kodur, V.K.R. and Sultan, Mohamed, “Behaviour of High-strength Concrete Columns Exposed to Fire”, Concrete Canada International Conference Symposium, Sherbrooke, QC, Vol. 4, pp. 217-232, 1998.
7. Kodur, V.R., McGrath, R.C., "Performance of high strength concrete columns under severe fire conditions,": Proceedings, 3rd International Conference on Concrete Under Severe Conditions (CONSEC'01), Vol 1, 254-268, Vancouver, B.C., 2001.
9. Kodur, V.R., McGrath, R., Latour, J.C., MacLaurin, J.W., Experimental Studies on the Fire Endurance of High-Strength Concrete Columns, Internal Report, Institute for Research in Construction, National Research Council Canada, 819, pp. 140, 2000 (IRC-IR-819)
10. American Society for Testing and Materials, “Standard Specification for Deformed and Plain Bullet-Steel Bars for Concrete Reinforcement”, ASTM A615-80.
11. American Welding Society, “Reinforcing Steel Welding Code”, AWS- D12.1-75.
12. Lie, T.T., “New Facility to Determine Fire Resistance of Columns”, Canadian Journal of Civil Engineering, 7(3), 1980, pp. 551-558.
13. Canadian Porland Cement Association, “PCACOL - Strength Design of Reinforced Concrete Column Sections”, Ottawa, ON, Canada, 1994.
14. Underwriters' Laboratories of Canada, “Standard Methods of Fire Endurance Tests of Building Construction and Materials”, CAN/ULC-S101-M89, Scarborough, ON, 1989.
15. American Society for Testing and Materials, “Standard Methods of Fire Endurance Tests of Building Construction and Materials”, ASTM E119-88, Philadelphia, PA, 1990.
16. Lie, T. T. and Celikkol, B., “Method to Calculate the Fire Resistance of Circular Reinforced Concrete Columns”. ACI Materials Journal, Vol. 88, No. 1, pp. 84-91, 1991.
17. Lie, T.T., Editor, “Structural Fire Protection: Manual of Practice”, ASCE Manual and Reports on Engineering Practice, No. 78, American Society of Civil Engineers, New York, NY, 1993.
18. Kodur, V.K.R. and Sultan, M.A.S., “Thermal Properties of High-strength Concrete at Elevated Temperatures”, CANMET-ACI-JCI International Conference, Tokushima, Japan, June 1998.
19. McGrath, R., Kodur, V.R.,, "Research on the fire resistance of high strength concrete columns," Proceedings: CSCE Conference, 269-274, London, Ontario, 2000.
LIST OF TABLES
Table 1. Summary of test parameters and results
Table 2. End plate and reinforcement details for HSC Columns
Table 3. Concrete mix batch quantities for HSC Columns HS2-1 to HS2-10
LIST OF FIGURES
Fig. 1 Elevation and Cross-Sectional Details of HSC Columns HS2-1 to HS2-10 Fig. 2 Location and Numbering of Thermocouples in Columns HS2-1 to HS2-10 Fig. 3 Column Test Furnace
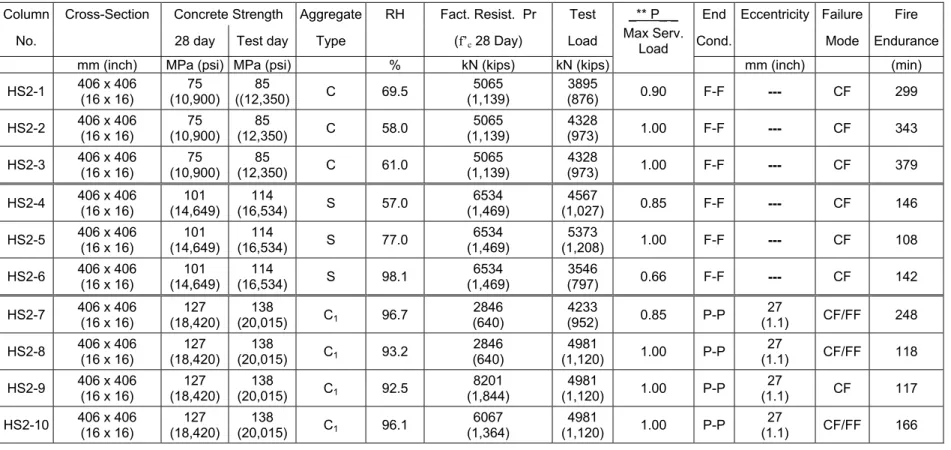
Table 1: Summary of test parameters and results
Column Cross-Section Concrete Strength Aggregate RH Fact. Resist. Pr Test _** P_ _ End Eccentricity Failure Fire No. 28 day Test day Type (f’c 28 Day) Load Max Serv. Load Cond. Mode Endurance
mm (inch) MPa (psi) MPa (psi) % kN (kips) kN (kips) mm (inch) (min) HS2-1 406 x 406 (16 x 16) 75 (10,900) 85 ((12,350) C 69.5 5065 (1,139) 3895 (876) 0.90 F-F --- CF 299 HS2-2 406 x 406 (16 x 16) (10,900) 75 (12,350) 85 C 58.0 (1,139) 5065 (973) 4328 1.00 F-F --- CF 343 HS2-3 406 x 406 (16 x 16) 75 (10,900) 85 (12,350) C 61.0 5065 (1,139) 4328 (973) 1.00 F-F --- CF 379 HS2-4 406 x 406 (16 x 16) (14,649) 101 (16,534) 114 S 57.0 (1,469) 6534 (1,027) 4567 0.85 F-F --- CF 146 HS2-5 406 x 406 (16 x 16) 101 (14,649) 114 (16,534) S 77.0 6534 (1,469) 5373 (1,208) 1.00 F-F --- CF 108 HS2-6 406 x 406 (16 x 16) 101 (14,649) 114 (16,534) S 98.1 6534 (1,469) 3546 (797) 0.66 F-F --- CF 142 HS2-7 406 x 406 (16 x 16) 127 (18,420) 138 (20,015) C1 96.7 2846 (640) (952) 4233 0.85 P-P (1.1)27 CF/FF 248 HS2-8 406 x 406 (16 x 16) 127 (18,420) 138 (20,015) C1 93.2 2846 (640) 4981 (1,120) 1.00 P-P 27 (1.1) CF/FF 118 HS2-9 406 x 406 (16 x 16) 127 (18,420) 138 (20,015) C1 92.5 8201 (1,844) 4981 (1,120) 1.00 P-P 27 (1.1) CF 117 HS2-10 406 x 406 (16 x 16) 127 (18,420) 138 (20,015) C1 96.1 (1,364) 6067 (1,120) 4981 1.00 P-P (1.1)27 CF/FF 166 **P – Load
Pr – Factored compressive resistance of the column C ¾” Carbonate aggregate
S ¾” Siliceous aggregate C1 ½” Carbonate aggregate
CF Compression failure
Table 2: End plate and reinforcement details for columns
Column
End-Plate
Longitudinal Steel *
Ties **
Concrete Clear
No.
Dimensions
No. & Size
%
Diameter Spacing
Config.
Confinement Cover Over Ties
mm (inch)
Metric (US)
mm (inch) mm (inch)
mm (inch)
HS2-1
864 x 864 x 38
(34 x 34 x 1.5)
8 M25
(8 #8)
2.47
10
(0.4)
203
(8)
1
135
°
@ h/2
40
(1.6)
HS2-2
864 x 864 x 38
(34 x 34 x 1.5)
8 M25
(8 #8)
2.47
10
(0.4)
305
(12)
1
135
°
@ 3h/4
40
(1.6)
HS2-3
864 x 864 x 38
(34 x 34 x 1.5)
8 M25
(8 #8)
2.47
10
(0.4)
406
(16)
2 (CT
+)
135
°
@ h
40
(1.6)
HS2-4
864 x 864 x 38
(34 x 34 x 1.5)
8 M25
(8 #8)
2.47
10
(0.4)
203
(8)
1
135
°
@ h/2
40
(1.6)
HS2-5
864 x 864 x 38
(34 x 34 x 1.5)
8 M25
(8 #8)
2.47
10
(0.4)
305
(12)
1
135
°
@ 3h/4
40
(1.6)
HS2-6
864 x 864 x 38
(34 x 34 x 1.5)
8 M25
(8 #8)
2.47
10
(0.4)
406
(16)
2 (CT
+)
135
°
@ h
40
(1.6)
HS2-7
864 x 864 x 38
(34 x 34 x 1.5)
8 M25
(8 #8)
2.47
10
(0.4)
203
(8)
1
135
°
@ h/2
40
(1.6)
HS2-8
864 x 864 x 38
(34 x 34 x 1.5)
8 M25
(8 #8)
2.47
10
(0.4)
305
(12)
1
135
°
@ 3h/4
40
(1.6)
HS2-9
864 x 864 x 38
(34 x 34 x 1.5)
8 M25
(8 #8)
2.47
10
(0.4)
305
(12)
2 (CT
+)
135
°
@ 3h/4
(1.6)
40
HS2-10
864 x 864 x 38
(34 x 34 x 1.5)
8 M25
(8 #8)
2.47
10
(0.4)
406
(16)
2 (CT
+)
135
°
@ h/4
40
(1.6)
* Yield strengths of longitudinal steel and ties was 400 MPa (58 ksi)+
Table 3: Concrete mix batch quantities for Columns HS2-1 to HS2-10
[1] Dry weight * C Carbonate aggregate
Batch
Number
Parameter – units/m
3(yd
3) unit
1
2
3
Columns Fabricated
HS2-1 -
HS2-3
HS2-4 -
HS2-6
HS2-7 –
HS2-10
Cement Type I
Kg
(lb)
341
(752)
339
(748)
350
(772)
Silica Fume [1]
kg
(lb)
--- 56.7
(125)
62.1
(137)
Fly Ash Class F
kg
(lb)
74.8
(165)
31.8
(70)
43.5
(96)
Coarse Aggregate (SSD)
kg
(lb)
816.5
(1800)
799.2
(1762)
803.3
(1771)
Aggregate Type *
C
S
C
Aggregate Size
mm
(inches)
19
(3/4)
19
(3/4)
12.7
(1/2)
Fine Aggregate (natural sand)
kg
(lb)
471.7
(1040)
556.1
(1226)
562.9
(1241)
Water-Reducer L
(
USfl. oz.)
1.1
(38)
2.1
(72)
2.9
(99)
HR WR Type F
L
(
USfl. oz.)
5.7
(192)
13.5
(456)
16.5
(557)
Retarder Type D
L
(
USfl. oz.)
--- ---
1.3
(44)
Total Water [2]
Kg
(lb)
132.4
(292)
81.6
(180)
87.1
(192)
Water : Cement Ratio
0.388
0.241
0.249
Water : Binder Ratio
0.318
0.191
0.191
% Silica Fume
---
13.3
13.6
% Fly Ash
18
7.4
9.5
Slump mm
(inch)
178
(7.0)
216
(8.5)
216
(8.5)
28 Day Compressive Strength
MPa
(psi)
75
(10,900)
101
(14,670)
128
(18,540)
90 Day Compressive Strength
MPa
(psi)
81
(11,810)
114
(16,510)
138
(20,060)
Test Day Compressive
Strength
MPa
(psi)
85
(12,350)
113
(16,510)
138
(20,060)
[2] Weight of total water in mix including admixtures * S Silicate aggregateTable 4: Summary of test parameters and results from earlier fire endurnace tests [9]
Column Cross-Section Concrete Strength Aggregate RH Fact. Resist. Test ** P/Maximum Service Load
End Eccentricity Failure Fire
No. 28 day Test Type Crc (f'c Test Day) Load Cond. Mode Endurance
mm (inch) MPa (psi) MPa (psi) % KN (kips) KN (kips) mm (inch) (min)
HS1 406 x 406 91.7 - C 75 6,289 *45 - F-F - - 248 (16 x 16) (13,300) - (1,415) (10) -HS2 406 x 406 105.1 126.5 C 67 6,289 2,913 0.60 H-H - CF 204 (16 x 16) (15,240) (18,340) (1,415) (655) -HS3 406 x 406 83.7 99.7 S 69 6,436 3,080 0.63 F-F - CF 239 (16 x 16) (12,140) (14,460) (1,448) (693) -HS4 406 x 406 74.9 89.6 C 61 5,120 2,934 0.73 H-H - CF 145 (16 x 16) (10,860) (12,990) (1,152) (660) -HS5 406 x 406 80.9 86.0 S 86 5,900 2,406 0.54 F-F - CF 224 (16 x 16) (11,730) (12,470) (1,327) (541) -HS6 406 x 406 84.0 96.0 C 57 7,400 4,919 0.90 F-F - CF 104 (16 x 16) (12,180) (13,920) (1,665) (1,107) -HS7 305 x 305 107.0 119.7 C 50 3,145 1,979 0.82 F-F - CF 266 (12 x 12) (15,520) (17,360) (707) (445) -HS8 305 x 305 107.0 119.7 C 68 3,145 2,363 0.98 F-F - CF 290 (12 x 12) (15,520) (17,360) (707) (532) -HS9 305 x 305 107.0 119.7 C 64 3,145 2,954 1.23 F-F - CF 266 (12 x 12) (15,520) (17,360) (707) (664) -HS10 305 x 305 107.0 119.7 C 64 2,127 2,954 1.83 H-H 25 CF 49 (12 x 12) (15,520 (17,360) (478) (664) (1.00)
* At 240 minutes the load on the column was increased at the rate of 100 kips/minute. Failure occurred at 248 minutes when the load was 3,279.1 kN (737.8 kips)
Thermocouples on Steel Reinforcement
Thermocouples in Concrete
APPENDIX A
APPENDIX A
TEMPERATURES AND AXIAL DEFORMATIONS OF COLUMNS
List of Tables
Table. A.1 Temperatures and Axial Deformation for Column HS2-1 (a) Furnace Temperatures
(b) Temperatures in Reinforcement (c) Temperatures in Concrete (d) Axial Deformation
Table. A.2 Temperatures and Axial Deformation for Column HS2-2 (a) Furnace Temperatures
(b) Temperatures in Reinforcement (c) Temperatures in Concrete (d) Axial Deformation
Table. A.3 Temperatures and Axial Deformation for Column HS2-3 (a) Furnace Temperatures
(b) Temperatures in Reinforcement (c) Temperatures in Concrete (d) Axial Deformation
Table. A.4 Temperatures and Axial Deformation for Column HS2-4 (a) Furnace Temperatures
(b) Temperatures in Reinforcement (c) Temperatures in Concrete (d) Axial Deformation
Table. A.5 Temperatures and Axial Deformation for Column HS2-5 (a) Furnace Temperatures
(b) Temperatures in Reinforcement (c) Temperatures in Concrete (d) Axial Deformation
Table. A.6 Temperatures and Axial Deformation for Column HS2-6 (a) Furnace Temperatures
(b) Temperatures in Reinforcement (c) Temperatures in Concrete (d) Axial Deformation
Table. A.7 Temperatures, Axial Deformation and Bearing Rotations for Column HS2-7 (a) Furnace Temperatures
(b) Temperatures in Reinforcement (c) Temperatures in Concrete
(d) Axial Deformation and Bearing Rotations
Table. A.8 Temperatures, Axial Deformation and Bearing Rotations for Column HS2-8
(a) Furnace Temperatures
(b) Temperatures in Reinforcement (c) Temperatures in Concrete
(d) Axial Deformation and Bearing Rotations
Table. A.9 Temperatures, Axial Deformation and Bearing Rotations for Column HS2-9 (a) Furnace Temperatures
(b) Temperatures in Reinforcement (c) Temperatures in Concrete
(d) Axial Deformation and Bearing Rotations
Table. A.10 Temperatures, Axial Deformation and Bearing Rotations for Column HS2-10 (a) Furnace Temperatures
(b) Temperatures in Reinforcement (c) Temperatures in Concrete
(d) Axial Deformation and Bearing Rotations List of Figures
Fig. A.1
Temperatures and Axial Deformation for Column HS2-1
(a) Furnace Temperatures
(b) Reinforcement Temperatures
(c) Concrete Temperatures
(d) Axial Deformations
Fig. A.2
Temperatures and Axial Deformation for Column HS2-2
(a) Furnace Temperatures
(b) Temperatures in Reinforcement
(c) Temperatures in Concrete
(d) Axial Deformations
Fig. A.3
Temperatures and Axial Deformation for Column HS2-3
(a) Furnace Temperatures
(b) Temperatures in Reinforcement
(c) Temperatures in Concrete
(d) Axial Deformations
Fig. A.4
Temperatures and Axial Deformation for Column HS2-4
(a) Furnace Temperatures
(b) Temperatures in Reinforcement
(c) Temperatures in Concrete
(d) Axial Deformations
Fig. A.5
Temperatures and Axial Deformation for Column HS2-5
(a) Furnace Temperatures
Fig. A.6
Temperatures and Axial Deformation for Column HS2-6
(a) Furnace Temperatures
(b) Temperatures in Reinforcement
(c) Temperatures in Concrete
(d) Axial Deformations
Fig. A.7
Temperatures, Axial Deformation and Bearing Rotations for Column
HS2-7
(a) Furnace Temperatures
(b) Temperatures in Reinforcement
(c) Temperatures in Concrete
(d) Axial Deformations
(e) Top Bearing Rotation
(f) Bottom Bearing Rotation
Fig. A.8
Temperatures, Axial Deformation and Bearing Rotations for Column
HS2-8
(a) Furnace Temperatures
(b) Temperatures in Reinforcement
(c) Temperatures in Concrete
(d) Axial Deformations
(e) Top Bearing Rotation
(f) Bottom Bearing Rotation
Fig. A.9
Temperatures, Axial Deformation and Bearing Rotations for Column
HS2-9
(a) Furnace Temperatures
(b) Temperatures in Reinforcement
(c) Temperatures in Concrete
(d) Axial Deformations
(e) Top Bearing Rotation
(f) Bottom Bearing Rotation
Fig. A.10
Temperatures, Axial Deformation and Bearing Rotations for Column
HS2-10
(a) Furnace Temperatures
(b) Temperatures in Reinforcement
(c) Temperatures in Concrete
(d) Axial Deformations
(e) Top Bearing Rotation
(f) Bottom Bearing Rotation
Table A.1(a): Furnace temperatures for Column HS2-1
Note: °F = (°C x 9/5) + 32
Time Furn Avg E119 (min) (°C) (°C) 0 51 20 2 183 227 4 429 434 6 595 571 8 614 638 10 677 704 12 733 726 14 748 749 16 761 767 18 779 781 20 788 795 22 805 805 24 819 816 26 824 825 28 831 834 30 831 843 32 854 851 34 850 858 36 862 865 38 870 872 40 873 878 42 880 884 44 882 889 46 895 895 48 898 900 50 906 905 52 899 909 54 913 914 56 920 918 58 914 923 60 922 927 65 935 937 70 943 946 75 955 955 80 962 963 85 970 971 90 970 978 95 985 985 100 988 991 105 993 996 110 992 1001
Table A.1(a): Furnace temperatures for Column HS2-1 (cont’d)
Note: °F = (°C x 9/5) + 32
Time Furn Avg E119 (min) (°C) (°C) 140 1019 1024 150 1025 1031 160 1033 1038 170 1040 1045 180 1052 1052 190 1059 1059 200 1068 1066 210 1071 1072 220 1079 1079 230 1085 1086 240 1097 1093 250 1094 1100 260 1106 1107 270 1110 1114 280 1117 1121 290 1123 1128
Table A.1(b): Temperatures in reinforcement for Column HS2-1
Note:
°F = (°C x 9/5) + 32
Time Temperatures at Thermocouple Number Furn Avg E119 (see Figure 2 for thermocouple locations)
(min) 11 12 13 14 15 (°C) (°C) 0 20 20 20 20 20 51 20 2 20 20 20 20 21 183 227 4 21 21 20 20 23 429 434 6 22 22 21 21 30 595 571 8 25 26 22 23 39 614 638 10 30 30 24 27 51 677 704 12 38 36 27 29 65 733 726 14 49 48 33 33 76 748 749 16 60 66 42 39 84 761 767 18 69 90 57 45 94 779 781 20 77 104 75 52 105 788 795 22 85 110 89 58 115 805 805 24 93 113 97 64 123 819 816 26 99 113 101 70 129 824 825 28 105 112 103 77 133 831 834 30 111 113 104 82 136 831 843 32 114 114 105 88 140 854 851 34 117 117 106 93 146 850 858 36 121 120 105 97 152 862 865 38 125 123 110 101 156 870 872 40 130 127 111 103 159 873 878 42 135 131 113 103 165 880 884 44 140 136 116 103 174 882 889 46 146 142 120 103 181 895 895 48 151 149 125 104 190 898 900 50 156 155 129 104 203 906 905 52 162 162 133 105 216 899 909 54 168 169 138 106 227 913 914 56 174 176 143 110 238 920 918 58 180 183 148 113 248 914 923 60 186 191 153 116 257 922 927 65 201 210 163 125 279 935 937 70 216 228 174 133 297 943 946 75 230 246 182 139 313 955 955 80 244 264 195 144 327 962 963 85 258 280 204 155 339 970 971 90 271 296 215 164 351 970 978 95 284 311 228 174 361 985 985 100 296 325 250 183 371 988 991 105 308 338 235 192 381 993 996
Table A.1(b): Temperatures in reinforcement for Column HS2-1 (cont’d)
Note:
°F = (°C x 9/5) + 32
Time Temperatures at Thermocouple Number Furn Avg (see Figure 2 for thermocouple locations)
(min) 11 12 13 14 15 (°C) (°C) 120 341 375 271 220 406 1008 1010 130 361 397 287 239 422 1017 1017 140 380 416 307 256 437 1019 1024 150 397 434 322 273 450 1025 1031 160 414 450 339 289 463 1033 1038 170 429 465 354 304 475 1040 1045 180 444 479 367 318 486 1052 1052 190 457 492 379 331 497 1059 1059 200 470 504 366 345 508 1068 1066 210 481 516 388 357 518 1071 1072 220 492 526 400 370 528 1079 1079 230 503 536 418 382 537 1085 1086 240 512 546 394 395 547 1097 1093 250 521 555 371 407 556 1094 1100 260 530 564 368 419 565 1106 1107 270 538 572 373 431 573 1110 1114 280 547 580 381 443 582 1117 1121 290 555 588 390 457 591 1123 1128 299 562 596 406 459 599 1129 1134 E119
Table A.1(c): Temperatures in concrete for Column HS2-1
Note: °F = (°C x 9/5) + 32
Time Temperatures at Thermocouple Number Furn Avg E119
(see Figure 2 for thermocouple locations)
(min) 1 2 3 4 5 6 7 8 9 10 (°C) (°C) 0 20 20 20 20 20 20 20 21 20 20 51 20 2 24 20 20 20 20 20 20 33 20 21 183 227 4 36 21 20 20 20 20 20 63 20 23 429 434 6 59 22 20 20 20 20 21 103 20 30 595 571 8 89 23 21 20 20 20 23 144 20 40 614 638 10 110 25 21 20 20 20 27 175 20 52 677 704 12 89 29 23 20 20 20 37 214 20 66 733 726 14 88 35 25 20 20 20 56 255 21 82 748 749 16 147 33 27 20 20 21 75 297 22 106 761 767 18 178 37 31 20 20 21 91 336 22 116 779 781 20 203 37 36 21 20 22 98 372 24 122 788 795 22 221 41 41 21 20 23 101 405 25 131 805 805 24 245 40 45 21 20 24 103 436 27 140 819 816 26 264 26 50 22 20 25 104 464 30 148 824 825 28 282 126 55 23 20 27 105 489 32 158 831 834 30 299 133 59 24 21 29 106 511 35 169 831 843 32 314 142 65 25 21 31 109 530 39 180 854 851 34 330 153 70 26 22 33 114 550 42 191 850 858 36 344 164 80 28 22 36 118 566 47 202 862 865 38 357 173 92 30 23 38 122 581 53 212 870 872 40 370 182 98 32 24 40 127 595 60 222 873 878 42 382 192 101 34 25 43 133 608 66 232 880 884 44 393 201 103 37 26 46 139 619 72 241 882 889 46 404 210 106 39 27 48 146 630 76 249 895 895 48 415 219 108 42 29 51 153 641 80 258 898 900 50 425 227 109 44 30 54 159 651 83 267 906 905
Table A.1(c): Temperatures in concrete for Column HS2-1 (cont’d)
Note: °F = (°C x 9/5) + 32
Time Temperatures at Thermocouple Number Furn Avg E119
(see Figure 2 for thermocouple locations)
(min) 1 2 3 4 5 6 7 8 9 10 (°C) (°C) 52 434 235 109 46 32 56 167 659 86 275 899 909 54 442 242 109 48 33 59 174 667 88 283 913 914 56 451 245 109 50 35 62 182 675 90 291 920 918 58 459 255 110 52 37 64 190 682 91 299 914 923 60 467 251 111 54 39 67 197 689 92 307 922 927 65 484 230 115 59 44 73 217 706 95 325 935 937 70 499 129 119 65 48 78 237 721 97 341 943 946 75 513 113 124 71 53 82 255 735 99 357 955 955 80 525 86 129 76 57 86 273 747 101 371 962 963 85 536 72 135 81 61 91 289 758 103 384 970 971 90 547 58 142 85 65 96 303 769 107 396 970 978 95 556 50 150 88 69 101 316 780 110 407 985 985 100 565 50 158 90 73 106 328 788 113 418 988 991 105 573 50 165 93 77 112 339 797 117 428 993 996 110 581 51 172 97 81 117 351 805 121 437 992 1001 115 588 53 179 100 84 123 362 812 125 446 1003 1006 120 595 55 186 103 88 129 372 818 129 454 1008 1010 130 607 63 199 110 95 140 392 830 136 470 1017 1017 140 618 59 214 118 104 151 411 841 145 484 1019 1024 150 627 60 229 127 112 162 429 852 156 498 1025 1031 160 632 61 244 136 121 174 444 861 167 511 1033 1038 170 578 62 259 142 130 185 458 870 179 522 1040 1045 180 500 66 273 147 301 195 470 878 191 533 1052 1052 190 472 70 289 155 381 205 481 887 205 544 1059 1059 200 471 78 302 165 395 214 491 894 216 553 1068 1066 210 497 81 316 174 407 223 501 891 228 563 1071 1072 220 513 88 328 182 419 232 510 883 239 572 1079 1079 230 529 93 339 190 430 241 518 889 249 581 1085 1086
![Table 4: Summary of test parameters and results from earlier fire endurnace tests [9]](https://thumb-eu.123doks.com/thumbv2/123doknet/14184180.476808/26.1188.56.1141.143.676/table-summary-test-parameters-results-earlier-endurnace-tests.webp)