https://doi.org/10.4224/23003981
READ THESE TERMS AND CONDITIONS CAREFULLY BEFORE USING THIS WEBSITE. https://nrc-publications.canada.ca/eng/copyright
Vous avez des questions? Nous pouvons vous aider. Pour communiquer directement avec un auteur, consultez la première page de la revue dans laquelle son article a été publié afin de trouver ses coordonnées. Si vous n’arrivez pas à les repérer, communiquez avec nous à PublicationsArchive-ArchivesPublications@nrc-cnrc.gc.ca.
Questions? Contact the NRC Publications Archive team at
PublicationsArchive-ArchivesPublications@nrc-cnrc.gc.ca. If you wish to email the authors directly, please see the first page of the publication for their contact information.
NRC Publications Archive
Archives des publications du CNRC
For the publisher’s version, please access the DOI link below./ Pour consulter la version de l’éditeur, utilisez le lien DOI ci-dessous.
Access and use of this website and the material on it are subject to the Terms and Conditions set forth at
Evaluation of the communication performance of the C4 chemical,
biological, radiological and nuclear mask
Hoeller, Christoph; Müller-Trapet, Markus; King, Frances; Bradley, John
https://publications-cnrc.canada.ca/fra/droits
L’accès à ce site Web et l’utilisation de son contenu sont assujettis aux conditions présentées dans le site LISEZ CES CONDITIONS ATTENTIVEMENT AVANT D’UTILISER CE SITE WEB.
NRC Publications Record / Notice d'Archives des publications de CNRC: https://nrc-publications.canada.ca/eng/view/object/?id=608ae470-89e7-4b89-be24-93eed32b6831 https://publications-cnrc.canada.ca/fra/voir/objet/?id=608ae470-89e7-4b89-be24-93eed32b6831
Evaluation of the
Communication Performance of the
C4 Chemical, Biological, Radiological
and Nuclear Mask
Christoph Hoeller, Markus Müller-Trapet, Frances King, John Bradley
A1-009652.2
10 July 2018
Table of Contents
1. Introduction ... 1 2. C4 Respirator ... 2 3. Test Method ... 3 3.1 Overview ... 3 3.2 Issues ... 3 4. Test Environment ... 5 4.1 Reverberation Time ... 8 4.2 Background Noise ... 9 5. Pilot Test ...10 5.1 Participants ...10 5.2 Test Procedure ...115.3 Results and Conclusions from the Pilot Test ...11
6. Communication Performance Evaluation ...14
6.1 Participants ...14
6.2 Test Procedure ...15
7. Results ...17
7.1 Overall Performance Rating...17
7.2 Detailed Analysis ...18
7.3 Questionnaire ...26
8. Summary and Conclusions ...28
Acknowledgments ...29
List of Figures
Figure 1: C4 respirator ... 2
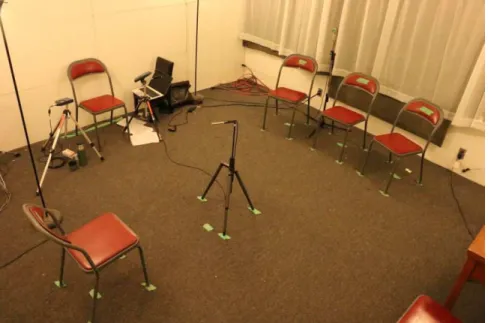
Figure 2: Setup of the test environment. The chair on the left indicates the talker position. The three chairs on the right indicate the listener positions. The chairs on the top and the bottom (only partly visible) of the image indicate the administrator positions. The microphone in the center (at 1 m from the talker position) was used to train the talker and to record the talker voice levels during the trials. ... 6
Figure 3: Setup of the test environment. Similar image as in Figure 2, but this time taken from behind the listener positions. Also visible here are the second microphone used to measure the background noise (next to the listener positions at head height) and two of the four loudspeakers used to generate the 60 dB(A) pink background noise. ... 6
Figure 4: Test environment with participants. Talkers and listeners were instructed to sit up straight with both feet on the ground, in order to keep the distance between talker and listeners as constant as possible. The talker in this staged image is leaning back slightly too much – this would have been corrected during the actual trial. ... 7
Figure 5: Reverberation time (T30) measured at each of the three listener positions, with the source placed at the talker position ... 8
Figure 6: Sound pressure levels in octave bands in the Room Acoustic Test Space measured at listener position 2, for the background noise and for the pink noise played back through the loudspeakers ... 9
Figure 7: Outlier detection for the scores by talker for C4 respirator ...19
Figure 8: Outlier detection for the scores by listener for C4 respirator ...20
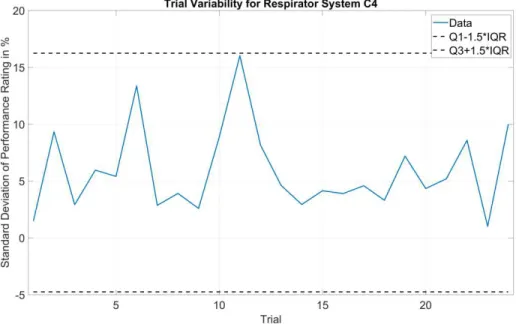
Figure 9: Outlier detection for the scores by variation across listeners for C4 respirator ...21
Figure 10: Performance ratings evaluated separately for each test day ...22
Figure 11: Performance ratings evaluated separately for morning (AM) and afternoon (PM) trials ...23
Figure 12: Performance ratings evaluated separately for the three listener positions ...24
Figure 13: Correlation between signal-to-noise ratio and percentage of correctly identified words, with and without respirator ...25
List of Tables
Table 1: Change in performance ratings for repeated trials with the same talker/listener combination, compared with the original trial ...12 Table 2: Performance ratings (mean and standard error) for the C4 respirator and different types of evaluation ...17 Table 3: Subjective ratings (mean and standard deviation) of the C4 respirator in terms of talking and listening on a scale from 1 = “Easy” to 5 = “Difficult” ...27
Executive Summary
In a recent study on the subjective communication performance of general service respirators (GSRs) for protection against chemical, biological, radiological and nuclear (CBRN) threats and hazards, the performance of the C4 CBRN Mask, hereafter referred to as the C4 respirator, currently in use by the Canadian Armed Forces was evaluated. The evaluation procedure followed the test protocol described in the NIOSH standard test procedure TEB-CBRN-APR-STP-0313 [1].
The tests were conducted between May 3rd and May 5th, 2017 in the Room Acoustic Test Space at the National Research Council Canada in Ottawa. Twenty-four volunteers participated in the tests. The participants were recruited from the Canadian Armed Forces, and were screened for normal hearing and clear speech. In addition, a Pilot Test was conducted prior to the Communication Performance Evaluation tests to confirm and finalize the test procedures. The Pilot Test was carried out on March 28th and 29th, 2017 in the Room Acoustic Test Space at the National Research Council Canada in Ottawa. This report presents the results of both the Pilot Test and the Communication Performance Evaluation.
The data was evaluated according to the NIOSH test procedure, to obtain an overall performance rating for the C4 respirator. In addition, a detailed analysis of the data set was conducted that confirms the internal validity of the test.
The overall performance rating for the C4 respirator is shown in the table below. The first number is the mean value, and the second number is the standard error.
Respirator Overall Performance Rating
1. Introduction
The Canadian Armed Forces (CAF) are using chemical, biological, radiological and nuclear (CBRN) general service respirators (GSRs) to defend against CBRN threats and hazards to protect personnel and ensure that they can safely and successfully carry out missions. The CBRN GSR currently in use by the CAF is the C4 respirator. The National Research Council Canada assessed the communication performance of the C4 respirator. This report presents the results of the performance test.
The method for assessing the communication performance used in this study was the NIOSH standard test procedure TEB-CBRN-APR-STP-0313 [1]. Other methods exist to evaluate the communication performance of respirators, but historically the NIOSH standard test procedure has been used. This report details the implementation and results of the tests conducted at the National Research Council Canada, following the NIOSH standard test procedure.
2. C4 Respirator
The communication performance of the C4 respirator was evaluated in this project. The respirators were provided by the Royal Military College of Canada, Kingston, Ontario. All participants in the study were sized and fitted for each C4 respirator, and were trained in the correct handling and wearing of each C4 respirator. In addition, the researchers conducting the study were also trained in handling each C4 respirator, including correct donning and doffing, sizing and fitting procedures, maintenance and cleaning. This was to ensure that the C4 respirators were used according to the Canadian Armed Forces B-GJ-005-311/FP-020 – Chemical, Biological, Radiological and Nuclear Defence Tactics, Techniques and Procedures manual.
The C4 respirator is depicted in Figure 1.
3. Test Method
The communication performance of the C4 respirator was assessed using the NIOSH standard test procedure TEB-CBRN-APR-STP-0313, “Determination of Communication Performance Test for Speech Conveyance and Intelligibility of Chemical Biological Radiological and Nuclear (CBRN) Full-Facepiece Air-Purifying Respirator (APR) Standard Testing Procedure” [1].
3.1 Overview
The NIOSH test procedure TEB-CBRN-APR-STP-0313 was designed to assess the communication performance of respirator systems, using scores from a Modified Rhyme Test (MRT). The MRT assesses a listener’s ability to comprehend single words from a talker. The test protocol requires a number of volunteers which take turns in reading out loud lists of predefined words. The test is performed in a controlled acoustic environment, with and without talkers and listeners wearing the respirators of interest.
The MRT uses the Word Lists in Appendix B. Each Word List contains 50 test words (consonant-vowel-consonant) together with a carrier phrase (such as “The word is…”). The talker reads the Word List at a specified level and pace, and the listeners are asked to select the word they recognize from a set of 6 possible options, using the Listener Response Sheets in Appendix D.1 and D.2. The 6 possible words contrast either the leading consonant (e.g. dig, wig, big, fig, pig, rig) or the final consonant (e.g. but, bug, bus, buff, bun, buck). By counting the number of correctly identified words with and without wearing the respirator, the relative decrease in speech intelligibility due to the respirator can be assessed.
The test is performed in a controlled acoustic environment, in continuous background noise of 60 dB(A) with a pink spectrum. The talker is trained to talk at a level of 75 to 85 dB(A) (which corresponds to a voice level classified between “loud” and “shouted” [2,3]) and at a pace of one phrase every six seconds. Talkers and listeners are seated 3 m apart from each other.
The NIOSH test procedure requires at least eight participants, of which three act as listeners and five act as talkers. Using a larger number of talkers and listeners will result in higher statistical confidence in the test results.
3.2 Issues
When preparing and setting up the test, it was noted that the NIOSH procedure does not specify some parameters that may influence the overall performance ratings.
Reverberation time of the test environment
The NIOSH procedure does not specify the reverberation time of the test environment, nor any other acoustic parameter describing the test environment except that it should be free of noise interference. The reverberation time of a room can have a significant effect on speech intelligibility [4,5], with higher reverberation times resulting in a decrease in intelligibility. For this study, the reverberation time of the test environment was adjusted to be relatively low, see Section 4.1.
Noise spectrum at the listener position
The NIOSH procedure requires a calibrated noise source which generates pink noise. However, the frequency response and directionality of the loudspeakers are not considered, and neither are the room acoustic response and possible interference effects between the two loudspeakers. Since the NIOSH procedure does not require the measurement of the sound spectrum at the listener position, but only the measurement of the sound level in dB(A), the sound spectrum at the listener position is effectively unknown and not regulated. This parameter can introduce a significant variability in the test results. The setup used in this study used an audio chain that was equalized to produce a “true” pink noise source spectrum at 60 dB(A) at the listener position, see Section 4.2.
Talker voice level
The NIOSH procedure requires the talker to speak at a voice level of 75 to 85 dB(A) (without respirator). The procedure does not specify at what distance this level should be measured. It states that the level should be measured “at a convenient distance”, which may be interpreted as 1 ft away, or 1 m away, or 3 m away at the listener position. Most research studies use a distance of 1 m from the talker when measuring voice levels [2,3], and this was also the approach taken in this study.
Furthermore, the NIOSH procedure also does not specify which acoustic parameter should be used when determining the voice level of 75 to 85 dB(A). Since the level of speech fluctuates over time, an averaging parameter such as the LA,eq will yield lower values than a measure of the maximum level such as the LA,F,max (for a definition of these acoustic parameters see the glossary in Appendix A). In this study, the parameter of LA,F was used to train the talkers, and the LA,eq was used to document and control the voice levels, see Section 6.2.
Due to the ambiguities in the test procedure described above, a Pilot Test was conducted prior to the actual test to confirm the procedures and settings used in this study. The Pilot Test is described in Section 5.
4. Test Environment
The test environment for this study was the Room Acoustic Test Space at the National Research Council in Ottawa. This test space has been fitted specifically for the purpose of subjective listening tests, providing a well-defined, adjustable reverberation time and good acoustic isolation from the surrounding environment.
The room is 3.60 m high, 4.55 m long, and 4.70 m wide. The setup of the positions of the test subjects, the administrators and the equipment used for both the Pilot Test (Section 5) as well as the Communication Performance Evaluation (Section 6) is shown in Figure 2 and Figure 3. The test scenario with participants is shown in Figure 4.
Following the guidelines from the NIOSH procedure [1], the setup was as follows:
• The distance between the talker position (bottom left in Figure 2) and the three listener positions (top right in Figure 2) was 3 m.
• Listener position 2 was positioned in the middle, with listener position 1 on the left side and listener position 3 on the right side, as seen from the perspective of the talker (e. g. in Figure 2 and Figure 4)
• The microphone measuring the talker voice level (center in Figure 2) was positioned at a distance of 1 m from the center of the head of a talker sitting upright on the chair. • The second microphone to measure the background level at the listener positions (top
right in Figure 3) was placed at head-level between listener positions 1 and 2.
• Two-way PA loudspeakers were positioned in the two corners behind the talker position (one loudspeaker is visible in the top of Figure 3), each facing into the corner to avoid an influence due to the directivity of the loudspeaker.
• Two administrators were seated close to the walls of the room between the talker position and the listener positions (one administrator position is visible in the top of Figure 3 and the other chair is partly visible in the bottom right corner of Figure 2). The sound level meters used in this study were a Norsonic Nor118 and a Norsonic Nor140.
Figure 2: Setup of the test environment. The chair on the left indicates the talker position. The three chairs on the right indicate the listener positions. The chairs on the top and the
bottom (only partly visible) of the image indicate the administrator positions. The microphone in the center (at 1 m from the talker position) was used to train the talker and
to record the talker voice levels during the trials.
Figure 3: Setup of the test environment. Similar image as in Figure 2, but this time taken from behind the listener positions. Also visible here are the second microphone used to measure the background noise (next to the listener positions at head height) and two of
Figure 4: Test environment with participants. Talkers and listeners were instructed to sit up straight with both feet on the ground, in order to keep the distance between talker and
listeners as constant as possible. The talker in this staged image is leaning back slightly too much – this would have been corrected during the actual trial.
4.1 Reverberation Time
To document the room acoustic properties, the reverberation time (T30) of the Room Acoustic Test Space was measured with a Brüel & Kjær Type 2250 acoustic analyzer and a Yamaha studio monitor loudspeaker.
The reverberation times were measured with the loudspeaker at the talker position and the microphone at each of the three listener positions. They are shown as a function of frequency in Figure 5. It can be seen that the reverberation time is very similar between the three listener positions, so a similar room acoustic response can be assumed. The reverberation time in the Room Acoustic Test Space was low enough to allow good speech intelligibility [4,5].
Figure 5: Reverberation time (T30) measured at each of the three listener positions, with the source placed at the talker position
4.2 Background Noise
The NIOSH test procedure requires artificial background noise in the form of a pink noise signal to be played back through the loudspeakers in the room. The target of the overall noise level is 60 dB(A) ± 2 dB(A). For this study, the pink noise signal was generated and played back with a Yamaha DME32 digital mixing engine. The signal from the DME32 was then amplified using two Bryston power amplifiers and fed to the loudspeakers.
The spectral shape of the background noise in the room is not specified in [1], which can be a source of uncertainty for the performance scores that are obtained because the actual signal-to-noise ratio in each frequency band may vary significantly. To ensure a well-defined signal-to-noise signal at the listener position, the pink noise signal produced by the loudspeakers was equalized to obtain a “true” pink noise spectrum at the listener position. This is shown in Figure 6, together with the background noise when the loudspeakers were switched off. It can be seen that the target for the pink noise of 60 dB(A) is exactly obtained and the equalized noise spectrum is flat (standard deviation across frequency is 0.5 dB).
Figure 6: Sound pressure levels in octave bands in the Room Acoustic Test Space measured at listener position 2, for the background noise and for the pink noise played
5. Pilot Test
A Pilot Test was conducted to confirm and finalize the test procedures before conducting the Communication Performance Evaluation described in Section 6. For the Pilot Test, only 6 participants were used. The Pilot Test was carried out on March 28th and 29th, 2017 in the Room Acoustics Test Space at the National Research Council in Ottawa.
5.1 Participants
The Canadian Armed Forces recruited eight volunteers as potential participants for the Pilot Test. Each participant gave written informed consent prior to the start of the Pilot Test. The procedures for the study were reviewed by the NRC Research Ethics Board, under Protocol No. 2016-81 (NRC Project No. A1-009652).
The NIOSH test method requires that all test participants shall be fluent in English, have no obvious or strong regional or foreign accents, and shall have normal hearing. The Pilot Test participants were therefore screened prior to participating in the test.
5.1.1 Hearing Sensitivity Screening
For the hearing sensitivity screening, a standard pure-tone audiometry test was performed. Frequencies between 125 Hz and 8 kHz were tested. The tests were performed in the anechoic chamber at the National Research Council Canada, using a hand-held audiometer (Otovation Amplitude T4 with transducer TDH-39) and a connected laptop with evaluation software.
5.1.2 Talker Screening
For the talker screening, each candidate was asked to read out loud one of the Word Lists in Appendix B. Three NRC researchers evaluated the talker characteristics. One of the NRC researchers filled out the Talker Screening Form in Appendix C.2 while the participant was reading the words, simulating the test procedure. Two NRC researchers with experience in speech intelligibility tests assessed the candidate’s voice quality and level using a form specifically developed for this screening (see Appendix C.1). As a final step, each candidate was asked to complete the Language Questionnaire in Appendix C.3 (which is based on [6]).
5.1.3 Selection of Participants
Based on the results from the hearing sensitivity screening and the talker screening described in Sections 5.1.1 and 5.1.2, five participants were selected from the pool of eight volunteers to take part in the Pilot Test. One additional participant was added from among NRC staff for the Pilot Test. The six participants were between the ages of 30 and 55. Five of the six participants were males, and one was female.
Two of the six participants had a mild Hearing Loss (between 25 and 40 dB) in one or both ears. However, this was deemed acceptable for this Pilot Test. The other Pilot Test participants had normal hearing, here defined as a Hearing Loss of 25 dB or less between 125 Hz and 8 kHz in both ears. All six participants were fluent in English, without obvious or strong regional or foreign accents.
5.2 Test Procedure
The test procedure for the Pilot Test followed the procedures of the NIOSH standard test procedure [1], which are also described in Section 3 of this report. The tests took place in the Room Acoustic Test Space described in Section 4.
Twelve trials were performed on the first day. Each trial consisted of a talker reading one of the Word Lists in Appendix B, and three listeners filling out the Listener Response Sheets in Appendix D.1 and D.2, for a total of 36 completed response sheets. Each of the six participants acted as the talker twice, with and without the respirator, and as a listener six times.
On the second day, additional trials were performed to investigate the importance of certain parameters and to optimize the test procedures. Some of the results from these additional trials are reported below, but the results from the second day of testing were not taken into account in the calculation of the overall performance rating of the respirator.
5.3 Results and Conclusions from the Pilot Test
This section presents some of the results and conclusions from the Pilot Test.
5.3.1 Overall Performance Rating
The overall performance rating for the respirator used in the Pilot Test was calculated using the method outlined in the NIOSH standard test procedure [1]. The number of correctly identified words when talker and listeners were wearing the respirator was compared with the number of correctly identified words without the respirator. Scores were corrected for words misspoken by the talker, and for chance or guessing made possible by the multiple-choice format of the Listener Response Sheet. Only the results from the first day of testing were considered in the calculation of the overall performance rating, because the trials on the second day included participants with strong accents.
The overall performance rating for the Pilot Test is presented in the following table. The first number is the mean value, and the second number is the standard error. Due to the limited number of participants in the Pilot Test, the standard error is higher than in the Communication Performance Evaluation in Section 6.
Respirator Overall Performance Rating (Pilot Test)
C4 respirator 90.2 ± 8.6
5.3.2 Variability
The standard error of the performance rating was 8.6. This indicates that the variability of the overall performance rating was high. The range of individual performance ratings separated by talker/listener combination was 27.3 points wide. Separated by talker and averaged over the three listeners, the performance ratings included a range of 20.6 points. These values indicate a significant variability in the test results depending on the talker.
5.3.3 Repeatability
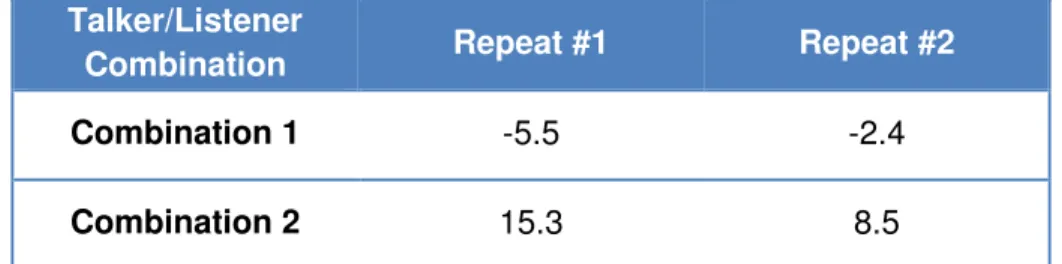
On the second day of testing, four of the trials from the first day were repeated (two with and two without respirators), with the same talker/listener combinations, to investigate the repeatability of the test results. The changes in performance ratings between the original trial and the repeated trials are shown in Table 1.
Talker/Listener
Combination Repeat #1 Repeat #2
Combination 1 -5.5 -2.4
Combination 2 15.3 8.5
Table 1: Change in performance ratings for repeated trials with the same talker/listener combination, compared with the original trial
The values in Table 1 indicate that even with the same talkers and listeners, the results of the repeated trials show a rather high variation. In order to reduce the inherent uncertainty associated with the test results, it is therefore necessary to use a large number of test participants and trials to increase the statistical confidence in the average results.
5.3.4 Effect of Non-Native Talkers/Listeners
To investigate the effect of using non-native English speakers as participants, several trials were performed with a francophone participant with good English skills but with a strong French accent when talking English. When the francophone participant acted as the talker, the average performance ratings were 11.7 points lower (for the first trial with the non-native talker) and 2.6 points higher (for the second trial) than the average overall performance rating. While the large variation and small sample size do not allow formulating statistically valid conclusions, the value from the first trial with the non-native talker was the lowest performance rating for a trial recorded during the Pilot Test. Furthermore, when the francophone participant acted as a listener, the performance ratings were 22.9 and 15.4 points lower than the average overall performance rating. These two values were among the three lowest individual ratings recorded during the Pilot Test. These results underline the importance of using native speakers for both talking and listening tasks for the test procedure.
5.3.5 Other Observations
Several other observations were made during the Pilot Test:
• It was found that talking at the required voice level was difficult for some talkers and that some talkers were getting hoarse after reading one or two Word Lists in a row. As a consequence, the sequence of the actual tests was adjusted to allow the talkers more rest between trials.
• It was found that the instructions provided by the test administrators can influence the results, particularly during the training of the talkers. As a consequence, the instructions for participants were made more consistent.
• Several small changes were made to processes regarding the test administration, to allow for a smooth implementation of the actual tests.
• Several small changes were made to the forms provided in the Appendix, to remove ambiguities and make them more user-friendly.
6. Communication Performance Evaluation
The Communication Performance Evaluation was carried out between May 3rd and 5th, 2017 in the Room Acoustic Test Space at the National Research Council Canada in Ottawa. The total number of participants was 24. The participants were divided into groups of eight, split across three days.
6.1 Participants
The NIOSH test method requires that all test participants shall be fluent in English, have no obvious or strong regional or foreign accents, and shall have normal hearing. As many members of the Canadian Armed Forces are bilingual, it was deemed important to screen any potential test participants prior to the Communication Performance Evaluation.
The participant screening took place on April 24th and 25th, 2017 at the Canadian Armed Forces Base in Kingston, Ontario. Forty-one members of the Canadian Armed Forces were screened. Each candidate gave written informed consent prior to the screening. The procedures for the study were reviewed by the NRC Research Ethics Board, under Protocol No. 2016-81 (NRC Project No. A1-009652).
6.1.1 Training Session on the C4 Respirators
Prior to the participant screening on April 24th and 25th, the 41 candidates were trained on the use of the C4 respirators. The training session took place on April 20th, 2017 at the Canadian Armed Forces Base in Kingston, Ontario. The training session included sizing, fitting, donning, clearing and doffing procedures.
6.1.2 C4 Respirator Fitting Screening
For the fitting screening, each candidate went through the Quantitative Fit Testing (QNFT) station at the Royal Military College of Canada (RMCC) in Kingston, Ontario, where they were sized with the C4 respirator. Adequate protection and comfort were required in order to validate the correct C4 respirator size.
6.1.3 Hearing Sensitivity Screening
For the hearing sensitivity screening, a standard pure-tone audiometry test was performed. Frequencies between 125 Hz and 8 kHz were tested. The tests were performed in a standard audiometric booth, using a hand-held audiometer (Otovation Amplitude T4 with transducer TDH-39) and a connected laptop with evaluation software.
6.1.4 Talker Screening
For the talker screening, each candidate was asked to read out loud one of the Word Lists in Appendix B. Three NRC researchers evaluated the talker characteristics. One of the NRC researchers filled out the Talker Screening Form in Appendix C.2 while the participant was reading the words, simulating the test procedure. Two NRC researchers with experience in speech intelligibility tests assessed the candidate’s voice quality and level using a form
specifically developed for this screening (see Appendix C.1). As a final step, each candidate was asked to complete the Language Questionnaire in Appendix C.3 (which is based on [6]).
6.1.5 Selection of Participants
Based on the results from the QNFT screening, the hearing sensitivity screening, and the talker screening described in Sections 6.1.2, 6.1.3, and 6.1.4, 24 participants were selected to take part in the Communication Performance Evaluation. The 24 participants were between the ages of 18 and 37 (mean age: 23 years, standard deviation: 4.3 years). Four of the 24 participants were females, and 20 of the 24 participants were males. In addition, 6 participants were selected as back-up, in case any of the 24 participants were unable to meet the requirements on the test days. However, all 24 participants were available and healthy on the test days, and the 6 spare participants were not needed for the Communication Performance Evaluation. All except one of the selected participants had a Hearing Loss of 25 dB or less between 125 Hz and 8 kHz in both ears, indicating normal hearing. One participant had a Hearing Loss of 40 dB at one frequency (6 kHz) in one ear, but this was considered acceptable for this study. The Pure Tone Average (PTA of 500 Hz, 1 kHz, 2 kHz) for the 24 selected participants was 2.5 ± 4.8 dB for the left ear and 1.7 ± 4.1 dB for the right ear.
All 24 participants were fluent in English, without obvious or strong regional or foreign accents.
6.2 Test Procedure
The test procedure for the Communication Performance Evaluation followed the procedures of the NIOSH standard test procedure [1], which are also described in Section 3 of this report. The tests took place in the Room Acoustic Test Space described in Section 4.
The sound level meters used during the tests were calibrated at the beginning of each test day. Since the background noise was controlled digitally, the settings were established once and then used without further adjustment, though regular checks were performed to confirm that the background noise was still within the requirements.
Sixteen trials were performed on each day, for a total of 48 trials over three days. Each trial consisted of a talker reading one of the Word Lists in Appendix B, and three listeners filling out the Listener Response Sheets in Appendix D.1 and D.2, for a total of 144 completed response sheets. Each of the 24 participants acted as the talker twice (without and with respirator, in that order), and as a listener 6 times.
At the beginning of each day, all participants were trained for their role as listeners. They were given a chance to become familiar with the acoustic test environment, with the Listener Response Sheets, and with the procedures of the test.
In addition, all participants were trained individually for their role as talkers. Each talker was asked to read one of the Word Lists at the prescribed level of between 75 dB(A) and 85 dB(A), and with a pace of about one phrase every six seconds. The voice level was monitored using a microphone at a distance of 1 m from the talker. The instantaneous, A-weighted, fast-weighted sound pressure level LA,F (see Appendix A) was used as the acoustic parameter for the talker training. One of the two test administrators provided feedback with regards to the correct voice
level. The same test administrators were used for all trials. The talker training was conducted without respirators, and without and with background noise (in this order). Once the talker had reached the desired level and pace, they were asked to keep reading the Word List at this level and pace for a while in order to become familiar with the required voice effort level. They were then told to reproduce the same voice effort level regardless of whether they were wearing the mask, and to not compensate for the attenuation of the mask. Once the talker was wearing the mask, it was not possible to monitor the voice effort level, and hence the ability of the talkers to continue talking at the “correct” trained voice effort level is a crucial part of the test method. In order to ensure a consistent voice effort level that meets the requirements of the test procedure, the talker training was conducted immediately before the first trial for each talker. The first trial for each talker was conducted without respirator, giving the test administrator another chance to monitor and if necessary correct the voice level. The second trial was performed immediately after the first trial, with the same talker/listener combinations, and with the respirator under test.
During the trials, the two test administrators instructed the participants on their roles and responsibilities, and recorded additional data using the Test Data Collection Sheets in Appendix D.3 and D.4. Using Test Data Collection Sheet A, the correct pronunciation of the words was checked and incorrectly spoken words were indicated on the form. Using Test Data Collection Sheet B, the background noise level in the room and the talker voice level were recorded. The background noise level was measured before each set of trials, to confirm that it was stable. The talker voice level was recorded as an energy-equivalent A-weighted sound pressure level (LA,eq) for each group of 10 words. Any unusual occurrences during the trials were noted down in the comment boxes on the forms.
In addition to the standardized test method, a questionnaire was created to collect some subjective impressions in a formal manner by the participants at the end of each test day. The questionnaire is provided in Appendix E.
The data was recorded in anonymous form. All participants were assigned Participant IDs at the beginning of each test day, and only those Participant IDs were recorded on the test forms.
7. Results
This section presents the results from the Communication Performance Evaluation.
The main result is the overall performance rating for the C4 respirator, which is the average performance rating across all participants. This result is provided in Section 7.1.
The results of a detailed analysis of the data are provided in Section 7.2. The results of the questionnaire data are provided in Section 7.3.
7.1 Overall Performance Rating
The overall performance rating for the C4 respirator was calculated using the method outlined in the NIOSH standard test procedure [1]. The number of correctly identified words when talker and listeners were wearing the respirator was compared with the number of correctly identified words without respirator. Scores were corrected for words misspoken by the talker, and for chance or guessing made possible by the multiple-choice format of the Listener Response Sheet.
As already observed in other studies [7], the method of evaluating the performance rating according to [1] may hide variations that arise because of talker variability. This is because in [1] the score of correctly identified words is first averaged for each listener across all talkers, and then the performance rating is calculated per listener as the relative percentage of average scores with and without a respirator. This method of evaluation will be referred to as “NIOSH evaluation” in the following. In order to evaluate the data with respect to talker variations and to allow more detailed statistical analyses, an additional evaluation was carried out where a performance rating was first calculated for each listener/talker combination and then the average was taken across all listener/talker combinations. This method of evaluation will be referred to as “NRC evaluation”. It is the opinion of the authors that the NRC evaluation should be the preferred evaluation method. In the following, the overall performance ratings are presented for both evaluation methods.
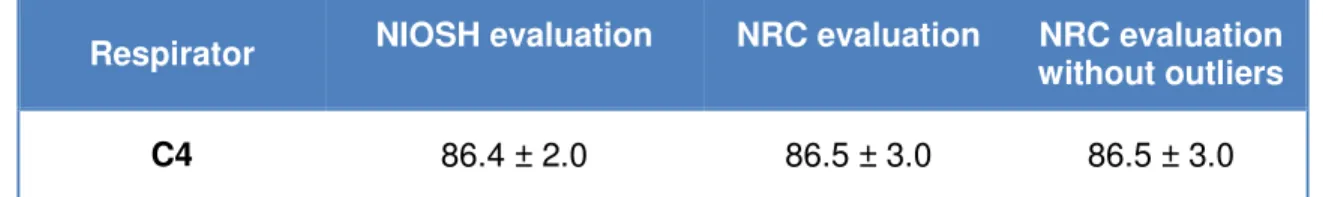
The overall performance ratings for C4 respirator are tabulated in Table 2.
Respirator NIOSH evaluation NRC evaluation NRC evaluation without outliers
C4 86.4 ± 2.0 86.5 ± 3.0 86.5 ± 3.0
Table 2: Performance ratings (mean and standard error) for the C4 respirator and different types of evaluation
It can be seen that the NIOSH evaluation method and the NRC evaluation method produce essentially the same average values, with a slightly smaller standard error for the NIOSH evaluation method. As no outliers were found for the tests with the C4 respirator, the NRC evaluation without outliers yields the same result as the NRC evaluation with outliers.
7.2 Detailed Analysis
A detailed analysis of the data was performed in order to test the data for internal validity and to identify any outliers and factors that could have influenced the overall performance ratings reported in Section 7.1.
It should be noted that the NIOSH procedure does not include or require any statistical analysis of the data, or any outlier detection. Hence, the data for the NIOSH evaluation in Table 2 can be considered the official result according to [1].
The statistical analysis presented in this section is based on the NRC evaluation method.
7.2.1 Outlier Analysis
In a first step, the data was tested for outliers. The commonly used procedure for this task is based on the quartiles and the inter-quartile range (IQR):
• The data is distributed into four equally large subsets that are comprised of a quarter of the data, obtaining the quartiles Q1, Q2 and Q3 that are the boundaries of the subsets; • The IQR is the difference between Q3 and Q1, thus indicating a range that contains 50%
of the data;
• The bounds (or fences) for outlier detection are given by [Q1-1.5*IQR, Q3+1.5*IQR] Any values that lie outside of the bounds defined above can be considered outliers. It is not generally defined what to do with outliers, and so each case has to be judged individually.
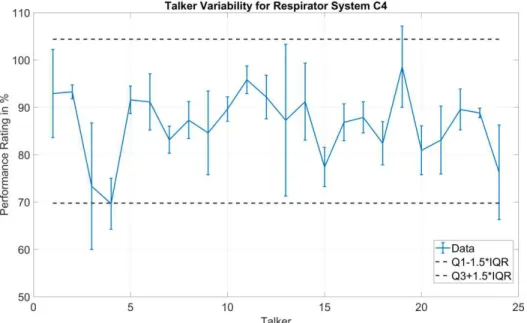
7.2.1.1 Talkers
The performance ratings were sorted by talker, and it was determined whether any one talker achieved a performance rating that differed substantially from the rest. For each talker there are three data points, from the three listener responses. In the analysis, the mean across listeners is used for outlier detection and the standard deviation is also shown in the plots to indicate the variation among listeners.
Figure 7 shows the performance ratings separated by talkers, together with the bounds for outlier detection. No outlier was detected.
7.2.1.1 Listeners
The performance ratings were next evaluated with respect to outlier results from certain listeners. Figure 8 shows the performance ratings separated by listeners, together with the bounds for outlier detection. No outliers were found in this case.
7.2.1.2 Trials
Finally, the variation across listeners was analyzed for each trial. The plot for the outlier detection is shown in Figure 9. It was found that no trial showed a particularly high variation of the scores between listeners.
7.2.2 Analysis by Individual Parameters
After the outlier detection analysis, a further analysis was performed to determine whether any of the test conditions may have led to a bias in the results.
7.2.2.1 Analysis by Day
Since testing was carried out over a span of three days, one question was whether the groups of participants achieved similar scores on each day. To investigate this, the data was evaluated for each day separately and compared. The results are shown in Figure 10.
Figure 10 and the corresponding t-test shows that there are no significant differences between the scores from each day. Note that the confidence intervals in Figure 10 are larger than for the overall performance value, because for the analysis by day there are only 8 observations per day, compared with 24 observations overall.
7.2.2.2 Analysis by Time
Another question was whether the performance would be lower for the afternoon (PM) trials in comparison to the morning (AM) trials, due to a lack of concentration after the lunch break and overall fatigue effects. To investigate this, the data was evaluated separately for the morning and afternoon trials. The results are shown in Figure 11.
Figure 11 and the corresponding t-test shows that there are no significant differences between the scores from morning and afternoon trials. Although the scores are lower for the afternoon trials, the differences are not statistically significant.
Figure 11: Performance ratings evaluated separately for morning (AM) and afternoon (PM) trials
7.2.2.1 Analysis by Listener Position
The last analysis was carried out to determine whether the listener position influenced the results in any way. To investigate this, the data was evaluated separately for each listener position. The results are shown in Figure 12.
Again, although there are variations of the data across the listener positions, the t-tests indicate that there are no statistically significant differences between the data sets and so all listener positions can be assumed to have yielded equally valid results.
Figure 12: Performance ratings evaluated separately for the three listener positions
7.2.3 Analysis of Measured Sound Pressure Levels
It has long been recognized that one of the most important parameters affecting speech intelligibility is the signal-to-noise ratio [8]. For a constant background noise level (such as 60 dB(A) with a pink spectrum as in the test method used in this study), the number of correctly identified words depends to a large degree on the talker voice level, or more specifically on the difference between talker voice level and background noise level (i. e. the signal-to-noise ratio, expressed in dB).
The importance of this relationship is illustrated in Figure 13, where the percentage of correctly identified words is plotted against the measured signal-to-noise ratio. Note that the plot shows the percentage of correctly identified words rather than the performance rating, which is the ratio of correctly identified words when wearing a respirator to that when not wearing a respirator. Clearly, the higher the signal-to-noise ratio, the higher is the percentage of correctly identified words.
Closer observation shows that the signal-to-noise ratio was highest when no respirator was worn, as would be expected. Since the participants were asked to maintain the same voice effort level when wearing a respirator, without compensating for the attenuation of the mask, the signal-to-noise ratios for the trials with respirator are generally lower.
Figure 13: Correlation between signal-to-noise ratio and percentage of correctly identified words, with and without respirator
7.3 Questionnaire
In addition to the standardized test method, a questionnaire was created to collect some subjective impressions in a formal manner by the participants at the end of each test day. The questionnaire is provided in Appendix E.
In the reported results in this section, mean values and standard deviations are used to describe the subjective scores, unlike in Sections 7.1 and 7.2 where mean values and standard errors were used.
7.3.1 Personal Details
Only one of the 24 participants had ever participated in a speech intelligibility test such as the one described in this report. It can therefore be concluded that the participants were non-experts. Using expert trained talkers has been shown to yield higher results for the MRT [9]. The NIOSH standard test procedure requires the talkers to be trained, but does not state whether expert or non-expert participants should be used.
Only three of the 24 participants had ever worn a respirator outside of training, accreditation, or testing.
7.3.2 Feedback on Listening Test
The participants were asked to provide feedback regarding the test procedures. The rating scale from “Agree fully” to “Disagree fully” was converted to numerical values from 1 to 5 for analysis:
1 Agree fully
2 Agree to some extent 3 Neither agree nor disagree 4 Disagree to some extent 5 Disagree fully
When asked to rate the statement “The test was too long”, the average response on the questionnaire was 3.33 ± 0.90, corresponding to a subjective rating between “Neither agree nor disagree” and “Disagree to some extent.” It can therefore be concluded that the length of the test did not significantly affect the performance or motivation of the test participants, at least by their own judgement (see also Figure 11 for a more objective analysis of fatigue effects).
When asked to rate the statement “I felt stressed during the test”, the average response on the questionnaire was 4.61 ± 0.57, corresponding to a subjective rating between “Disagree to some extent” and “Disagree fully.” It can therefore be concluded that nervousness or stress did not significantly affect the performance of the test participants, at least by their own judgement. When asked to rate the statement “The instructions were clear”, the average response on the questionnaire was 1.04 ± 0.20, corresponding to a subjective rating of “Agree fully.” It can therefore be concluded that the instructions to participants were very clear.
When asked to rate the statement “Talking at a raised level was difficult”, the average response on the questionnaire was 3.50 ± 1.26, corresponding to a subjective rating between “Neither agree nor disagree” and “Disagree to some extent.” While the mean value of the responses indicates that talking at a raised level was not a problem overall, the rather high standard deviation in the responses points to differences between individual talkers. Many talkers did not have any problems talking at a raised voice level, but for some this required more effort. None of the participants selected “Agree fully” for this statement, and hence it is concluded that any difficulties did not significantly affect the performance ratings.
7.3.3 Subjective Assessment of Respirator
Finally, the participants were asked to rate subjectively the respirator system evaluated in this study. A 5-point scale was given in terms of talking (from “Easy to talk” to “Difficult to talk”) and in terms of understanding/listening (from “Easy to understand” to “Difficult to understand”). As before, the rating scale was converted to numerical values between 1 and 5 for analysis. The results are summarized in Table 3.
Respirator Talking Listening
C4 2.29 ± 0.84 2.00 ± 0.71
Table 3: Subjective ratings (mean and standard deviation) of the C4 respirator in terms of talking and listening on a scale from 1 = “Easy” to 5 = “Difficult”
From the results in Table 3 it can be observed that the subjective assessment in terms of talking and listening tends towards the “easy” side of the scale, indicating a favorable judgement of the respirator for communication. This is in line with and supports the results presented in Section 7.1.
8. Summary and Conclusions
The C4 respirator was evaluated in terms of speech communication performance. The assessment was carried out following the NIOSH standard test procedure TEB-CBRN-APR-STP-0313 [1]. A Pilot Test was conducted with 6 participants, to confirm and finalize the test procedures. The Communication Performance Evaluation was conducted with 24 participants. The results of the communication performance test are reported in Section 7. The overall performance rating for the C4 respirator was 86.4 ± 2.0. The first number is the mean value, and the second number is the standard error.
A detailed analysis of the test data confirmed the internal validity of the test. The analysis revealed no bias due to talker, listener, test day, time of day, or listener position. This gives great confidence that the results obtained and presented are valid.
An additional questionnaire that was completed by the test participants after the subjective tests furthermore confirms the rating for speech communication. The questionnaire also confirms that other factors such as fatigue, stress, or unclear instructions did not affect the test.
Since some of the specifications of the NIOSH procedure are not well-defined, caution should be used when comparing the results of this study with the outcomes of similar subjective tests performed by other research teams in different laboratories. Differences in the signal-to-noise ratios caused by variations in the background noise level or in the talker voice levels in particular as well as differences in the acoustic conditions of the test environment can significantly influence the results of the tests. This may explain why the performance ratings reported by other researchers [7] are sometimes higher.
In this study, great care was taken to control, monitor, and document the test setup, the test environment, and the test procedures during the trials, beyond the requirements of the NIOSH standard. Participants in this study were screened for normal hearing and clear speech prior to the tests; a Pilot Test was conducted to confirm and finalize the test procedures; and instructions, procedures, and forms were formalized and documented thoroughly.
The authors of this report therefore believe that the results presented in this report are an accurate representation of the communication performance of the respirator system that was tested in this study.
Acknowledgments
The authors would like to thank the members of the Department of National Defense (DND), Canadian Armed Forces (CAF), Royal Military College (RMC), and the National Research Council Canada (NRC) for their help and support in the preparation and implementation of this study.
References
[1] National Institute for Occupational Safety and Health (NIOSH), Determination of Communication Performance Test for Speech Conveyance and Intelligibility of Chemical Biological Radiological and Nuclear (CBRN) Full-Facepiece Air-Purifying Respirator (APR) Standard Testing Procedure, Procedure No. TEB-CBRN-APR-STP-0313, Revision 2.0, NIOSH, 2007
[2] Olsen, W. O., Average Speech Levels and Spectra in Various Speaking/Listening Conditions: A Summary of the Pearson, Bennett, & Fidell (1977) Report. American Journal of
Audiology, 7, 1059-0889, 1998.
[3] Cushing, I. R., Li, F. F., Cox, T. J., Worrall, K., and Jackson, T., Vocal Effort Levels in Anechoic Conditions. Applied Acoustics, 72, 695-701, 2011.
[4] Long, M., Architectural Acoustics, 2nd edition, Academic Press, 2014. [5] Kuttruff, H., Room Acoustics, Taylor & Francis, 2000.
[6] Marian, V., Blumenfeld, H. K., and Kaushanskaya, M., The Language Experience and Proficiency Questionnaire (LEAP-Q): Assessing Language Profiles in Bilinguals and Multilinguals. Journal of Speech, Language, and Hearing Research, 50, 940-967, 2007.
[7] Coyne, K. M., and Barker, D. J., Speech Intelligibility While Wearing Full-Facepiece Air-Purifying Respirators. Journal of Occupational and Environmental Hygiene, 11(11), 751-756, 2014.
[8] Bradley, J. S., Predictors of Speech Intelligibility in Rooms. Journal of the Acoustical Society
of America, 80, 837-845, 1986.
[9] Coyne, K. M., and Barker, D. J., Respirator Speech Intelligibility Testing With An Experienced Speaker. ECBC-TR-1297, U.S. Army Edgewood Chemical Biological Center: Aberdeen Proving Ground, MD, 2015.
– Glossary
Appendix A
Parameter
Definition
LA,F
Instantaneous sound pressure level in dB re 20 µPa with a
frequency-weighting using the A-frequency-weighting defined in ANSI/ASA S1.42 and a
time-weighting using the “FAST” response time (125 ms)
LA,eq
Energy-equivalent time-averaged sound pressure level in dB re 20 µPa
with a frequency-weighting using the A-weighting defined in ANSI/ASA
S1.42, over a specified time period (e.g. 30s), without time-weighting
LA,F,max
Maximum sound pressure level in dB re 20 µPa with a
frequency-weighting using the A-frequency-weighting defined in ANSI/ASA S1.42 and a
time-weighting using the “FAST” response time (125 ms)
Reverberation Time T30