HAL Id: hal-02936041
https://hal.inrae.fr/hal-02936041
Submitted on 10 Sep 2020HAL is a multi-disciplinary open access archive for the deposit and dissemination of sci-entific research documents, whether they are pub-lished or not. The documents may come from teaching and research institutions in France or abroad, or from public or private research centers.
L’archive ouverte pluridisciplinaire HAL, est destinée au dépôt et à la diffusion de documents scientifiques de niveau recherche, publiés ou non, émanant des établissements d’enseignement et de recherche français ou étrangers, des laboratoires publics ou privés.
Population genetics and Genetic Stock Identification of
anadromous Salmo trutta from the Irish Sea and
adjacent areas, using
.Paulo A. Prodöhl, A. Antoniacomi, C Bradley, Jens Carlsson, Gary R.
Carvalho, Jamie Caughlan, J Coyne, Mary M.E. Crossey, M.C. Cross, Carys
Ann Davies, et al.
To cite this version:
.Paulo A. Prodöhl, A. Antoniacomi, C Bradley, Jens Carlsson, Gary R. Carvalho, et al.. Population genetics and Genetic Stock Identification of anadromous Salmo trutta from the Irish Sea and adjacent areas, using. Sea trout: Science & Management, 2017. �hal-02936041�
See discussions, stats, and author profiles for this publication at: https://www.researchgate.net/publication/316438596
Population genetics and Genetic Stock
Identification of anadromous Salmo trutta from
the Irish Sea and adjacent areas, using...
Chapter · November 2015 CITATIONS0
READS31
20 authors, including: Some of the authors of this publication are also working on these related projects: OYSTERECOVER (EU)View project Population structure, phlyogeography and stock expansion of the boarfish, Capros aper in Atlantic and Mediterranean waters
View project Paulo A. Prodöhl Queen's University Belfast 97 PUBLICATIONS 2,153 CITATIONS SEE PROFILE Jens Carlsson University College Dublin 94 PUBLICATIONS 1,295 CITATIONS SEE PROFILE Maud Cross University College Cork 11 PUBLICATIONS 52 CITATIONS SEE PROFILE Thomas E Reed University College Cork 48 PUBLICATIONS 1,014 CITATIONS SEE PROFILE
All content following this page was uploaded by Paulo A. Prodöhl on 24 April 2017.
The user has requested enhancement of the downloaded file. All in-text references underlined in blue are added to the original document and are linked to publications on ResearchGate, letting you access and read them immediately.
Population genetics and Genetic Stock Identification of anadromous Salmo
trutta from the Irish Sea and adjacent areas, using microsatellite DNA loci
P. A. PRODÖHL1*, A. ANTONIACOMI2, C. BRADLEY1, J. CARLSSON3, G. R. CARVALHO4,J. COUGHLAN2, J. COYNE6, M. E. CROSS2, M. C. CROSS2, C. A. DAVIES5, E. DILLANE2,
P. GARGAN6, R. HYNES1, P. MCGINNITY2, N. MILNER4, T. REED2, W. ROCHE6, M. TAYLOR7,
N. TYSKLIND8 & T. F. CROSS2
1Institute for Global Food Security, School of Biological Sciences, Queen's University Belfast, Medical Biology Centre, 97 Lisburn Road Belfast BT9 7BL, Northern Ireland, UK. 2Aquaculture and Fisheries Development Centre, School of Biological, Earth and Environmental Sciences, University College Cork, Ireland. 3Area 52 Research Group, School of Biology & Environmental Science/Earth Institute, University College Dublin, Belfield, Dublin, Ireland. 4Molecular Ecology & Fisheries Genetics Laboratory, School of Biological Sciences, Bangor University, Deiniol Road, Bangor LL57 2UW UK. 5Centre for Applied Marine Sciences, School of Ocean Sciences, Bangor University, Menai Bridge, Anglesey, UK. LL59 5AB.6Inland Fisheries Ireland, 3044 Lake Drive, Citywest Business Campus, Dublin D24 Y265.7School of Biological Sciences, University of East Anglia, Norwich NR4 7TJ. 8INRA, UMR EcoFoG, CNRS, Cirad, AgroParisTech, Université des Antilles, Université de Guyane, 97310 Kourou, France.
To be published in: Sea Trout: from Science to Management (Proceedings of the 2nd International Sea Trout Symposium, Dundalk, Ireland, October 2015). Editor: G.S. Harris. Self-published. Anticipated date of publication – July 2017.
ABSTRACT
The management and conservation of anadromous sea trout (Salmo trutta L.) during the marine phase of their life history depends on a better understanding their ecology and migratory behaviour in the sea. To address this knowledge gap, a Genetic Stock Identification (GSI) exercise using Individual Assignment (IA) was undertaken. A panel consisting of 18 microsatellite nuclear DNA loci was used for the construction of a genetic baseline for sea trout from river systems flowing into the Irish and Celtic Seas. Sampling design involved the collection of over 5,000 juvenile fish, from putative sea trout spawning areas in 99 riverine locations. This comprehensive sampling programme of Irish, Manx, Scottish, English and Welsh rivers was designed to include the majority of the larger rivers contributing sea trout to the Irish and Celtic Seas. Genomic DNA extracted from these specimens was genotyped and analysed, to examine patterns of population structure, and produce a genetic baseline for assignment of marine-caught individuals (post smolts and adults) of unknown origin. A highly genetically-distinct trout group from SW Ireland was included as an outlier. STRUCTURE analysis of riverine genetic data revealed complex patterns of population structuring, which was best explained by nine major genetically-distinct regional groups within the Irish and British database. A self-assignment exercise, based upon identified populations, using the ONCOR algorithm, demonstrated the applicability of the database for assignment, particularly at the regional level. Assignment to regional reporting groups, rather than specific populations, was then utilised for marine-caught samples. Marine sampling, mainly in the Irish Sea, secured over 1,000 adult sea trout for individual assignment analysis, using the programme ONCOR. Marine-captured fish were used for spatial distribution mapping purposes when they could be scored for 14 or more loci, and were assignable to one of the nine regional groupings, with assignment probability scores equal or greater than 0.7. Results indicate that sea trout in the Irish Sea originate from a large number of rivers throughout the sampling area, and constitute substantially mixed marine aggregations. Individual assignment suggests that most inferred movement is region specific, the majority of fish being captured in the proximity of their natal rivers. However, there was strong evidence for long range migrations, with some fish traversing the Irish Sea or moving between the Irish and Celtic Seas.
Keywords: Celtic Sea; genetic stock identification; individual assignment;Irish sea; life history; marine
distribution; microsatellite loci; sea trout.
________________________________________________
INTRODUCTION
The anadromous sea trout (Salmo trutta L.) in the Irish Sea and adjacent areas, represents an important resource in terms of its social, economic and biodiversity value to local communities. The sustainability of these fisheries is currently susceptible to a range of anthropogenic pressures from estuarine barriers to migration and coastal renewable energy development to climate change. In recent years, increasing concerns about the status of sea trout has focussed attention on the need for comprehensive and sustainable research, with emphasis on its marine phase, where the species is particularly exposed to a number of threats and pressures. At all stages in their life cycle, individuals belonging to each distinct sea trout population are thought to vary in the route, distance and duration of their migrations, the timing of their return from sea, and in growth trajectories and maturation schedules, in response to local environmental conditions. As recently suggested by Hilborn et al. (2003) and Schindler et al. (2010) for anadromous Pacific salmonids, such diversity in life-history strategies plays a pivotal role in the long-term resilience and productivity of meta-populations and species in continuously shifting environments.
While a substantial body of literature is available on the phylogeography and genetic diversity of fresh water resident brown trout from Britain and Ireland (see review in McKeown et al., 2010), to date there has been relatively little work focusing on the population genetics of sea trout (but see reviews in Ferguson, (2006), Ferguson et al., (2017). More notably there are no genetic data from recent studies on sea trout populations that are native to the rivers flowing into the Irish or Celtic Seas. In order to have an understanding of the marine ecology of anadromous Salmo trutta L. in the Irish Sea and adjacent areas, it is essential to acquire stock specific information on their biology and distribution at sea. Reliable and robust identification, and characterization of population or regional population units is fundamental to ensuring informed management and long-term viability of exploited fish species. Sea trout in the Irish Sea and adjacent areas are unlikely to be a single homogenous group, but rather to consist of fish derived from many genetically different contributing populations (i.e. mixed stocks).
In contrast to many other vertebrates, a substantially larger proportion of the total genetic, phenotypic and life history variation observed in brown trout/sea trout (Salmo trutta) is distributed among populations and particularly among regional groupings of populations (Ferguson 1989, 2004). This makes the species ideal for GSI type studies.
Genetic stock identification (GSI) is acknowledged as a useful, reliable and cost effective method of acquiring data on intra-specific migration and geographic distribution patterns. GSI has been deployed successfully for the study of many salmonid species in marine and freshwater aggregations (see review by Manel et al., (2005) and, more specifically, recent publications by Bradbury (2015; 2016), Ensing et al. (2013), Griffiths et al. (2010), Gauthier-Ouellet et al. (2009) for Atlantic salmon (Salmo salar) and by Swatdipong et al. (2013) and Mäkenin (2015) for brown trout (S. trutta L.) in freshwaters. However, with very few exceptions to date, (Koljonen et al., 2014, King et al., 2016), the application of GSI in the study of anadromous sea trout has been comparatively limited.
Among the major advantages of genetic methods over conventional physical tagging for mixed stock analyses are:
1) The ability to identify all fish sampled and not just those that have been physically tagged previously.
2) No physical marking is involved and there is no bias due to additional mortality as a consequence of handling or the presence of an external tag.
3) There is no reliance on hatchery tagged fish as surrogates of wild populations.
GSI and its more recent development, individual assignment (IA), involves setting up a genetic baseline, using assumed-neutral molecular markers, from as many populations as possible of those thought to contribute to a mixed stock aggregation. A sample is then taken from a mixed aggregation and screened for the same molecular markers. Using one of the available statistical methods e.g. ONCOR (Kalinowski et al., 2007); cBAYES (Neaves et al., 2005); GENECLASS (Piry et al., 2004); STRUCTURE (Pritchard et al. 2000), the mixture is divided into proportions of each contributing
population or regional population grouping (in traditional GSI approaches) or assigned individually (in IA exercises). Previous work with fish of known origin (Hauser et al., 2006) and simulation studies (Paetkau et al., 2004; Anderson et al., 2008) have demonstrated the exceptional accuracy of these methods. However, this is provided that natal philopatry predominates in the target species, that the baseline is comprehensive and that there are statistically-significant genetic differences between the populations or groups of populations comprising the baseline. In the latter respect, the larger the genetic differences among populations or larger groupings, the more accurate the assignments. The level of genetic differentiation will invariably be a function of geographical proximity, population size and the interplay of genetic drift and levels of gene flow between populations from the same or different rivers (Ensing et al., 2011). The level of inherent population genetic differentiation is also relevant for the assessment of the quality of the baseline. Thus, confident and reliable individual assignment is enhanced if contributing baseline populations or regional groups of populations are sufficiently differentiated from each other.
As part of the Celtic Sea Trout Project (see introduction and other chapters of this book), the main objectives of the present study were:
1) To identify the natal freshwater population or regional population grouping of putative sea trout juveniles from as many riverine locations as possible around the Irish and Celtic Seas. 2) To describe the distribution and the likely migration patterns of sea trout primarily in the Irish Sea, during their marine phase.
MATERIALS AND METHODS
SAMPLING APPROACH
Freshwater sampling for the genetic baseline
Based on local Fisheries Officers’ knowledge and published information on the distribution of juvenile sea trout in large river catchments (Harris and Milner, 2004), freshwater sampling was prioritised in areas where sea trout were known to spawn, and likely spawning areas where specific information was lacking, within rivers entering the Irish and Celtic Seas. Sampling effort was primarily focused on larger, productive sea trout systems, which would likely be the largest contributors to sea trout marine stocks. Putative outlier samples were obtained from a geographically-distinct SW Irish catchment (Figure 1). The aim was to collect up to 50 of each of two co-occurring cohorts of juveniles at each location, i.e. 0+ fry from the previous winter’s spawning and 1+ parr from the spawning of the previous year. 0+ fry were killed humanely and the whole body or part of the body stored in 99% molecular grade ethanol. A tail fin clip was recovered from previously anaesthetised larger 1+ parr, preserved in 99% molecular grade ethanol and the fish returned alive to the river. (SI Table 1). See highlighted text on P.5.
Sampling of anadromous individuals of unknown origin in sea water
In order to secure a biologically meaningful sample set, sampling of anadromous individuals in sea water accounted for the extent of the coastline around the Irish Sea and the east of the Celtic Sea, which exceeds 6,500 km, and includes both inshore and offshore habitats. To further maximise sampling success, priority was given to areas where sea trout: 1) had previously been encountered by anglers or during previous sampling programmes; 2) had been taken on rod and line; 3) areas adjacent to existing trap and/or net fisheries; and 4) within zones where experienced commercial net fishers operated and were willing to assist with the collection of samples for the project. For inshore sampling, standardised survey benthic multi-mesh gill nets, based on standard gill net design were used. These nets are capable of capturing sea trout representing different size/age classes ranging from post-smolts (>18cm) up to
larger multiple spawners. Efforts were made to sample regularly throughout the year, to ensure representation of different life stages (pre-adult and adult) and to account for potential temporal distribution patterns. Offshore sampling was carried out using a modified mid-water trawl in a series of tows between 2011 and 2012. Biopsy tissue samples were removed from captured sea trout and stored into 99% molecular-grade ethanol for subsequent genetic analysis.
LABORATORY ANALYSIS
Genomic DNA was extracted from tissue samples using either the Promega Wizard 96 kit, following manufactures instructions or a plate-wise optimised hi-salt extraction method (Aljanabi and Martinez, 1997). No differences were observed in the quality or downstream analysis of resulting DNA from the two methods.
The 18 microsatellite loci used in this study (Table 1) were chosen from the 38 loci characterised and optimised by Keenan et al. (2013a) for Salmo trutta genetic research. The criteria applied by Keenan et al. (2013a) in their selection of loci included; 1) reliability of amplification, 2) consistency of automated allelic calls, 3) sufficient polymorphism (≥2 alleles) and 4) allele size range (amenable to multiplexing). The 18 loci were resolved in two unique multiplex groups on either a 96 capillary ABI3730XL analyser (samples from Ireland) or an ABI3130 DNA analyser (samples from Britain) with genotypes scored using either GeneMapper (ThermoFisher Scientific) or Genemarker (SoftGenetics) software. Careful calibrations involving the screening of a common set of samples on both systems ensured consistency of genotypic typing and, therefore, inter-calibration between instruments. Polymerase chain reaction (PCR) and cycling conditions follow those described by Keenan et al. (2013a), with minor modifications (details available from authors upon request).
STATISTICAL ANALYSIS
Production of Population Baseline
Following genotyping, all individual juvenile trout which could be unambiguously scored for at least 14 of the 18 microsatellite loci were considered for inclusion in the genetic baseline. To ensure an unbiased sample for the construction of the fresh water baseline, prior to further analysis each population sample was checked for the presence of individuals with family ties (i.e. full sibs). This was done by systematically checking each of the riverine samples using the Sibling-Group Partitioning Programme (Almudevar & Field, 1999). In samples where family over-representation was identified, the effect (i.e. bias) was minimised by consecutively removing individuals from the largest families. In instances where the resulting number of individuals within a sample fell below 30, the sample was excluded from further analysis.
Intra-population sample statistics (i.e. number of alleles per locus, allelic richness (AR), observed and expected heterozygosity, conformity to HW expectations) were estimated using the programme
diveRsity (Keenan et al., 2013b). At those locations where samples were collected for 0+ fry and 1+
parr, heterogeneity of allele frequencies between temporal pairs of samples was investigated with Fishers Exact tests using the programme GENEPOP (Raymond & Rousset, 1995). Where no significant differences were observed, temporal samples were combined. Spatial samples were then compared using pairwise F-statistics (; Weir & Cockerham, 1984 and DJost; Jost, 2008) again using diveRsity.
Statistical significance of estimated values (i.e. evidence for population differentiation) was determined using bootstrapping (Keenan et al., 2013b).
To investigate levels of population genetic structuring within the data, the Bayesian framework developed by Pritchard et al. (2000) and implemented in the programme STRUCTURE V2.3 was used. This approach does not require a pre-defined hypothesis of population genetic structuring, instead,
given a potentially “mixed” sample, the algorithm attempts to identify the minimum number of genetic independent entities (i.e. Mendelian genetic populations) that best explain the data, assuming HWE within inferred clusters. In this study, STRUCTURE analyses were run using a hierarchical approach (Rosenberg et al., 2002). The rationale behind the hierarchical procedure is to identify major genetic groupings within the data (possibly related by phylogeographic history). At each level, the main identified groups were independently examined in subsequent STRUCTURE runs. One of the main advantages of the hierarchical approach is that it facilitates the disentangling of complex patterns of population sub-structuring (e.g. populations with different levels of genetic divergence).
For each hierarchical level, STRUCTURE analysis was carried out using the admixture model, with correlated allelic frequencies and identifying sample geographic location (Pritchard et al., 2000). The latter parameter was used to account for population samples characterised by shallow levels of genetic divergence. The length of burn-in period (100,000) and the number of MCMC repetitions after burn-in (100,000) were determined empirically, following initial trial runs seeking convergence (see STRUCTURE manual for details). In each case, K (number of populations) ranged from 1 to 10 and, for each value of K, 20 iterations were carried out to ensure data concordance and reliability of results. The programme CLUMPP v 1.1.2 (Jakobsson & Rosenberg, 2007) was used to consolidate membership coefficients for the 20 iterations for each K estimate. Given the large data set, the “greedy” algorithm within CLUMPP was used, with 1,000 repeats. The most likely number of clusters present in the dataset was inferred using the Evanno method (Evanno et al., 2005). The within- and among-STRUCTURE defined groups of populations (i.e. regions) and DJost values were calculated using diverRsity (Keenan
et al., 2013b).
Individual Assignment
a. Self-Assignment: The quality and power of the STRUCTURE-defined baseline for Individual
Assignment was assessed with the leave-one out test (i.e. self-assignment test) using the programme ONCOR (Kalinowski et al., 2007). The test involves genotypes from each fish of known provenance being serially removed from the baseline and then reassigned against the reconstituted baseline.
b. Marine Assignment: Assignments of marine samples (unknown origin) to the genetic baseline were
also carried out using ONCOR. Sea-caught fish with an assignment P value of equal to or more than 0.7 were considered to be robust assignments. While this P value threshold is somewhat arbitrary, it was elected to be used as a conservative measure, after examining the results of actual marine assignments. Thus, assignment was found to be more consistent to region of origin above this value, whereas lower P values led to more diffuse assignments adjacent to other regions (data available on request). It is important however, to emphasise that the analyses, taking into consideration all assignments (irrespective of P value threshold), were not found to be substantially distinct (only more diffuse).
RESULTS
A total of 5,314 individual juvenile trout, collected from 99 spatially-distributed riverine sites (see Figure 1, SI Table 1) were genotyped. While in most cases a single location was sampled from each river, for larger rivers more than one site was sampled (details on request). A proportion of these river samples consisted of both 0+ and 1+ juveniles from the same locations. After the removal of individuals with less than 14 interpretable loci (out of 18) or siblings from samples biased by excess of full kin individuals, (see Materials and Methods) 4,944 individual juvenile trout (93%) remained for subsequent analysis. Only one river population sample was dismissed on the basis of small sample size following removal of excess full kin individuals.
Within individual samples, the number of loci found to deviate from HWE following Bonferroni correction ranged from 1 to 4 (avg. 1.1). In most instances, there were no obvious geographic or locus-specific patterns for deviations from HWE, thus, these most likely these reflected random genetic sampling error. A higher number of incidences, however, were observed for Cocl-Lav-4, MHCI and
Ssa410UOS loci, which were found to be out of HWE for 23%, 18% and 14% of the samples
respectively. In all cases, this was due to heterozygote deficiency. To test for possible bias, resulting from the three loci that show higher than average incidences of departures from HWE among samples, the STRUCTURE analysis was repeated after removing these particular loci. No major differences were observed when comparing the results including or excluding these loci. [Complete sample summary
statistics available on request from contact author.]
Pair-wise heterogeneity tests for allele frequency distributions among temporal samples indicated no significant differences. Hence, the relevant temporal samples were pooled prior to subsequent analysis. F-statistics analysis (both and DJost estimates) indicate that all pair-wise spatial sample
comparisons, while varying in the degree of genetic divergence, were statistically-significantly different from each other (data not shown).
DETERMINATION OF REGIONAL (POPULATION) GROUPINGS
Results of the hierarchical STRUCTURE analyses can be summarised as follows:
At the first hierarchical level (Level 0), sea trout from rivers entering the Irish and Celtic Sea were divided into three major groups: 1) West of Ireland (Currane tributaries); 2) south and east coasts of Ireland and 3) Britain, including the Isle of Man (Figure 2). In addition to the West of Ireland cluster, which was isolated on the basis of its demonstrated discreteness, Level 1 of STRUCTURE involved the separate analysis of the Irish and British samples (Figure 3). The Irish samples were clustered into four groups; Ireland-South, Ireland-Southeast, Ireland-Northeast and Ireland-North. The British samples were best explained by four groups: the Isle of Man, Britain-Solway/Morecambe, Britain-West Wales and Britain-South Wales. These clusters are mostly in concordance with their geographical locations (Figure 4). No major further structuring was apparent with additional analyses.
The results of the hierarchical STRUCTURE analyses provide good evidence for the presence of nine major regional groupings that follow a clear geographical pattern in rivers entering the Irish and Celtic Seas (Figure 4). These nine groups (1. Ireland-West, 2. Ireland-South, 3. Ireland-South East, 4. Ireland-North East, 5. Ireland-North, 6. Isle of Man, 7. Britain-Solway/Morecambe; 8. Britain-West Wales, 9. Britain-South Wales) were subsequently assessed for self-assignment (i.e. to examine the quality of the baseline) and actual assignment analyses (see below for rationale for using regional population groupings, rather than individual riverine populations for assignment).
F-statistics analyses based on the STRUCTURE-defined populations indicated substantial levels of
genetic sub-structuring among the population baseline surveyed. Weir & Cockerham (1984) FST
estimator () was found to be 0.026 (95% C.I. 0.025 – 0.027). The equivalent adjusted statistic, accounting for the high level of alleles observed at microsatellites (i.e. DJOST) was 0.111 (95% C.I. 0.108
– 0.115). Pair-wise Ɵ and DJost values between the nine major groupings are shown in Table 2 All
pair-wise comparisons were found to be significant.
TESTING OF BASELINE QUALITY USING SELF-ASSIGNMENT
The results of the assessment of the “quality” (or power) of assignment to inferred population and regional reporting group (i.e. genetic baseline), tested with the self-assignment leave-one-out procedure, are summarized in Table 3 for both populations and regions and in Figure 5 for regions only. Correct
self-assignments are substantially higher to the nine-major regional population groups (illustrated by “grey” highlighted values in the diagonal on the right side of Table 3), in comparison to correct self-assignment to populations within regions (illustrated by “grey” highlighted average estimates in column “Avg% Assignment”, Table 3). These results are not entirely unexpected, and reflect the fact that regional reporting groups (by default consisting of several population baseline rivers) capture a significantly larger diversity of alleles associated with particular regions in comparison, to any single population baseline riverine sample within a regional group. Thus, an individual trout with a rare allele/genotype unique to a riverine site might fail to be assigned back to its home river (i.e. because population sample size is not sufficiently large to capture more than one copy of these rare genetic variants). Such a fish will, however, most likely assign to the correct home region (i.e. where the rare genetic variants are more likely to be found given larger sample size involved). Since, from a fishery management perspective, the main objective is the identification of mutually exclusive groups of populations (i.e. management units) rather than individual populations per se (Scribner et al., 1998; Winans et al., 2004), all subsequent assignments are reported to region only.
The accuracy of self-assignment to each of the nine STRUCTURE-defined regions ranged from 0.99 in the case of the Ireland-West region to 0.70 in the case of Britain-South Wales. While high accuracy for assignment (>0.9) was observed in Ireland-North East (0.98), Ireland-North (0.91) and Isle of Man (0.93), slightly lower accuracies (<0.9) were noted for Ireland-South (0.86), Ireland-South East (0.81), Britain-Solway/Morecambe (0.84) and Britain-West Wales (0.76). It is important to note that where mis-assignments occur, they are usually restricted to geographically adjacent regions (i.e. confirming the earlier assertion and emphasizing the relevance of considering broader regional groups for management). In a minority of cases, however, there were mis-assignments across the Irish Sea and particularly from Irish regions to Solway/Morecambe and vice versa. The latter may represent a historical phylogeographic signal, but additional work would be required to test this hypothesis.
MARINE ASSIGNMENT
Sampling in the marine environment was challenging due to the extent of the British and Irish coastline within the project area, the logistics and cost of marine sampling, the overreliance on in-kind sampling effort, and, in some cases, restrictions imposed under the terms of sampling permits. The majority of the marine samples were from inshore locations largely within the Irish Sea. A total of 1,367
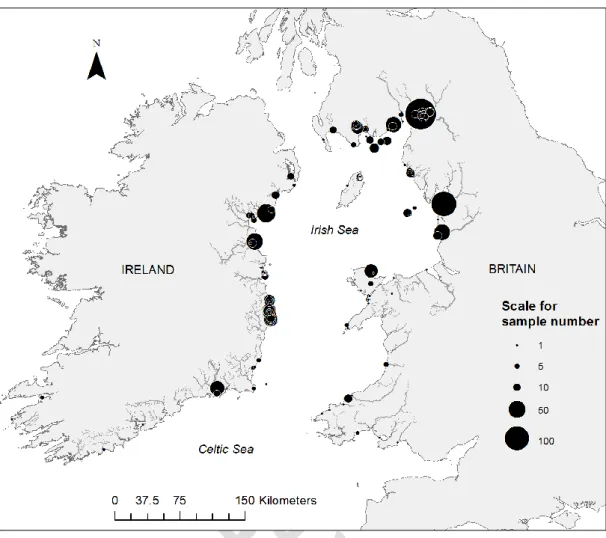
S. trutta from across the project area were sampled in the sea (Figure 6). Sample sizes in different
locations were very variable and related to uneven regional sampling effort and opportunistic sampling. Thus, they should not be regarded as representative of local natural abundance. The largest number of sea trout were captured from the coastal areas adjacent to the Britain-Solway/Morecambe reporting region, followed by the area adjacent to Ireland-Southeast. Genomic DNA was successfully extracted from biopsy tissue from 1,213 individuals. Multi-locus genotypes (≥ 14 loci) were obtained for 1,041 individuals. Of these, 569 (54.6%) were assigned to reporting regions with a P value ≥0.7.
A summary of the assignment of individuals captured largely in the Irish Sea (inshore and offshore areas) adjacent to the nine identified reporting regions with probability of assignment (P) values equal or greater than 0.7, is provided in Table 4 and, in all but the Ireland-West region, in Figure 7. Notwithstanding sampling bias, where both effort and successful captures varied greatly, interesting trends can be noted from the assignment analyses.
While sea trout from a variety of regions are represented in each recapture area, proportions vary greatly (discernible by examining the individual columns in Table 4B). Excluding the Ireland-North East region where there were only two marine recaptures, the next lowest recovery in adjacent waters was in the case of Britain-West Wales at 13%, whereas 82% of trout from Isle of Man rivers were caught locally (Table 4 B). Probably because of variation in effort and subsequent catch, the largest contributing regional group to the sea trout in the Irish Sea and adjacent areas of the Celtic Sea are from the rivers constituting the Solway/Morecambe Bay complex. The next largest represented group are
represented by rivers in the Ireland-North region, and then the Ireland-South East region. In contrast, there were no fish assigned to the west coast of Ireland, as represented by the Lough Currane sample.
DISCUSSION
Prior to the Celtic Sea Trout Project (http://celticseatrout.com/), very little was known of the biology, distribution and migratory behaviour of sea trout in the Irish Sea and adjacent Celtic Sea. The Irish Sea in particular, is a relatively contained and discrete geographical entity, which for migrant trout, may mimic an extensive freshwater lake as opposed to the oceanic expanses of the Atlantic. Our results, however, show that some sea trout from rivers entering the Irish Sea did not confine themselves to the region during marine migrations. For the first time, molecular markers have provided an opportunity to describe the population and regional structure of sea trout from rivers entering the Irish and Celtic seas. Using these results as a genetic reference, individual sea trout sampled during their marine migrations can be assigned, with a very high degree of confidence, back to their natal region (i.e. reporting groups). Thus, the results from the CSTP project provides new insights into the biology of the sea trout in the Irish Sea and adjacent areas of the eastern Celtic Sea, which, when combined with other data, will considerably advance the knowledge of the ecology of the species in the region. Furthermore, not only is this information of key relevance for management and conservation of sea trout in the area, but it also provides guidelines for future studies. As such, one of the recommendations is for a future series of papers, combining, for example, genetics and observations of life history, age and growth data, stomach contents, parasites, geology, microchemistry and other aspects of sea trout biology.
However, the main aim of this chapter was to identify aspects of the biology of anadromous S.
trutta that are relevant to management. Major findings in this context include:
1) The majority of sea-caught sea trout assigned to each region were caught locally. Therefore, conservation efforts in the sea should be intensified close to the mouths of the rivers within a particular region;
2) A smaller proportion of fish make long distance migrations e.g. British to Irish coasts or Irish Sea to Celtic Sea or vice versa. If these trout are predominantly larger and older individuals, it would be important that sustainable management be extended over the entire sea area. This question could be tested in a subsequent study;
3) The proportion of local, relative to long distance migrant fish varied among regions. For example, individual sea trout putatively spawned in Ireland-North and Isle of Man were mostly caught locally, while the Ireland-South sample contained many long distance migrants (spawned in other regions) (Figure 7). This suggests that different conservation strategies need to be enforced in different regions;
4) There is some evidence (combined distribution data; Ireland-North) of a tendency for fish to move in a northerly direction. Whether this apparent movement is in response to better feeding opportunities or other underlying reasons needs to be explored;
5) Any proposed marine development (e.g. associated with marine renewables, aquaculture, fisheries) are likely to affect sea trout from rivers entering the sea within a particular region, but also from other regions. Therefore, all sea based activities will have an effect on multiple stocks, particularly in the Irish Sea (The Celtic sea was far more poorly sampled).
One of the potential weaknesses identified in this study was related to sampling design and its influence on the quality of the baseline. Two immediate options exist in sampling design to assemble the required baseline for sea trout; one can either utilise juvenile trout or adults returning to fresh water. One problem with the former approach is that sampling of undifferentiated juveniles can also include the progeny of resident (non-anadromous) trout in the baseline. These fish make no contribution to fish in the sea and, hence, are likely to affect the quality of the baseline and subsequent interpretation of the population structure of sea trout in the region, if resident trout represent distinct populations. This issue is potentially more problematic in large river catchments, where multiple distinct populations are
probable and juveniles along a river transect may represent mixtures from genetically distinct populations (Dillane et al., 2008; Ferguson et al., 2017). Despite this caveat, for logistic reasons, this was the strategy (i.e. sampling of juveniles) adopted in the present study. The second option, using adult fish to construct baselines, can lead to different problems, as adult trout have been shown to occur in non-natal rivers, and then move back to their natal rivers to spawn (Chat et al., 2017). The extent of such behaviour has not been fully quantified but was regarded as sufficiently important so as to preclude the use of this approach in the present study. It might be more accurate to establish genetic baselines using smolts and or post spawned kelts, however, sampling either stage is not without associated complications, which, as discussed below, are primarily logistical in nature.
The extensive spatial sampling programme of trout from Irish, Manx and British rivers undertaken in this study, was designed to capture all of the major contributing sea trout rivers in the Irish and Celtic Seas (but see below). Assuming that each river should support at least one genetically distinct population, approximately one third of the estimated number of populations contributing sea trout to the Irish Sea and to the eastern Celtic Sea, were sampled, though these probably represent the larger populations. Thus, an analysis was undertaken to determine regional structuring of populations, on the assumption that populations within a defined region might be substantially more similar within regions than amongst such groups. Given the available resources, it was decided to try to achieve maximum spatial coverage at the expense of testing for temporal stability of the database. In this respect, the current study resembled, and was based on, the nature of genetic structuring in previous (Bourret et al., 2013) and on-going studies (J. Gilbey, Freshwater Laboratory, Pitlochry, UK, pers. comm.) on Atlantic salmon Salmo salar, rather than the often longer term studies that have been undertaken on Pacific salmon and trout species-genus Oncorhynchus (see review by Koljonen et al., 2007. . and references therein).
Freshwater juvenile sampling methods were designed based on life history and adequate sample size, but also while avoiding overrepresentation of small numbers of families (family effects). Also, at some locations, it was only possible to collect sufficient fry/parr from the most recent or previous spawning event, or 1+ parr, further limiting a more comprehensive assessment of the temporal stability of the genetic structure identified in this study. Notwithstanding these caveats, sea trout in the Irish and Celtic Seas have proven to be highly suitable for the application of GSI, satisfying the three criteria outlined in the introduction. This work has produced genetically-based evidence confirming philopatry in the form of significant FST differences between nearly all spatial samples. Evidence of the
comprehensiveness of the freshwater database has also been produced, at least to the regional level. The evidence for a phylogeographic legacy (i.e. historical colonization patterns) of the populations comprising the baseline is interesting. As suggested from the results of the self-assignment analyses, there is some evidence for close genetic relationships between the sea trout from the British west coast, and south and south east Irish rivers. While this still needs to be confirmed, this similarity may be due to close geographic proximity over long periods, and to shared colonisation history, rather than contemporary gene flow. A future study of colonisation processes which are likely to have influenced currently observed relationships among regional groups and populations, would be of great interest. However, it is also plausible that small numbers of anomalies in the baseline are a consequence of contemporary straying.
The observation that the majority of sea trout in certain regions are distributed and feed locally in the Irish Sea was not unexpected (Fahy, 1985; Harris & Milner, 2004). This trend would influence the biology of the fish from diverse regions differently, since, for example, feeding opportunities would be likely to vary, so influencing marine growth. The types and location of coastal based activities e.g. aquaculture, marine renewables, shipping and recreation that may affect sea trout of the inshore habitat should also be taken into consideration.
A key advantage of genetic “tagging” over traditional tagging methods is that a far greater number of fish can be sampled. Even applying stringent criteria (probability of assignment (P) equal to or greater than 0.7) more than half the trout captured at sea could be confidently assigned (in this case, 569 fish). It is, however, important to remember (as noted in the introduction) that genetically-based assignments are not absolutes as would be obtained from physical tagging, but rather are based on statistical outputs
derived within a probabilistic framework, as are many techniques used in fisheries management and, indeed, in forensic sciences. While creating minor limitations, the advantages of acquiring data for large numbers of wild fish from many rivers far outweighs any disadvantages. Furthermore, it is important to emphasise that absolute certainty in assignment is not necessary to obtain useful insights into biological phenomena such as life history variation, or migration distribution, or to produce information that may be pertinent to management e.g. the occurrence of mixed stock aggregations.
The adopted strategy in the present study of concentrating assignment to reporting regions is well justified from a management perspective, where the main goal is to identify mutually exclusive management units (i.e. groups that need to be managed separately). Furthermore, despite the considerable sampling effort undertaken, it is unlikely that all sea trout populations within the designated area were sampled. Thus, based on prior information, samples were preferentially obtained from larger rivers, which were assumed to harbour larger sea trout populations, which would, in turn, be more likely to contribute to marine catches. Thus, small rivers and some multiple populations within large rivers may have been missed. A future study should attempt to achieve a fully comprehensive baseline, and thus achieve greatly improved efficiency in assignment to individual rivers.
The current study concentrated on sea trout from rivers flowing into the Irish Sea from the east Irish coast, the Isle of Man and central west Britain, and to a lesser extent into the Celtic Sea from the south coast of Ireland. Future studies should also consider all areas of both islands in preparing a genetic baseline either by combining with on-going studies i.e. Living North Sea (http://www.living-north-sea.eu), AARC (http://aarcproject.org/), ASAP (https://projects.exeter.ac.uk/meeg/atlantic-salmon-arc-project-asap), or by de novo studies e.g. the west coast of Ireland and west coast of Scotland. In addition, consideration must be given to optimal sampling within a river (Ferguson et al., 2017). Sampling of undifferentiated juveniles from single locations, particularly in large river systems where considerable population genetic sub-structuring is likely to exist, risks undermining the baseline in respect to sea trout identification (Hecht et al., 2013; Martinez et al., 2011). The sampling of tributary-specific sea trout smolts might be one way of overcoming this issue. Even better might be the sampling of stream-specific sea trout kelts. In addition, the long-term temporal stability of the database will need testing, as it is the norm with Pacific species. Temporal sampling might also provide genetically derived management-relevant data on population sizes in particular tributaries and rivers i.e. numbers of breeders (Nb), effective population size (Ne) (Waples & Yokota, 2007; Waples et al., 2016).
The marine sampling described in the current work does not provide a comprehensive and spatially explicit assessment of migration and distribution of sea trout in the Irish Sea, and particularly the Celtic Sea, because of major bias in effort/catch/sampling effort. However, biologically relevant inferences can be drawn about movements, which could be considered in a future combined study of genetics and biological data. Future studies should ensure far more comparable marine effort and consequent catches. Furthermore, future studies might utilise Single Nucleotide Polymorphisms (SNPs) (Ackerman et
al., 2011) in addition to, or instead of microsatellites. For instance, Ackerman et al. (2011) have shown
that SNPs, under diversifying selection, provide increased accuracy and precision in mixed-stock analysis of sockeye salmon (Oncorhynchus nerka) from the Copper River in Alaska. While this approach would necessitate rescreening of both the database and marine samples, recent developments in genomics methodologies are now potentially permitting for rapid screening of thousands of SNP loci, and, as demonstrated by the Ackerman et al. (2011) study, the choice of neutral loci or adaptive loci for analysis.
In summary, we conclude that GSI is an excellent tool for use in elucidating the biology and assisting in the management of sea trout in the Irish Sea and adjacent areas. In this particular study, due to the constraints of sampling, assignment to STRUCTURE defined regions proved far more accurate than assignment to river. It was concluded that there is strong philopatry and at least short term temporal genetic stability in sea trout in the area. In addition, there would appear to be metapopulation-like structuring in certain areas (Quéméré et al., 2015). Studies of microchemistry might enable identification of the progeny of sea trout in mixed juvenile aggregations, thus simplifying baseline sampling (pers. comm. Ronald Campbell, River Tweed Foundation). In the present study, a threshold assignment P value of 0.7 was used, but it should be noted that this value may be region specific (i.e.
the more discrete the region, the lower the acceptable threshold value). Additional analysis taking other biological and/or ecological data into consideration would be useful in trying to validate the approach (see also: Potter et al., 2017; Milner et al., 2017).
The genetic database used in the current study is the largest and most comprehensive assembled for the study of anadromous Salmo trutta in a defined ecosystem. The genetic baseline is of sufficient quality to provide information on accurate regional genetic structuring. As has been discussed throughout, the baseline could be further improved by refining the spatial and temporal extent of baseline sampling. The argument is that related benefits of such approach easily justify costs. This is an issue, however, that will have to be considered those responsible for the management of sea trout in this area, and will have to take into consideration priorities and the consequences of failing to possess the relevant information. From both management and evolutionary perspectives, one aspect where refinement of the baseline might be justified is to increase the confidence of assign fish to individual regions and, ideally, to particular rivers.
ACKNOWLEDGEMENTS
This study was funded as part of the Ireland-Wales Territorial Co-operation Programme 2007-2013 (INTERREG 4A) – Celtic Sea Trout project. PP, TC, PMcG, CB, TR, ED, JC and JC were also supported by the Beaufort Marine Research Award in Fish Population Genetics funded by the Irish Government under the Sea Change Programme. Additional funding was provided by the River Annan District Salmon Fishery Board, the Nith District Salmon Fishery Board and the Galloway Fisheries Trust. The personnel at Inland Fisheries Ireland, Bangor University, the Environmental Agency, Natural Resources Wales, Dept. of Environment, Food and Agriculture, Isle of Man, Nith District Salmon Fisheries Board (NSFB), Galloway Fisheries Trust (GFT), River Annan District Salmon Fishery Board (ASFB) and Buccleuch Estate (Border Esk) are acknowledged for their considerable efforts in collecting marine samples.
REFERENCES
Ackerman, M. W., Habicht, C. & Seeb, L. W. (2011). Single-Nucleotide Polymorphisms (SNPs) under diversifying selection provide increased accuracy and precision in Mixed-Stock Analyses of sockeye salmon from the Copper River, Alaska. Transactions of the American Fisheries
Society 140, 865-881.
Aljanabi, S. M. & Martinez, I. (1997). Universal and rapid salt-extraction of high quality genomic DNA for PCR-based techniques. Nucleic Acids Research 25, 4692-4693.
Anderson, E. C., Waples, R. S. & Kalinowski, S. T. (2008). An improved method for predicting the accuracy of genetic stock identification. Canadian Journal of Fisheries and Aquatic Sciences 65, 1475-1486.
Almudevar, A. & Field, C. (1999). Estimation of single generation sibling relationships based on DNA markers. Journal of Agricultural Biological and Environmental Statistics 4, 136-165. Bourret, V., Kent, M.P., Hayes, B.J., Primmer, C.R., Vasemagi, A., Karlsson, S., Hindar, K.,
McGinnity, P., Verspoor, E., Bernatchez, L. & Lien, S. (2013). SNP-array reveals genome wide patterns associated with geographical and potential adaptive divergence across the natural range of Atlantic salmon (Salmo salar). Molecular Ecology 22, 532–551.
Bradbury, I. R., Hamilton, L.C., Chaput,G., Robertson, M.J., Goraguer, H., Walsh, A., Morris, V., Reddin, D., Dempson, B., Sheehan, T.F., King, T. & Bernatchez, L. (2016). Genetic mixed stock analysis of an interceptory Atlantic salmon fishery in the Northwest Atlantic. Fisheries
Research 174, 234-244.
Bradbury, I.R., Hamilton, L.C., Rafferty, S., Meerburg, D., Poole, R., Dempson, J.B., Robertson, M.J., Reddin, D.G., Bourret, V., Dionne, M., Chaput, G., Sheehan, T.F., King, T.L., Candy, J.R. & Bernatchez, L. (2015). Genetic evidence of local exploitation of Atlantic salmon in a
coastal subsistence fishery in the Northwest Atlantic. Canadian Journal of Fisheries and
Aquatic Sciences 72, 83–95.
Chat, J., Masson, S., Manicki, A., Gueraud, F., Rives, J., Lange, F., Huchet, E., Coste, P., Aymes, J-C. & Lepais, O. (2017). Do sea trout migrations promote inter-basin connectivity between
populations? In: Sea trout: Science & Management. (Graeme Harris. (Ed.) . Proceeding of the 2nd International Sea Trout Conference. October 2015, Dundalk, Ireland. Insert publisher & pps
Dillane, E., McGinnity, P., Coughlan, J.P., Cross, M.C., De Eyto, E., Kenchington, E., Prodöhl, P & Cross, T.F. (2008). Demographics and landscape features determine intrariver population structure in Atlantic salmon (Salmo salar L.): the case of the River Moy in Ireland. Molecular
Ecology 17, 4786-4800.
Ensing, D., Crozier, W.W., Boylan, P., Ó Maoiléidigh , N. & McGinnity, P. (2013). An analysis of genetic stock identification on a small geographical scale using microsatellite markers, and its application in the management of a mixed-stock fishery for Atlantic salmon (Salmo salar ) in Ireland. Journal of Fish Biology 82, 2080–2094.
Ensing, D., Prodöhl, P. A., McGinnity, P., Boylan, P., Ó Maoiléidigh, N. & Crozier, W.W. (2011). Complex pattern of genetic structuring in the Atlantic salmon (Salmo salar L.) of the River Foyle system in north-west Ireland: disentangling the evolutionary signal from population stochasticity. Ecology and Evolution 1, 359-372.
Evanno, G., Regnaut, S. & Goudet, J. (2005). Detecting the number of clusters of individuals using the software STRUCTURE: a simulation study. Molecular Ecology 14, 2611–2620.
Fahy, E. (1985). The Child of the Tides. The Glendale Press, Dublin, 188 pp.
Ferguson, A. (1989). Genetic differences among brown trout, Salmo trutta, stocks and their importance for the conservation and management of the species. Freshwater Biology 21, 35– 46.
Ferguson, A. (2004). The importance of identifying conservation units: brown trout and pollen biodiversity in Ireland. Biology & Environment: Proceedings of the Royal Irish Academy 104B (3), 33-41.
Ferguson, A. (2006). Genetics of sea trout, with particular reference to Britain and Ireland. In: Sea
Trout: Biology, Conservation & management. (Graeme Harris & Nigel Milner. (Eds.).
Proceedings of the First International Sea Trout Symposium, Cardiff, July 2004. Oxford: Blackwell Scientific Publications. 157-182
Ferguson. A., Reed, T., McGinnity, P. & Prodöhl, P. (2017). Anadromy in brown trout (Salmo trutta): A review of the relative roles of genes and environmental factors and the implications for management. In: Sea Trout: Science & Management. (Graeme Harris. Ed.). Proceedings of the 2nd International Sea Trout Symposium, October 2015, Dundalk, Ireland. (insert publisher &
pps).
Gauthier-Ouellet, M., Dionne, M., Caron, F., King, T.L. & Bernatchez, L. (2009). Spatiotemporal dynamics of the Atlantic salmon (Salmo salar) Greenland fishery inferred from mixed-stock analysis. Canadian Journal of Fisheries and Aquatic Sciences 66 (12), 2040–2051.
Griffiths, A.M., Machado-Schiaffino, G., Dillane, E., Coughlan, J., Horreo, J.L., Bowkett, A.E., Minting, P., Toms, S., Roche, W., Gargan, P., McGinnity, P., Cross, T., Bright, D., Garcia-Vazquez, E. & Stevens, R. (2010). Genetic stock identification of Atlantic salmon (Salmo
salar) populations in the southern part of the European range. BMC Genetics 11, 31.
doi:10.1186/1471-2156-11-31.
Harris, G. & Milner, N.J. (2006). Sea Trout: Biology, Conservation and Management. In Proceedings
of the First International Sea Trout Symposium, Cardiff, pp. 76-87. Oxford: Blackwell
Scientific Publications. These pages refer top a paper by Ian Davidson – is this what you meant to cite?
Hauser, L., Seamons T.R., Dauer, M., Naish, K.A. & Quinn, T.P. (2006). An empirical verification of population assignment methods by marking and parentage data: Hatchery and wild steelhead (Oncorhynchus mykiss) in Forks Creek, Washington, USA. Molecular Ecology 15, 3157–3173. Hecht, B. C., Campbell, N. R., Holecek, D. E. & Narum, S. R. (2013). Genome-wide association
reveals genetic basis for the propensity to migrate in wild populations of rainbow and steelhead trout. Molecular Ecology 22, 3061–3076.
Hilborn, R., Quinn, T. P., Schindler, D. A. & Rogers, L.A. (2003). Biocomplexity and fisheries sustainability. Proceedings of the National Academy of Sciences of the United States of America 100, 6564-6568.
Jakobsson, M. & Rosenberg, N.A. (2007) CLUMPP: a cluster matching and permutation program for dealing with label switching and multimodality in analysis of population structure.
Bioinformatics 23: 1801–1806.
Jost, L. (2008). Gst and it relatives do not measure differentiation. Molecular Ecology 17, 4015-4026. Kalinowski, S.T., Manlove, K.R., & Taper, M.L. (2007). ONCOR: software for genetic stock
identification. Montana State University, Bozeman, Montana, USA.
Keenan, K., Bradley, C. R., Magee, J. J., Hynes, R. A., Kennedy, R. J., Crozier, W. W., Poole, R., Cross, T. F., McGinnity, P. & Prodöhl, P. A. (2013a). Beaufort Trout MicroPlex: A high throughput multiplex platform comprising 38 informative microsatellite loci for use in brown trout and sea trout (Salmo trutta L.) population genetics studies. Journal of Fish Biology 82 (6), 1789-1804.
Keenan, K., McGinnity, P., Cross, T., Crozier, W.W. & Prodöhl, P. (2013b) diveRsity: An R package for the estimation and exploration of population genetics parameters and their associated errors.
Methods in Ecology and Evolution 4(8), 782-788.
King, A., Hillman, R., Elsmere, P., Stockley, B. & Stevens, J. (2016). Investigating patterns of straying and mixed stock exploitation of sea trout, Salmo trutta, in rivers sharing an estuary in south-west England. Fisheries Management and Ecology 23, 376–389.
Koljonen, M-L., King, T.L. & Nielsen, E.E. (2007). Genetic identification of individuals and
populations. In: The Genetics of Atlantic Salmon: Implications for Conservation. (Verspoor, E., Nielsen, J. & Stradmeyer, L., Eds.). Oxford. Blackwell Scientific Publications. 270-298
Koljonen, M.-L., Gross, R. & Koskiniemi, J. (2014). Wild Estonian and Russian sea trout (Salmo
trutta) in Finnish coastal sea trout catches: results of genetic mixed stock analysis. Hereditas
151, 177-195.
McKeown, N., Hynes, R., Duguid, R. A., Ferguson, A. & Prodöhl, P. (2010). Phylogeographic structure of brown trout (Salmo trutta) in Britain and Ireland: glacial refugia, post-glacial colonisation, and origins of sympatric populations. Journal of Fish Biology 76, 319-347. Mäkinen, H., Niva, T., Koljonen, M-L. & Primmer, C.R. (2015).Temporal variation in lake-run brown
trout (Salmo trutta) mixed-stock fishery catches in a large Fennoscandian lake. Boreal
Environment Research 20(5), 651–665.
Martínez, A., Garza, J.C. & Pearse, D.E. (2011). A microsatellite genome screen identifies
chromosomal regions under differential selection in steelhead and rainbow trout. Transactions
of the American Fisheries Society 140, 829-842.
Manel, S., Gaggiotti, O.E. & Waples, R.S. (2005). Assignment methods: matching biological questions with appropriate techniques. Trends in Ecology & Evolution 20, 136–42.
Milner, N., Potter, E., Roche, W., Tysklind. N., Davidson, I., King, J., Coyne, J. & Davies, C. (2017). Variation in sea trout (Salmo trutta) abundance and life histories in the Irish Sea. In: Sea Trout: Management & Science. (Graeme Harris,. Ed.). Proceedings of the 2nd International Sea Trout
Symposium. October 2015, Dundalk, Ireland. (insert publisher & pps).
Paetkau, D., Slade, R., Burden, M. & Estoup, A. (2004). Genetic assignment methods for the direct, real-time estimation of migration rate: a simulation-based exploration of accuracy and power DAVID. Molecular Ecology 13, 55–65.
Piry, S., Alapetite, A., Cornuet, J. M., Paetkau, D., Baudouin, L. & Estoup, A. (2004).
GENECLASS2: A software for genetic assignment and first-generation migrant detection.
Journal of Heredity 95, 536-539.
Potter, E.C.E, Campbell, R., Sumner, K. & Marshall, S. (2017). Marine migrations and distribution of sea trout from rivers in Great Britain. In: Sea trout: Science & Management. (Graeme Harris.
Ed.). Proceeding of the 2nd International Sea Trout Conference, October 2015, Dundalk,
Ireland. (+ publisher/ pp)
Pritchard, J., Stephens, M. & Donnelly. P. (2000). Inference of population structure using multilocus genotype data. Genetics 155, 945-959.
Quéméré, E. Baglinière, J-L., Roussel, J.M., Evanno, G., McGinnity, P. & Launey, S. (2015). Seascape and its effect on migratory life-history strategy influences gene flow among coastal
brown trout populations (Salmo trutta) in the English Channel. Journal of Biogeography 43, 498–509.
Raymond, M. & Rousset, F. (1995). GenePop (version 1.2) - population genetics software for exact tests and ecumenicism. Journal of Heredity 86, 248–249.
Rosenberg N. A., Pritchard, J. K., Weber, J. L., Cann, H. M., Kidd, K. K., Zhivotovsky, L. A. & Feldman, M. W. (2002). Genetic structure of human populations. Science 298, 2381–2385. Schindler, D. E., Hilborn, R., Chasco, B., Boatright, P., Quinn, T. P., Rodgers, L. A. & Webster, M. S.
(2010). Population diversity and the portfolio effect in an exploited species. Nature 465, 609-613.
Scribner, K. T., Crane, P. A., Spearman, W. J. & Seeb L. W. (1998). DNA and allozyme markers provide concordant estimates of population differentiation: analyses of US and Canadian populations of Yukon River fall-run chum salmon (Oncorhynchus keta). Canadian Journal of
Fisheries and Aquatic Sciences 55, 1748–1758.
Swatdipong, A., Vasemägi, A., Niva, T., Koljonen, M.-L. & Primmer, C.R. (2013). Genetic mixed-stock analysis of lake-run brown trout Salmo trutta fishery catches in the Inari Basin, northern Finland: implications for conservation and management. Journal of Fish Biology 83, 598–617. Waples, R. S. & Yokota, M. (2007). Temporal estimates of effective population size in species with
overlapping generations. Genetics 175, 219–233.
Waples, R. K., Larson, W. A. & Waples, R. S. (2016). Estimating contemporary effective population size in non-model species using linkage disequilibrium across thousands of loci. Heredity 117, 233–240.
Weir, B.S. & Cockerham, C.C. (1984). Estimating F-statistics for the analysis of population structure.
Evolution 38, 1358–1370.
Winans, G, A., Paquin, M. M., Van Doornik, D. M., Baker, B. M., Thornton, P., Rawding, D., Marshall, A., Moran, P. & Kalinowski, S. (2004). Genetic stock identification of steelhead in the Columbia River Basin: an evaluation of different molecular markers. North American
Journal of Fisheries Management 24, 672–685.
ELECTRONIC REFERENCES
Neaves, P.I., Wallace, C.G., Candy, J.R. & Beacham, T.D. (2005). CBayes: computer program for mixed stock analysis of allelic data [online]. Available from: http://www.pac.dfo- mpo.gc.ca/ science/facilities-installations/pbs-sbp/mgllgm/ apps/index-eng.html.
Figure 2. Level 0 hierarchical structuring of putative anadromous S. trutta from the Irish and Celtic Seas, as derived from sampling of juveniles in riverine locations. Different colours on pies represent genetic membership (proportion) to particular major regional groups as follows: ‘grey’ –Ireland-west; ‘white’ –Ireland-south and east and ‘black’ - Britain
Figure 3. Summary bar plots of hierarchical STRUCTURE analysis including Level 0; Level 1, Level
2 and Level 3. At Level 0, samples are best explained by three main genetic clusters (1. Ireland-West,
2. Ireland South and East, and 3- Isle of Man & mainland Britain). At Level 1, Ireland divides into three additional subgroups (1. Ireland-South & South East, 2. Ireland-North East and 3. Ireland-North) and Britain separates from Isle of Man. At Level 2, both Ireland South & South East and Britain can be further subdivided independently. Finally, at Level 3, Wales can be further split into two genetically distinct subgroups. Note that subsequent to Level 0 the different shades of grey and black have independent meanings in Britain and Ireland, and do not imply relationships between the two areas.
Figure 5. Self-assignment to STRUCTURE defined regions, including percentage mis-assignments to other regions. In each case, results represent a summary of average sample correct self-assignments specific to the particular region. Note: ‘I’ = Ireland, ‘B’ = Britain, ‘0.00’ < 0.001.
Figure 6. Location of all anadromous S. trutta captured in the Irish and Celtic Seas. Size of pies are proportional to number of fish captured in a given location.
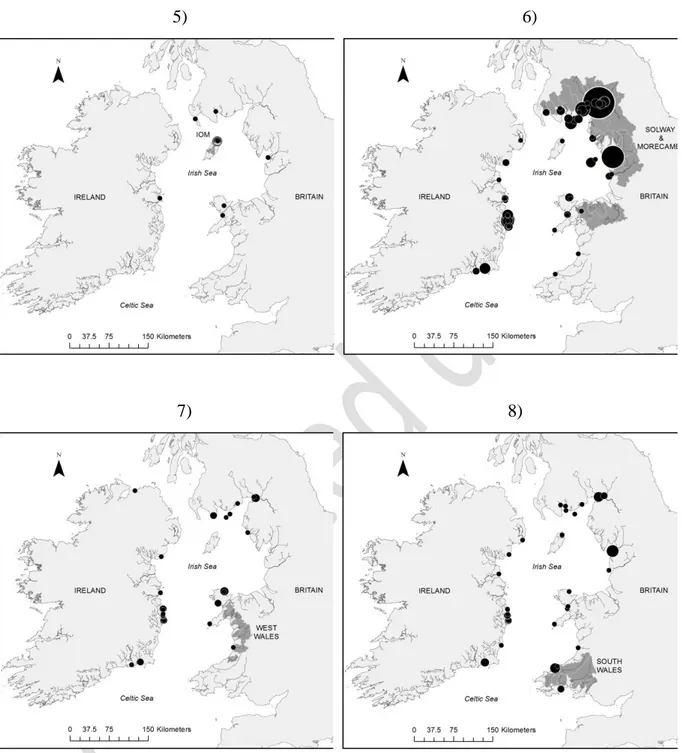
Figure 7. Sea trout marine assignment to particular reporting region (considering only those fish with an assignment value (P) of equal to or greater than 0.7) as follows: 1) Ireland-South; 2) Ireland-Southeast; 3) Ireland-Northeast; 4) Ireland-North. Ireland- West is not shown (i.e. no marine fish assigned to the region). Pie size (marine samples) reflects number of fish captured in a given location.
1)
2)
5)
6)
7)
8)
Figure 7 - Continuation. Sea trout marine assignment to particular reporting region (considering only those fish with an assignment value (P) of equal to- or greater than 0.7) as follows: 5) Isle of Man; 6) Britain-Solway/Morecombe; 7) Britain-West Wales; 8) Britain-South Wales.
Table 1. Marker information for the multiplex panels used in this study, including primer sequences (with ABI labelled primer). Loci names Prefixed with ‘m’ have been modified in this study from their original sources, for use in S. trutta (see Keenan et al., 2013a for additional details regarding maker panels (e.g. annealing temperatures, allele size range). All unlabelled primers are ‘pig tailed’ (i.e. prefixed with “gttt”).
Locus Forward Primer Reverse Primer Sea Trout-Panel - 1
Ssa85 NED-AGGTGGGTCCTCCAAGCTAC gtttACCCGCTCCTCACTTAATC
mOne102a & b‡ NED-GGGATTATTCTTACTTTGGCTGTT gtttCCTGGTTGGGAATCACTGC
CA054565 PET-TCTGTGGTTCCCGATCTTTC gtttCAACATTTGCCTAGCCCAGA
CA053293 PET-TCTCATGGTGAGCAACAAACA gtttACTCTGGGGCATTCATTCAG
Str2QUB PET-CTGGGGTCCACAGCCTATAA gtttGAGCTACAACCTGATCCACCA
Ssa416UoS FAM-TGACCAACAACAAACGCACAT gtttCCCACCCATTAACACAACTAT
mOne101 FAM-TGCTAAATGACTGAAATGTTGAGA gtttGAGAATGAATGGCTGAATGGA
Cocl-Lav-4 VIC-TGGTGTAATGGCTTTTCCTG gtttGGGAGCAACATTGGACTCTC
Oneμ9 VIC-CTCTCTTTGGCTCGGGGAATGTT gtttGCATGTTCTGACAGCCTACAGCT
CA048828 VIC-GAGGGCTTCCCATACAACAA gtttGTTTAAGCGGTGAGTTGACGAGAG
Sea Trout-Panel - 2
SsaD71 NED-AACGTGAAACATAAATCGATGG gtTTAAGAATGGGTTGCCTATGAG
Sasa-TAP2A gtttGTCCTGATGTTGGCTCCCAGG NED-GCGGGACACCGTCAGGGCAGT
MHC-I PET-AGGAAGGTGCTGAAGAGGAAC gtttCAATTACCACAAGCCCGCTC
Ssa410UoS gtttGGAAAATAATCAATGCTGCTGGTT PET-CTACAATCTGGACTATCTTCTTCA
Str3QUB FAM-CTGACCGCTGCACACTAA gtttGGCTCTAATCGACTGGCAGA
CA060177 FAM-CGCTTCCTGGACAAAAATTA gtttGAGCACACCCATTCTCA
Table 2. Estimates of (below diagonal) and DJost (above diagonal) for pair-wise regional group comparisons.
Regional Groups
Ireland (Ir) Isle
of Man
Britain (Br)
West South SE NE N Solw /
More South Wales West Wales Ir-West - 0.145 0.157 0.178 0.182 0.192 0.170 0.175 0.215 Ir-South 0.058 - 0.024 0.066 0.049 0.084 0.037 0.051 0.063 Ir-South East 0.066 0.009 - 0.065 0.058 0.067 0.025 0.030 0.047 Ir-North East 0.075 0.023 0.024 - 0.069 0.146 0.088 0.105 0.113 Ir-North 0.071 0.018 0.019 0.025 - 0.116 0.056 0.081 0.072 Isle of Man 0.077 0.034 0.030 0.055 0.043 - 0.087 0.090 0.091 Br-Solw/More 0.064 0.012 0.008 0.031 0.018 0.034 - 0.024 0.033 Br-West Wales 0.063 0.017 0.011 0.036 0.026 0.032 0.008 - 0.032 Br-South Wales 0.081 0.023 0.016 0.046 0.027 0.038 0.012 0.012 -
Table 3. Summary results, expressed as percentages, of correct self-assignment (ONCOR) to riverine population sample within regional reporting region (grey vertical columns on the left side of the vertical line in the Table); average correct self-assignment among populations within region in addition to minimum and maximum estimates in each case), and for correct self-assignment to reporting regions (grey highlighted values in the diagonal in the right-hand side of the vertical line in the Table).
. Regional Groups No . Po p u latio n s am p les W ith in reg io n * Av g % Ass ig n m en t * Min % Ass ig n m en t * Ma x % Ass ig n m en t Ir elan d W est Ir elan d So u th Ir elan d So u th E ast Ir elan d No rth E ast Ir elan d No rth Is le o f Ma n B ritain – So lway / M o rec am b e B ritain – W est W ales B ritain – So u th W ales Ireland - West 8 0.042 78.1 67.4 91.7 99.17 0.11 - - - - Ireland - South 18 0.044 69.6 40.0 91.3 0.55 86.48 6.09 0.74 2.94 - 3.14 0.66 3.50 Ireland - South East 14 0.028 56.8 37.0 94.7 - 5.39 80.76 0.49 2.15 0.74 2.81 3.99 5.10 Ireland - North East 7 0.057 87.7 73.2 100 - 0.91 0.61 98.03 1.37 - 0.22 - - Ireland - North 9 0.062 77.7 54.3 100 - 2.95 2.19 0.74 90.61 - 1.08 1.00 0.32
Isle of Man 3 0.027 78.1 72.2 87.5 - 0.20 0.61 - - 93.33 0.22 0.66 0.64
Britain - Solw/More 24 0.04 62.3 27.3 83.8 0.28 2.85 6.09 - 2.74 2.96 83.68 12.96 12.42 Britain - West Wales 8 0.047 65.5 32.4 95.5 - 0.41 1.46 - 0.20 2.22 4.22 75.75 8.28 Britain - South Wales 7 0.019 46.5 28.6 68.9 - 0.81 2.19 - - 0.74 4.54 4.98 69.75