HAL Id: insu-00402756
https://hal-insu.archives-ouvertes.fr/insu-00402756
Submitted on 13 Feb 2019HAL is a multi-disciplinary open access archive for the deposit and dissemination of sci-entific research documents, whether they are pub-lished or not. The documents may come from teaching and research institutions in France or abroad, or from public or private research centers.
L’archive ouverte pluridisciplinaire HAL, est destinée au dépôt et à la diffusion de documents scientifiques de niveau recherche, publiés ou non, émanant des établissements d’enseignement et de recherche français ou étrangers, des laboratoires publics ou privés.
Microspectroscopy: Application and Perspectives in
Materials Science
Sylvain Bohic, Alexandre Simionovici, Xavier Biquard, G. Martinez-Criado,
Jean Susini
To cite this version:
Sylvain Bohic, Alexandre Simionovici, Xavier Biquard, G. Martinez-Criado, Jean Susini. Synchrotron X-Ray Microfluorescence and Microspectroscopy: Application and Perspectives in Materials Science. Oil & Gas Science and Technology - Revue d’IFP Energies nouvelles, Institut Français du Pétrole, 2005, 60 (6), pp.979-993. �10.2516/ogst:2005069�. �insu-00402756�
Synchrotron X-ray Microfluorescence
and Microspectroscopy:
Application and Perspectives in Materials Science
S. Bohic
1, A. Simionovici
1, 2, X. Biquard
3, G. Martinez-Criado
1and J. Susini
11 European Synchrotron Radiation Facility (ESRF), 6, rue Jules Horowitz - BP 220 - 38000 Grenoble - France 2 Laboratoire de Sciences de la Terre, ENS, 46, allée d'Italie, 69007 Lyon - France
3 CEA - DRFMC/SP2M/NRS, 17, rue des Martyrs 38054 Grenoble - France e-mail: [email protected] - [email protected] - [email protected] - [email protected] - [email protected]
Résumé — Microfluorescence et microspectroscopie X par rayonnement synchrotron : applica-tions et perspectives en sciences des matériaux — Les récents développements technologiques concer-nant les sources synchrotron, les éléments d’insertion et l’optique X permettent d’obtenir des faisceaux de photons fortement polarisés et d’extrême intensité, focalisés sur une zone microscopique. Différent arran-gements expérimentaux permettent d’obtenir un faisceau micrométrique dans le domaine des rayons X durs avec suffisamment de flux pour réaliser des cartographies d’éléments à l’état de traces. Il est aisé d’y associer des études de micro-diffraction et de microspectroscopie d’absorption X sur une même zone d’intérêt de l’échantillon. Ces possibilités analytiques, la sensibilité et la rapidité des mesures effectuées peuvent compléter ou surpasser celles des techniques de microanalyses actuellement disponibles. Ce type de microsonde devient un outil particulièrement intéressant notamment dans le domaine de la caractérisa-tion des matériaux.
Abstract — Synchrotron X-ray Microfluorescence and Microspectroscopy: Application and Perspectives in Materials Science — Recent developments in synchrotron storage ring technology, inser-tion device design and X-ray optics provide polarized photon beams with unprecedented intensity and brilliance on a microscopic area. Various arrangements allow micrometer size hard X-ray beams with enough flux to undertake elemental mapping of trace elements then easily associated with micro-diffrac-tion or micro-extended X-ray absorpmicro-diffrac-tion fine structure studies on the very same sample region of interest. These analytical possibilities and the sensitivity and accuracy of the achieved analysis can complement or surpass other available instrumental micro-analytical methods. Such microprobes are becoming a very interesting tool for material characterization.
Trace Analysis in the Petroleum Industry / Analyse de traces dans l’industrie pétrolière
IFP International Workshop Rencontres scientifiques de l’IFP
INTRODUCTION
The development of high-brilliance, high-energy X-ray sources coupled with advances in manufacturing technologies of focusing optics permitted considerable advancement in sub-micrometer probes for spectroscopy, diffraction and 2D/3D imaging applications in the multi-keV “hard” X-ray range. The experience gained in the soft X-ray regime (below 1 keV) and the development of new techniques allow “hard” X-ray micro-scopes to provide a complementary analytical tool that can contribute to a wide range of existing and new applications of X-ray microscopy. Among the 40 beamlines in operation at the European Synchrotron Radiation Facility, three beamlines are fully dedicated to X-ray microscopy and micro-spectroscopy techniques in the multi-keV range. ID21, ID22 and ID18F are multiprobe beamlines enabling the coupling of a unique range of non-destructive analytical techniques (Table 1) that aim to satisfy the growing demand from experimental research fields such as medicine, geology, archaeology, earth, planetary, envi-ronmental and material sciences.
The main fields of applications are driven by the unique attributes of X-ray microscopy in the multi-keV energy range:
– access to K absorption edges and fluorescence emission lines of medium-light elements and L,M-edges of heavy metals for micro-spectroscopy (e.g.µ-XANES, µ-EXAFS) and chemical or trace element imaging for concentrations below ppm;
– higher penetration depths compared to soft X-rays, allow-ing imagallow-ing of thicker samples;
– favorable wavelengths for diffraction studies;
– generally large focal lengths and depths of focus that are advantageous for the use of specific sample environments (high pressure cell, furnace, cryomicroscopy, stress/strain testing, etc.).
A large number of experiments require a complete analysis of the same sample by screening light and heavy ele-ments. Furthermore, the need for combined morphological and chemical information is a clear trend, which is pushing
TABLE 1
Main characteristics of the X-ray micro-spectroscopy and micro-imaging end-stations at the ESRF
ID21 ID22 ID18F
Source Low beta High beta High beta Undulators Linear U42 (42, 38, 2.1) Linear U42 (42, 38, 2.1) Linear U32 (42, 50, 1.9) (period, pole, Kmax) Linear W80 (80, 20, 5.9) In-vacuum U23 (23, 86, 1.45) Linear U32 (42, 50, 1.9)
Helical H52 (52, 59, 1.5) Linear U32 (42, 50, 1.9) Energy range (keV) 2-8 7-60 6-29 Monocromator Si 111 and Si 220 Si 111 and Si 311 Si 111 Harmonics rejection 2-bounce mirror 1 mirror –
horizontally deflecting horizontally deflecting
Imaging modes Scanning 2D Scanning 2D/3D Scanning 2D/3D Full-field 2D Full-field 2D/3D Full-field 2D/3D Contrast modes Fluorescence Fluorescence Fluorescence
Absorption Absorption Absorption
Phase Phase Phase
µ-sprectroscopy XANES XANES-EXAFS –
µ-diffraction – SAXS/WAXS SAXS/WAXS Detection modes Fluorescence Fluorescence Fluorescence
Transmission Transmission Transmission Focusing optics Fresnel zone-plates Kirkpatrick Baez mirrors (KB) Refractive lenses
Refractive lenses (CRL) Fresnel zone-plates (FZP)
µ-probe size 0.2 ×0.2 µm2(scanning) 1 × 3 µm2 (KB) 1.5 ×12 µm2
(vert. ×horiz.) 0.05 ×0.05 µm2(full-field*) 1.5 ×12 µm2(CRL)
1.5 ×12 µm2(FZP)
Flux (ph/s/Si111bw) 109 1011 (KB) 1010
109-1010(CRL)
109-1010 (FZP)
our strategy toward a coupled access to full-field sub-micron imaging and microprobe-based spectroscopy. The three beamlines share a common concept in combining several detection modes and imaging techniques (fluorescence, absorption, phase, 2D and 3D). Recently an infrared microscopy endstation was installed to complement micro-probe analysis and thus extend the range of information at the microscale.
The description of these x-ray methods is beyond the scope of this manuscript and can be found elsewhere concerning X-ray fluorescence [1-3] and X-ray absorption spectroscopy [4].
1 ESRF-ID21 X-RAY MICROSCOPY BEAMLINE
ID21 is a beamline dedicated to X-ray imaging and spectro-microscopy [5]. It is installed on a low-beta straight section, which is equipped with three different undulators and provides beam for two independent end-stations on two separate branch-lines: the scanning X-ray Microscope (SXM) served by the “direct” branch-line is equipped with a fixed-exit silicon crystal monochromator operating in the 2–8 keV energy range, and the full-field imaging transmission X-ray microscope (TXM) is served by the side-branch and opti-mized for imaging techniques at 4 keV. Both microscopes use zone-plates as focusing lenses. The beamline covers several disciplines over a broad energy range. Therefore vari-ous types of zone plates are currently needed for each kind of application:
– Fluorescence or diffraction applications in the multi-keV energy range require large diameter and medium-resolu-tion (thus long focal length) zone-plates, offering high flux and a better access to the sample;
– Full-field X-ray microscopy necessitates high-resolution zone-plates, to be used as objective lenses and large diam-eter zone-plates for condensers. Several collaborations were therefore initiated with different laboratories with particular emphasis upon high efficiency zone-plates for the 2–8 keV range on one hand [6, 7] and high resolution zone plates for the Ca K-edge region (~4 keV) on the other. The high spatial resolution focusing, combined with spectroscopic methods in the multi-keV range, has been demonstrated in a number of experiments from diverse fields. Sulfur [8-10], Calcium [11], Vanadium [12], Chromium [13], and Iron [14] K-edges are the most requested edges/lines. The reduction of air absorption by using the scanning microscope in secondary vacuum is a clear asset for energies below 4 keV. Indeed, the capabil-ity of performing micro-XANES for sulfur speciation with a spatial resolution of about 0.1 µm is a unique feature. Multi-keV X-ray microscopy often suffers from a lack of absorption, resulting in low contrast images. Furthermore, the
use of absorption contrast can subject the specimen to high radiation doses leading to possible structural changes. Due to the relative magnitudes of the real (phase-shifting) and imag-inary (absorption) parts of the refractive index for materials, the use of phase contrast techniques can often lead to a tremendous reduction of the X-ray dose applied to the speci-men [15]. Three original strategies are currently employed on ID21: differential phase contrast (DPC) using configured detectors on the SXM proposed by G. Morrison et al. [16], differential interferential contrast (DIC) with a configured zone plate on both SXM and TXM [17, 18], and finally, Zernike X-ray microscopy, which has been successfully developed on the TXM. As proposed by Zernike for visible light microscopy, phase contrast images are obtained in a full-field microscope by inserting a phase plate in the back focal plane of the objective [19].
1.1 Visualization of Oriented Mesostructures in Clay Gels
The aim of this experiment carried out on ID21 beamline was the in situ characterization of the porous structure of aqueous clay gels [20]. Indeed, X-ray microscopy allows investigating much larger scales than those probed by scattering tech-niques. Regarding the importance of clay-based systems in industry (thickeners, drilling fluids, paints, etc.) and in the environment (soil stability, geocycling, etc.), understanding the phase behavior in such systems represents obviously a major issue for colloid science. One of the open questions in clay suspensions is related to the presence of long-range order in the gel phase and to its relationship with the gel microstructure. Static light scattering [21], ultrasmall- and small-angle X-ray scattering [21, 22] and small-angle neutron scattering measurements [23] on laponite and montmoril-lonite gels revealed the presence of density fluctuations on distance scales reaching 1 µm, that is, the lowest q-range reachable using such techniques. New insights on clay gels could therefore certainly be obtained by carrying out experi-ments that allow a direct visualization of gels. Some prelimi-nary attempts using solvent-exchange methods or fast-freez-ing techniques [24] have been performed, but the images obtained can never be considered as truly artifact-free. In that context, X-ray microscopy appears a promising technique, since it enables the investigation of hydrated samples without any pretreatment. The potential of this technique has been illustrated by recent measurements on suspensions of soil aggregates using soft X-rays of energies around 500 eV in absorption contrast [25, 26]. This requires very thin samples (typically < 1 µm), which is inappropriate for studying gels, as the presence of wall effects in such setups can never be safely written out.
In the present work, the X-ray beam was focused down to 0.5 ×0.5 µm2by mean of a Fresnel zone plate. A fixed-exit
The fluorescence signal was analyzed using a high-energy resolution germanium solid-state detector. The beam energy was fixed at 2.5 keV to ensure an optimized fluorescence yield for silicon. The investigated depth was estimated to be around 50 µm. The sample investigated was a Wyoming montmorillonite provided by the Clay Minerals Society (Sample Swy-2). Prior to use, the clay was purified and sodium saturated by washing and centrifugation. The final suspension was air-dried. The powder was then redispersed at a concentration of 50 g.L-1(2%volume) in bidistilled water
under high shear to obtain a gel with a yield stress around 300 Pa. A vacuum-tight cell with two Kapton windows 12.5 µm thick was loaded with a few milligrams of Montmorillonite gels.
High quality images of Si (the main component of clay minerals) distribution in montmorillonite clay gels could be obtained (Figs 1a and 1b). The most striking feature in Figure 1 is the presence of long-range orientational order (200 µm) with aligned domains richer in silicon (3-8 µm wide) alternating with Si-poor zones (5-30 µm wide) corre-sponding to water domains. Some water pockets with a non-lamellar morphology can be observed in zones where differ-ent clay-rich lamellae end. The silicon-rich objects are at least two orders of magnitude larger than the size of the ele-mentary clay layers, which are polydisperse between 0.1 and 0.8 µm. These images were the first direct experimental evi-dence for the existence of a superstructure in gels. Such superstructure accounts for the long-range order revealed by optical birefringence measurements.
Figure1b corresponds to Si distribution in another montmorillonite gel with the same concentration, using identical acquisition parameters as the previous image. It
reveals similar oriented domains of silicon-rich lamellae alternating with water domains. However, in this case, orien-tational defects can clearly be observed. Two main types of defects can be distinguished:
– bundles of lamellae secant to other bundles with an angle of around 110° (arrows 1 and 2);
– kink-folded structures affecting silicon-rich lamellae (arrows 3 and 4) that are typical of sheared structures observed in sedimentary and metamorphic rocks.
The X-ray microscopy study of montmorillonite gels unambiguously reveals the existence of large-scale struc-tures, much larger than individual clay platelets. At the same time, it raises numerous questions about the fundamental physical mechanisms underlying the formation of such enti-ties. Using the present set-up, much information can be extracted by fully exploring the phase diagram concentra-tion/ionic strength for a given clay sample and by investigat-ing the influence of particle morphology (size and anisotropy) and polydispersity on the existence and forma-tion of superstructures in both natural and synthetic (laponite) clay samples.
1.2 Evolution of the Cr Oxidation State in Portland Cement During Leaching Experiments
The main topic of this study was to assess Cr behavior during cement alteration in water [27]. Cement phases (Si, Ca-Al, Ca-Al-Fe hydrates) having high affinity for heavy metals (HM) has encouraged the industry to use hazardous waste as fuel for cement kilns. This co-firing technique is interesting in an environmental point of view, since the quantity of
a) b)
Figure 1
a) X-ray microfluorescence mapping of silicon in a montmorillonite (Swy-2) clay gel at 50 g/l (resolution: 1 µm, dwell time: 400 ms); b) X-ray microfluorescence mapping of silicon in a montmorillonite (Swy-2) clay gel at 50 g/l (resolution: 1 µm, dwell time: 400 ms). The arrows show the various types of orientational defects. (Modified and Reprinted with permission of Bihannic I. [20]).
hazardous waste is reduced and heavy metals are trapped in cement. Standard leaching tests performed on cements manu-factured with hazardous waste have revealed low levels of released metals; however, the total metal release was depen-dent on the cement and the secondary hydrate phase compo-sition. To asses, the environmental risks linked to the use of these materials, it is essential to study the effect of water on the physico-chemical stability of these metals in the hydrated materials. The case of Cr is of particular interest since this element can reach concentrations up to 100 ppm and occurs in 2 oxidation states: Cr(III) and Cr(VI). The latter is known to be more toxic [28] and mobile [29, 30] than Cr(III). According to literature, less Cr(III) is released during alter-ation experiments, compared to Cr(VI) [31].
The main difficulty in the investigation of trace amounts of Cr during the leaching of Portland cements lay in the detection of trace amounts of Cr released from the solid phase and in distinguishing modifications of Cr fixation sites between sound and leached zones. The determination of the Cr concentration profile with adequate spatial resolution is important since leached cements exhibit a complex zonal structure between the core and the surface. Techniques that enable us to determine Cr concentration profiles at a trace level and at micron scale are not numerous. Only the Synchrotron-based technique of X-ray absorption near-edge structure (XANES) spectroscopy offers a direct determina-tion of formal valence and speciadetermina-tion of a metal. This can be simultaneously coupled to the Synchrotron X-ray fluores-cence microprobe (SXRF) that permits nondestructive, two-dimensional mapping of a wide variety of trace elements (below ppm level) under realistic environmental conditions (i.e., at atmospheric pressure).
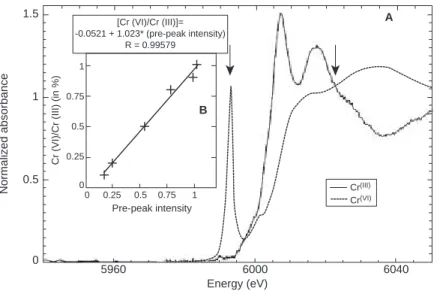
The experiments were conducted using the Scanning X-ray Microscope operated in fluorescence mode. The fluo-rescent line of Cr and Ca were simultaneously acquired with an energy dispersive spectrometer associated to a multichan-nel analyzer. The intensity of the beam was checked with the Ca-Kαfluorescent line intensity. The beam spot was focused down to 2 ×4 µm using a Fresnel Zone Plate lens. The evo-lution of Cr in the material was assessed by scanning across the sample, from the altered layer towards the core (between 1.5 and 2.5 mm length). The main difficulty of this study was the very low concentration of Cr in the cement used (60 ppm). We thus compared natural and 1500 ppm doped samples after dynamic leaching, at pH = 5, 40°C and during 40 days. After 40 days a degraded layer of approximately 0.5 mm depth was observed. Transverse scans and fluores-cence 2D maps were performed at two energies: 5.998 and 6.022 keV characteristic of the presence of Cr(VI) (pre-edge) and total Cr respectively. This procedure allowed us to obtain 2D chemical maps at the micro scale. XANES spectra were collected at different points of interests. Ratio of the two spectra lines depicts Cr(VI) distribution. The energy calibra-tions were performed using pure Na2CrO4 and Cr2O3 for
Cr(VI) and Cr(III), respectively (Fig. 2).
Figure 3 illustrates for one line scan (Fig. 3c) Cr(tot), Cr(VI) (Fig. 3b), and Cr(VI)/Cr(tot) profiles (Fig. 3a) and six XANES spectra scanned at different points approaching to the sound zone (zone IV). Semiquantitative chemical analysis of the different points of interests (Fig. 3d) was used to control and validate the Cr(VI)/Cr(tot) obtained from the line scans.
X-ray spectromicroscopy has been successfully applied to determine the evolution of the Cr oxidation state in Portland cement during leaching experiments. This constitutes the first
0.25 0.25 0 0.5 0.75 1 0 0.5 0.75 Pre-peak intensity Cr(III) [Cr (VI)/Cr (III)]= -0.0521 + 1.023* (pre-peak intensity) R = 0.99579 Cr(VI) Energy (eV) 5960 0 0.5 1 1.5 6000 A B 6040
Cr (VI)/Cr (III) (in %)
Normalized absorbance 1
Figure 2
a) XANES spectra of pure Cr(VI) and Cr(III) reference compounds; b) Cr(VI)/Cr(tot) ratio calibration curve as a function of the pre-peak intensity. Arrows indicate the position of the energy for which line scans were performed. (Reprinted with permission of Rose J. [27]).
study that demonstrates the possibility to study the chromium oxido-reduction phenomena in cement materials at natural Cr concentration (60 ppm) and at the micron scale. Line scans of Cr for Cr(VI) doped (2000 ppm) and undoped samples indi-cate that the altered layer (0-1000 µm from the surface) is characterized by a lower amount of Cr as compared to the core part, whereas an accumulation appears in the intermediate region (1000-1300 µm). This Cr-rich interface could corre-spond to an accumulation of ettringite (3CaO‚ Al2O3‚
3CaSO4‚ 32H2O) as reported by previous works. This
mineral exhibits the property to incorporate Cr(III) and Cr(VI) by replacement of aluminum and sulfate, respectively, in the structure. The most surprising result concerns the evo-lution of the Cr(VI)/Cr(tot) ratio along the line spectra, which is constant from the altered layer to the core (both for doped and undoped samples). This means that the same amounts of Cr(VI) and Cr(tot) are released during leaching. Even for the undoped sample, Cr(VI) was detected in the altered layer at Surface Surface POIs POIs Sound core Sound core B
C
A #1 #1 #2#2 #3#3 #4#4 #5#5 400 400 µm #6 #6D
B
A
0.2 0.6 0 400 POI #2 POI #1 POI #4 I (Cr (tot))/I (Ca) I (Cr (VI))/I (Ca) POI #6 POI #3 POI #2 1 1 0.5 E (eV) 5990 6000 6010 5990 6000 6010 5990 6000 6010 E (eV) E (eV) 0.2 0 0.6 0.2 POI #3 POI #5POI #1 POI #4 POI #6
POI #5 800 1200 Distance (µm) Cr (VI)/Cr (tot) Normalized absorbance Normalized absorbance 1600 2000 Figure 3 (A-D)
Comparison for one line scan of the Cr(VI)/Cr(tot) values obtained from the line scan (A) with the XANES spectra scanned at six different POIs (D); (B) Cr(VI) and Cr(tot) profiles; (C) Photomicrograph indicating locations of the line scan and POIs. (Reprinted with permission of Rose J. [27]).
40 µm from the surface. This result is not in perfect agree-ment with literature, which usually states that Cr(VI) is mainly leached out. Although this result must be confirmed, it clearly indicates that Cr(VI) may be less mobile than pre-dicted by models.
2 ESRF-ID22 & ID18F HIGH ENERGY X-RAY MULTI-TECHNIQUE MICROPROBE BEAMLINE
ID22 is a high-energy multi-technique X-ray microprobe beamline served by 2 undulators (see Table 1). The double crystal monochromator, equipped with both Si [111] and Si [311] crystals, offers a wide energy range (6-70 keV) for opti-mal excitation conditions of a broad range of elements. Efficient covering of this spectral range requires several focus-ing devices—e.g. Kirkpatrick-Baez (KB) mirrors (E < 20 keV) and refractive lenses (E > 12 keV). The X-ray source can be typically demagnified to a V*H: 1.5*(3-10) µm2 spot with
1010-5.1011ph/s intensity in the E < 30 keV energy region.
The sample stage and associated detectors are similar to those of ID18F. Several routinely available micro-analytical techniques, such as micro X-ray fluorescence analysis (µ-XRF), micro X-ray absorption spectrometry (µ-XAS), micro-diffraction (µ-XRD) and absorption/phase contrast imaging and tomography, provide the possibility of complex analysis of the sample. The multi-technique capability of ID22 attracts a wide variety of research fields: non-destructive investigation of the spatial distribution, concen-tration (µ-XRF) and speciation (µ-XANES) of trace elements in single cells or tissues can give useful information about normal or pathological or about the biological effects and mechanism of different high-Z labeled drugs [32].
In order to estimate the possible environmental impact of different pollutants (e.g. heavy metals) originating from micrometer-sized particles (e.g. radioactive fuel particles [33], fly ash [34]) the complex investigations of the elemen-tal composition, speciation, morphology and cryselemen-talline structure of the particles is needed. In geology, the composi-tion of ancient fluids provides crucial informacomposi-tion about fluid-rock interactions. The only direct samples of ancient fluids can be found in fluid inclusions. The small size of the usual inclusions (less than several tens of microns), the low concentration of the trace elements within the fluid and the uniqueness of the samples necessitate the use of a non-destructive, quantitative microanalytical investigation method [35, 36]. The non-destructivity of the method is a crucial requirement for the study of unique samples such as extraterrestrial grains from space collections [37] or samples of high archaeological value [38]. Materials science often demands (sub)micrometer-scale investigation of crystalline/ polycrystalline materials [39].
For example, development and research in the physics and electronics of semiconductors necessitates the investigation
of compound crystalline materials, such as GaAs/AlGaAs/ GaAs(001) multilayer structure [40]. The increasing interest and demand of several research fields also motivate the development of new methods at ID22, such as quantitative
µ-X-ray fluorescence tomography [41] or X-ray holography [42].
The ID18F end-station [43] is a dedicated microprobe instrument that benefits from extremely stable and high throughput beamline optics (slits, monochromator) of the ID18 nuclear resonance beamline. Three 32 mm-period undulators are installed on the ID18 high beta straight sec-tion, providing an exceptionally high brilliance. Originating as collaboration between the ESRF and the Micro and Trace Analysis Center (MITAC) of the University of Antwerp, (Belgium), the ID18F microprobe was designed to be a stable but evolutive instrument with prominence given to the ease of use, reliability and repeatability of the system. With an initial emphasis placed on X-ray fluorescence microprobe measurements, the instrument has evolved into a multi-technique station offering simultaneous focused-probe fluo-rescence and wide or small angle X-ray scattering measure-ments and the possibility for fluorescence tomography and absorption tomography acquisitions.
The microprobe is formed by direct imaging of the X-ray source with a distance from the source to focusing optics of approximately 58 m. Beam focusing is performed using Al compound refractive lenses (CRL) [44]. Focus spot sizes are typically in the range (~ 1.5(V) ×10 (H) µm2) with fluxes
greater than 1010ph/s. Sample positioning and scanning are
achieved using commercial stepper motor driven translation and rotation stages. An on-line visible light microscope facil-itates sample alignment and rapid correlation of the X-ray measurements with optically observable sample features. The incident X-ray beam is highly linearly polarized (> 99.5%), with electric field vector in the horizontal plane, to minimize background signals from elastic and inelastic scattering.
The microfluorescence signal is collected in the horizontal plane at 90° to the incident beam direction using a small area (30 mm2) Si(Li) solid state energy dispersive detector, which
is coupled to state-of-the-art digital pulse processing elec-tronics. A phosphor-coupled fiber-optic taper bonded CCD gives 16-bit dynamic range for simultaneous 2-D X-ray scat-tering measurements while a high-resolution X-ray camera can be used for beam and sample alignment and absorption radiography/tomography. During operation, users may rapidly and repeatably toggle between the unfocussed beam and microprobe mode, by a simple translation of the focusing lens. The incident flux on the sample is continuously moni-tored using a specially manufactured micro-ionization cham-ber positioned approximately 1 cm upstream of the sample. The chamber incorporates collimating apertures, which greatly reduce the levels of background scattering at the sample position leading to very low background intensities for SAXS and WAXS measurements.
The sample stage can accommodate a wide variety of sample geometries. Relative detection limits (DL) of ~ 0.1–0.01 ppm and absolute DL < 1 fg have been measured with the focused beam from complex reference materials for 1000s acquisition times for medium Z-elements (Z = 22–40).
2.1 Preliminary Micro-XAS Study
of the Reversible Phase Change Mechanism Used in Rewritable DVD
With its quick rewriting capabilities and large storage capacity, many industry analysts consider phase change as the most promising optical storage technology. The new formats (DVD + RW, DVD-RW and DVD-RAM) all depend on phase change (PC) recording technology, based on the fast and reversible phase transition of chalcogenide material between amorphous and crystalline states: to write a bit, the crystalline material is locally melted by a 50 ns laser pulse of appropriate intensity. Subsequent quenching into the amor-phous phase can be achieved by avoiding recrystallization due to an ultra-fast cooling (~ 1010K/s). To erase the data bit,
the amorphous area is heated for a sufficient long time by the same laser beam of lower intensity, so that recrystallization can take place. Typical lifetime of PC material is 1 million cycles. In collaboration with a French industrial partner (MPO), the LETI, CEA has already developed 2.6 GB and 4.7 GB DVD-RAM. Nowadays to further increase the capac-ity of rewriting optical disks, it is essential to understand precisely the physical process occurring while recording data on PC media.
The studied thin film (GeSbTe based alloy) is embedded in a complete structure of an optical disk: glass substrate (0.6mm)/Si3N4 (30 nm)/GeSbTe (20 nm)/Si3N4 (15 nm)/
doped Al (200 nm) with 1.5% of Ti. This optical disk is pre-recorded with crystalline spots in the amorphous zone and amorphous spot in the crystalline zone (Fig. 4).
The main objective of a preliminary experiment con-ducted on ID22 was a time resolved study of the reversible phase change mechanism used in rewritable DVD. Such an experiment is very challenging and cumulates many techni-cal difficulties, so we were able to address some experimen-tal challenges. First, we were able to achieve an in-situ posi-tioning of the X-ray beam on a chosen single crystalline DVD spot by taking advantage of the 1.1 eV energy shift of the maximum of the white line when going from amorphous state to crystalline state (Fig. 5). The fluorescence signal is particularly low since the probed layer is 20 nm thin, the X-ray spot is micrometric and the present experiment was per-formed using the lowest intensity mode, a single-bunch mode (ring current intensity I = 20 mA). Nevertheless, by optimiz-ing the detector position and takoptimiz-ing advantage of ID22 Kirkpatrick Baez focusing system, we were able to record in a reasonable amount of time a convenient XAS spectra at the Ge K-edge as is illustrated on Figure 6. Spectra recorded on
Figure 4
Enlarged DVD spots obtained with laser pulse (λ = 650 nm, 130 mW) of 3 µs (a), 1.5 µs (b) and 800 ns (c). White arrow: 0.5 µm DVD spot. Optical view of (d) crystalline memory point and (e) amorphous memory point. DVD spots numbered from 1 to 4 correspond to numbers in Figure 3.
Figure 5
A 1.1 eV energy shift of the maximum of the white line when going from amorphous state to crystalline state can be used for an in situ positioning of the X-ray beam on a chosen single crystalline DVD spot. Here we can follow a series of 11 identically spaced crystalline spots.
DVD spots are not identical to the ones that were recorded on the large crystalline zone, nor is the mean level of EXAFS oscillations (Fig. 7). And indeed, looking closer at Figure 4, the DVD spot white color is not uniform but exhibits a darker 2 µm core region and reveals that enlarged DVD spots are
7000 6800 6600 6400 6200 6000 5800 0 50 Position (µm)
Energy on crystalline white line maximum
Ge fluorescence intensity 100 4 3 2 1
1
2
3
4
a) c) d) e) b)not of a uniform crystalline phase but certainly present an amorphous center. In addition, recorded spectra of DVD spot 2 presents an anomalous drop around 11 300 eV. This drop could be understood by investigating the Ti-Kαfluorescence intensity of the 1.5% Ti located inside the aluminum layer. As the Ti fluorescence is more than 6 keV away from the Ge K-edge, its intensity as a function of energy is a monotonous and slow varying function as illustrated on the top part of Figure 8. But the most important, is that—for a yet unknown
reason—the Ti intensity is 13% larger when situated below an amorphous zone than a crystalline zone: the Ti intensity is therefore an in situ means to check position of the X-ray beam at any given energy. Looking now to the lower part of Figure 8, one clearly sees a Ti intensity drop around 11 300 eV for the DVD spot 2: the X-ray µ-spot has moved out of the DVD spot. The microscopic X-ray spot of 4-5 µm diameter has always to probe the same and unique enlarged 7 µm diameter DVD spot—and that—on the whole 1 keV
1.0 0.8 0.6 0.4 0.2 0.0 1.106 1.108 1.110 1.112 Energy (eV) 1.114 1.116 1.1100 0.0 0.2 0.4 0.6 0.8 1.0 1.1102 1.1104 1.1106 1.1108 1.1110 x10⁴ 1.118 1.120 Near-edge signal cristalline amorphous Figure 6
Micro-XAS spectra collected in fluorescence mode at the Ge K-edge (11103 eV) on the crystalline and amorphous zones of a DVD.
0 -0.2 11000 11200 11400 11600 11800 0.2 0.4 0.6 0.8 1 1.2 Absorbance (a.u.) 11100 0 0.2 0.4 0.6 0.8 1 11110 11120 E (keV) E (keV) 11130 11140 11150 Crystalline Amorphous DVD focus Figure 7
Compared micro-XAS spectra collected in fluorescence mode at the Ge K-edge (11103 eV) on crystalline, amorphous layer of a DVD and a single crystalline DVD spot number 2 display in Figure 4.
energy range necessary to record XAS spectra. The stability of such a micro-spot is very dependant of the stability of any optical elements in the beam as well as the stability of the orbits of the electron beam in the storage ring. This is still a challenging task.
2.2 In situ Study in a Diamond Anvil Cell of the Dissolution of Strontianite
at High P-T Conditions by Synchrotron X-ray Microfluorescence [45]
Upon subduction of the oceanic lithosphere, volatile species are transported to the deep Earth, mostly as hydrous silicates (e.g. serpentines, amphiboles, chlorites, micas, lawsonite) and as carbonates. The volatile species, H20 and CO2, are
lib-erated into the mantle during dehydratation/decarbonation
reactions. The fluid phases thus produced, aqueous solutions enriched in various ionic species, react with silicate and car-bonate minerals, inducing melting, eventually leading to arc magmatism. In this process, it appears that these yet poorly known fluids are essential vectors of chemical transport in the deep Earth. It is therefore of great importance to deter-mine the chemical compositions of these fluids and to study their reactivities with silicates and carbonates. Because of the absence of in-situ studies, the composition of these deep flu-ids has remained highly uncertain. However, thanks to the development of new high-pressure cells, the in situ study of fluids is now possible even under high pressures and temper-atures (0-2 GPa and 25-1000°C). Hydrothermal diamond-anvil cell has been developed and allows such fluids to be studied at pressures still relevant to deep upper mantle and transition zone. 4.4 4.6 4.8 0.9 1.0 1.1 11 11.2 11.4 11.6 11.8 E (keV)
Large spot on cristalline Large spot on amorphous
µspot on single DVD spot 2
µspot on single DVD spot 1
Figure 8
Large and single DVD spots Ti fluorescence. The Ti fluorescence is more than 6 keV away from the Ge K-edge, consequently its intensity as a function of energy is a monotonous and slow varying function (top Figure). On the lower part of the Figure, a Ti intensity drop around 11 300 eV for the DVD spot 2 is found due to the X-ray µ–spot that has moved out of the DVD spot.
Strontianite (SrCO3) has been chosen in this study instead
of calcite for the following reasons:
– its solubility, although different from that of aragonite and calcite by almost one order of magnitude, follows the gen-eral behavior observed for calcium carbonates with P-T for the limited investigated range [46];
– Sr is amenable to solubility measurement through in situ X-ray fluorescence whereas Ca is not;
– Sr is a widely used geochemical tracer of hydrothermal processes [47];
– modeling its behavior in natural Ca-rich solid solutions requires data on its own end-member [48].
Although the solubility constant of strontianite (Ks) is well documented in the 2–200 °C temperature range, the behavior of the SrCO3- H2O system at high pressure is poorly known.
A single high-pressure study by Helz and Holland [49] showed that SrCO3solubility increased with increasing total
pressure from 1 to 50 atm. This behavior observed at moder-ate pressure cannot be extrapolmoder-ated reasonably to the pres-sures relevant to the upper mantle. It is of great importance to measure in situ mineral dissolution rates at simultaneous high P-T conditions. The Synchrotron X-ray fluorescence micro-probe (SXRF) is a powerful technique for determining trace-element distribution and concentration with micrometer reso-lution and ppm sensitivity. Progresses in synchrotron light sources have improved the sensitivity of this method, so that quantification of element concentration from a sample placed between the two diamond windows of a diamond anvil cell (DAC) is now possible. As has been shown in this study, third-generation synchrotrons allow the use of forward-trans-mission geometry without modifying the original design of the DAC, thus achieving higher-pressure conditions. In this work, we report in-situ experiments on the dissolution of strontianite (SrCO3) crystal in aqueous solution loaded in an
externally heated DAC by monitoring the fluorescence of Sr2+ cations in the fluid as a function of P-T conditions
relevant to cold sub-ducting slabs (up to 3.6 GPa and 523 K). The crystal was placed in a RbNO3solution (0.01 M at
ambi-ent conditions) to follow the evolution of the Sr/Rb ratio in the fluid, this ratio being more accurately measured than absolute Sr concentrations. Indeed, the imprecision of correc-tion procedures cancel out in the case of two elements with close energies for emitted X-rays (14.2 keV and 13.4 keV for Sr and Rb, respectively). To use the Kαintensities ratio as a tracer of the dissolution process, solutions with known con-centrations of Rb and Sr were used to calibrate their fluores-cence yields in the same experimental configuration, i.e., loaded in the DAC.
All experiments were performed in a membrane-type DAC equipped with an external resistive Watlow heater sur-rounding the body of the cell. In this device, pressure is gen-erated by flushing He gas into the membrane chamber. The induced membrane deformation drives the movement of the DAC piston. Low-fluorescence, type Ia diamonds with 500 µm culets were used. Pressure chambers were formed from 300 µm diameter holes drilled in a rhenium gasket preindented at about 60 µm thickness. The cell was loaded with a single crystal of Strontianite (30 × 20 × 20 µm) together with a ruby chip, and subsequently filled with the 0.01 M RbNO3aqueous solution. Temperature was read with
a K-thermocouple, calibrated before experiments, and included in the heating device. Estimated uncertainties in temperature are ± 2 K. Pressure was calculated from the cali-brated shift of the R1 fluorescence line of the ruby, after tem-perature correction [50].
Dissolution of Strontianite in H2O was measured in two
runs as a function of pressure (up to 3.6 GPa), along isother-mal paths. For all investigated isotherms, SrCO3dissolution
strongly increases as a function of pressure, extending at high pressure the early low-pressure observations. Figure 9 shows X-ray transmission images of the compression chamber taken by an X-ray CCD camera at the beginning and the end
a) Ruby Rb (10 mM) Beam SrCO3 100 µm Re gasket P = 0.4 GPa T = 298 K b) Ruby Rb (10 mM) Beam SrCO3 100 µm Re gasket P = 3.6 GPa T = 523 K Figure 9
X-ray images of a SrCO3sample together with a ruby chip in the compression chamber at the beginning (a) and the end (b) of the experimental
of the second run. They show that the SrCO3 crystal
decreased in size during the run, as temperature and pressure were finally increased to 523 K and 3.6 GPa at the end of the run. The dissolution of Strontianite is also demonstrated by the large changes in the intensity of the Sr fluorescence peak observed in the fluid, as shown by the spectra recorded at 0.4 GPa, 298 K and 3.6 GPa, 523 K (Fig. 10). This intensity change is associated with an increase in Sr2+(aq)
concentra-tion in the fluid from about 2 mM at initial condiconcentra-tions to about 0.18 M at the end of the run. Moreover, Kinetic effects may be important concerning the observed increase in Sr2+
concentrations between 323 and 373 K, as there is almost no pressure change (0.9 to 1 GPa). It has been shown from mea-surements that Sr2+concentration in the fluid still increases
after 3000 seconds under high-pressure, high-temperature conditions, suggesting that equilibrium has not yet been reached. The measured dissolution values are thus the result of interplay between thermodynamic and kinetic parameters. We were able to demonstrate that the minimum detection limits using Si(Li) energy dispersive detector placed in a backscattering collection geometry at 15° from the incident beam is about 6 ppm (~ 6.10–5M) for Sr and Rb in a fluid
placed in a DAC. Classically, the fluorescence collection geometry required a detector placed at 90°. This would require complicated changes in the DAC design and would limit experiments to much lower pressure. Even thin dia-monds used in this experiment are highly absorbent and decrease the fluorescence. However, the large Compton/ Rayleigh scattering in the 15° geometry of our experiment constitutes the largest contribution to the background, and thus decreases detection sensitivity.
Figure 10
X-ray microfluorescence spectra collected in the fluid in the diamond anvil cell during dissolution measurements of SrCO3at different P-T conditions. The spectra are offset
along the fluorescence intensity axis for clarity. (Modified and Reprinted with permission of Sanchez-Valle C. [45]).
The present study thus emphasizes that SXRF is a suitable technique for in-situ monitoring of elemental fluorescence in a fluid during dissolution of minerals at high P-T conditions in a standard DAC. This technique can be applied to ele-ments with Z > 28, for which the characteristic X-ray fluores-cence lines emitted, are highly transmitted by 2 mm thick diamond anvil. The above experimental results lead to impor-tant consequences for quantitative modeling of Sr behavior in subduction zones because they show that the solubility of Strontianite in pure H2O is increased at least two fold
between 0.4 GPa and 3.6 GPa. More generally, the results will help to constrain better the thermodynamical modeling of aqueous species at extreme pressures and temperatures.
CONCLUSION
The development of methods for X-ray focusing and the development of synchrotron radiation source have opened up XRF to the field of microscopy with the possibility to deter-mine the relative abundances of elements with high precision and accuracy and to point out correlation among the different elements. This quick overview aimed at showing the extended capabilities of synchrotron microprobe techniques, their versatility, high elemental, structural and chemical sen-sitivity that result from the combination of x-ray micro-tech-niques (XRF, XRD, XAS) accessing to complementary information on the very same sample region analyzed. The examples presented in this manuscript demonstrate some important application of X-ray microprobe techniques in material science or geochemistry.
Application of these techniques can be extended for trace element microanalysis of crude oil. Trace element assed to be intimate to crude oil can be used for geochemical characteri-zation of source rocks or to prevent cracking catalyst poison-ing, corrosion… during oil production and refining. The pos-sibility to work on the original crude oil sample without further chemical processing or fractionation is of importance. In addition, simultaneous determination of elemental distrib-ution, chemical speciation and structural information through synchrotron X-ray microfluorescence, X-ray absorption microspectroscopy and microdiffraction respectively, can certainly bring insight in problems encountered in petroleum crude production. Particularly, if existing, micro-phase could be fully characterized. Some trace metals act as contaminants that can affect the fluidized catalytic cracking unit (FCCU) used in the oil refining industry. In this case, such set of tech-niques could be of interest in the study of the resulting cata-lyst fine and ultrafine particle emission. Clearly, multipur-pose X-ray microprobe beamline is well suited for the microscale investigation of such complex materials by study-ing associated trace metals distribution and concentration, speciation and matrix composition.
On top of these possibilities, 3D distribution of elements can now be accessed through X-ray microfluorescence
6000 5000 4000 3000 2000 1000 0 700 750 800 Detector Channels 523 K 3.6 GPa 298 K 0.4 GPa Kα Rb Kα Sr 850 900
tomography. Even though X-rays photons are less damaging than electrons, protons or ions, radiation damages is still a concern (particularly for biological material) when working with high photon flux from third generation synchrotron. Despite the large number of synchrotron sources worldwide only a few dedicated microprobe are available and have to face an increasing demands for combined microanalysis (ele-mental, structural, chemical) with still limited access.
One of the drawbacks of such a versatile analytical tool is that it becomes easily complicated from an instrumental point of view. Working in the sub-micron range required sig-nificant efforts in instrumentation (optics, sample environ-ment), beam stability, detection efficiency and dedicated quantification methodologies.
The actual developments are driven by getting not only higher spatial resolution which in the X-ray range is mainly limited by technologies (electron beam lithography, chemical etching, etc.) used to produce dedicated optics for nanofocus-ing. There are also driven by building dedicated environment for in-situ experiments, focusing efforts on new detection tech-niques (optimized multi-element detector geometry, etc.) in order to achieve, in the future, combined two dimensional mapping of elements and valence state/local structure on the (sub)micron scale in both stable and time dependant inhomo-geneous systems under controlled conditions (temperature and pressure). Many developments take advantage of the versatility of the synchrotron microprobe to adapt various environments for in-situ measurements, which are more and more requested but lay a great stress on the sample preparation process.
Concerning spatial resolution, 30 nm focused beams are routinely used in the soft X-ray range (few hundred eV) and less than 100 nm beam are started to be produced in the hard X-ray range (2–30 keV). Synchrotron X-ray microprobe still suffers from a lack of maturity compared to electron microscopy and related techniques. Anyhow, the benefits of large depth of penetration of X-rays (few microns to few hundred of microns), and a unique possibility for energy tun-ability for chemical speciation at the sub-micron level are important advantages of synchrotron microprobe. Its sensitiv-ity (absolute limit of detection in the attogram range), its capabilities to provide measurements in air, under vacuum or He environment, to accept various samples with minimal preparation and to combined several techniques in one shot (diffraction, X-ray fluorescence, X-ray tomography, X-ray spectroscopy for speciation), open ways for new informative
in-situ micro-measurements (pressure, temperature, stress/
strain testing, hydrated conditions, cryo-microscopy, etc.).
ACKNOWLEDGMENTS
The Authors are grateful to Drs Rose, Bénard, Borschneck and Botterro from the CEREGE laboratory in Aix en Provence in France for their work on the Portland cement carried out at ESRF beamline ID21.
We are grateful to Drs Bihannic, Michot, Lartiges, Vantelon, Labille and Thomas from the INPL-ENSG-CNRS UMR 7569 Laboratory in Vandoeuvre in France, for the work on clay gel material performed at ID21 ESRF beam-line.
We thank Drs Poupinet, Hyot, Lagrange and Lartigues from CEA-LETI in Grenoble, France for their collaboration in the experiments at ESRF- ID22 on phase change in rewritable DVD.
We thank Drs Sanchez-Valle and Daniel for their work on dissolution of strontianite at high P-T conditions performed at ESRF ID22 beamline.
ESRF staff of beamline ID21 and ID18F-ID22 is greatly acknowledge.
REFERENCES
1 VanGrieken, R.E. and Markowics, A.A. (1993) Handbook of X-ray Spectrometry, Marcel Dekker, New York.
2 Jenkins, R., Gould, R.W. and Gedcke, D. (1995) Quantitative X-ray Spectrometry, Second ed., Marcel Dekker, New York. 3 Adams F., Janssens K. and Snigirev A. (1998) Microscopic
X-ray fluorescence analysis and related methods with laboratory and synchrotron radiation sources. J. of Analytical Atomic Spectrometry, 13, 319–331.
4 Koningsberger, D.C. and Prins, R. (1988) X-Ray Absorption: Principles, Applications, Techniques of EXAFS, SEXAFS and XANES, Wiley, New York.
5 Susini, J., Barrett, R., Kaulich, B., Oestreich, S. and Salomé, M. (2000) The X-ray microscopy facility at ESRF: a status report. 6th Int. conf. on X-Ray Microscopy, Berkeley, eds.W. Meyer-Ilse, T.Warwick and D. Attwood, AIP Conf. Proc. 507, 19.
6 Di Fabrizio, E., Romanato, F., Gentili, M., Cabrini, S., Kaulich, B., Susini, J., and Barrett R. (1999) High efficiency multilevel zone plate for keV X-rays Nature, 401, 895-98. 7 David, C., Kaulich, B., Barrett, R., Salomé, M., and Susini, J.
(2000) High resolution lenses for sub-100 nm X-ray fluorescence microscopy. Appl. Phys. Lett., 77, 23, 3851. 8 Cuif, J.P., Dauphin, Y., Doucet, J., Salomé, M. and Susini, J.
(2003) XANES mapping of organic sulfate in three scleratinian coral skeletons. Geochimica & Cosmochimica Acta, 67,1, 75-83.
9 Dauphin, Y., Cuif, J.P., Doucet, J., Salomé, M., Susini, J. and Williams C.T. (2003) In situ chemical speciation of sulfur in catalytic biominerals and the simple prism concept. J. Structural Biology, 142, 272-280..
10 Prietzel, J., Thieme, J., Neuhäusler, U., Susini, J. and Kögel-Knabner, I. (2003) Speciation of sulphur in soils and soil particles by X-ray spectromicroscopy., European Journal of Soil Science, 54, 423-33.
11 Merigoux, C., Briki, F., Sarrot-Reynauld, F., Doucet, J., Fayard, B., Susini, J. and Salomé M. (2003) Evidence for various calcium sites in human hair shaft revealed by sub-micrometer X-ray fluorescence. Biochimica & Biophysica Acta, 1619, 1, 53-58.
12 Ueki, T., Takemoto, K., Fayard, B., Salome, M., Yamamoto, A., Kihara, H., Susini, J., Scippa, S., Uyama, T. and Michibata H. (2002) Scanning Xray microscopy of living and freeze-dried blood cells in two vanadium- rich ascidian
species, Phallusia mammillata and Ascidia sydneiensis samea. Zoological Science, 19,1, 27-35.
13 Ortega, R., Deves, G., Bonnin-Mosbah, M., Salomé M., Susini, J., Anderson, L. and Kasprzak, S.K. (2001) Chromium mapping in male mice reproductive glands exposed to CrCl3using proton and x-ray synchrotron radiation microbeams. Nuclear Instruments and Methods B, 181, 485-488.
14 Bonnin-Mosbah, M., Métrich, N., Susini, J., Salomé, M., Massare, D. and Menez, B. (2002) Micro X-ray Absorption Near Edge Structure (XANES) at the sulphur and iron K-edges in natural silicate glasses. Spectrochimica Acta Part B, 57, 711-725.
15 Schneider G. (1998) Cryo X-ray microscopy with high spatial resolution in amplitude and phase contrasts. Ultramicroscopy, 75, 2, 85-104.
16 Morrison, G.R., Eaton, W., Barrett, R. and Charalambous, P.S., (2003) STXM Imaging with a Configured Detector, Proceedings of the 7th International Conference on X-ray Microscopy, Grenoble, France. J. Phys. IV, 104, 547-550. 17 Wilhein, T., Kaulich, B., Di Fabrizio, E., Romanato, F.,
Cabrini, S. and Susini, J. (2001) Differential interference contrast x-ray microscopy with submicron resolution. Appl. Phys. Lett., 78, 14, 2082-2084.
18 Kaulich, B., Polack, F., Neuhaeusler, U., Susini, J., Di Fabrizio, E. and Wilhein, T. (2002) Diffracting aperture based differential phase contrast for scanning X-ray microscopy. Optics Express, 10, 20, 1111-1117.
19 Schmahl, G. and Rudolph, D. (1987) Proposal for a phase contrast X-ray microscope, in X-Ray Microscopy Instrumentation and Biological Applications, Cheng, P.C. and Jan, G.J. (éds.), Springer-Verlag, Berlin, 231.
20 Bihannic, I., Michot, L.J., Lartiges, B.S., Vantelon, D., Labille, J., Thomas, F., Susini, J., Salomé, M. and Fayard B. (2001) First Direct Visualization of Oriented Mesostructures in Clay Gels by Synchrotron-Based X-ray Fluorescence Microscopy. Langmuir, 17, 4144-4147.
21 Pignon, F., Magnin, A., Piau, J.-M., Cabane, B., Lindner, P. and Diat, O. (1997) Yield stress thixotropic clay suspension: Investigations of structure by light neutron and x-ray scattering. Phys. Rev. E, 56, 3281-3289.
22 Mourchid, A., Lécolier, E., Van Damme, H. and Levitz, P. (1998) On viscoelactic, birefringent, and swelling properties of laponite clay suspensions: revisited phase diagram. Langmuir, 14, 4718-4723.
23 Ramsay, J.D.F. and Lindner, P. (1993) Small angle neutron scattering investigations on the structure of thixotropic dispersions ofsmectite clay colloids. J. Chem. Soc., Faraday Trans., 89, 4207-4214.
24 Gu, B. and Doner, H.E. (1992) The microstrucutre of the dilute clay and humic-acid suspensions revealed by freeze-fracture. Clays Clay Miner., 40, 246-250.
25 Preis, T. and Thieme, J., (1997) Dynamical studies of aqueous clay mineral dispersions by x-ray microscopy. Langmuir, 12, 4, 1105- 1106.
26 Neuhausler, U., Abend, S., Jacobsen, C. and Lagaly, G. (1999) Soft X-ray spectromicroscopy on solid-stabilized emulsion. Colloid Polym. Sci., 277, 8, 719-726.
27 Rose, J., Bénard, A., Susini, J., Borschneck, D., Hazemann, J.L., Cheylan, P., Vichot, A. and Boterro J.Y. (2003) First Insights of Cr Speciation in Leached Portland Cement Using X-ray Spectromicroscopy. Environ. Sci. Technol., 37, 4864-4870.
28 IARC, International Agency for Research on Cancer (1990) in: Chromium, Nickel and Welding Fumes, IARC
Monographs on the Evaluation of Carcinogenic Risks to Humans, 49, IARC Scientific Publications, Lyon.
29 Omotoso, O.E., Ivey, D.G. and Mikula, R. (1998) Hexavalent chromium in tricalcium silicate: Part I, quantitative X-ray diffraction analysis of crystalline hydration products J. Mater. Sci, 33, 507-513.
30 Cho, J. W., Ioku, K. and Goto, S. (1999) Effect of PbII and CrVI ions on the hydratation of slag alkaline cement ad the immobilization of these heavy metal ions. Adv. Cem. Res., 11, 3, 111-118.
31 Serclérat, I. Moszkowicz, P. and Pollet, B. (2000) Retention mechanisms in mortar of trace metals contained in Portland cement clinkers. Waste Manage, 20, 259-264.
32 Bohic, S., Simionovici, A., Snigirev, A., Ortega, R., Deves, G., Heymann, D. and Schroer, C.G. (2001) Synchrotron hard X-ray microprobe: fluorescence imaging of single cells. Appl. Phys. Letters, 78, 3544-46.
33 Salbu, B., Kregling, T., Lind, O.C., Oughton, D.H., Drakopoulos, M., Simionovici, A., Snigirev, A., Snigireva, I., Weitkamp, T., Adams, F., Janssens, K. and Kashparov V.A. (2001) High Energy X-ray microscopy for the characterisation of fuel particles. Nucl. Instrum. and Meth. A, 467-468, 1249-1252.
34 Camerani Pinzani, M.C., Somogyi, A., Simionovici, A., Ansell, S., Steenari, B.M. and Lindquist, O. (2002) Direct determination of cadmium speciation in municipal solid waste fly ashes by synchrotron radiation induced micro-X-ray fluorescence and micro-X-micro-X-ray absorption spectroscopy. Environmental Science and Technology, 36, 3165-3169. 35 Ménez, B., Philippot, P., Bonnin-Mosbah, M., Simionovici,
A. and Gibert, F. (2002) Analysis of individual fluid inclusions using synchrotron Xray fluorescence microprobe: progress toward calibration for trace elements. Geochimica et Cosmochimica Acta, 66, 561-576.
36 Bonnin-Mosbah M., Simionovici A.S., Metrich, N., Duraud, J.P., Massare, D. and Dillman, P. (2001) Iron oxidation states in silicate glass fragments and glass inclusions with a XANES micro-probe. J. of Noncrystalline Solids, 288, (1-3), 103-113.
37 Borg, J., Quirico, E., Simionovici, A., Raynal, P.I., Chevallier, P. and Langevin, Y. (2002) Synchrotron radiation as a tool for in situ investigation of extraterrestrial grains in low-density collectors: application to the analyses of the PIE polymid foams targets. Planetary and Space Science, 50, 1055-1065. 38 Martinetto, P., Anne, M., Dooryhée, E., Drakopoulos, M.,
Dubus, M., Salomon, J., Simionovici, A. and Walter, P. (2001) Synchrotron X-ray microbeam studies of ancient Egyptian make-up. Nucl. Instrum. and Meth. B, 181, 744-748.
39 Drakopoulos, M., Zegenhagen, J., Snigirev, A., Snigireva, I., Hause, M., Eberl, K., Aristov, V., Shabelnikov, L. and Yunkin, V. (2002) X-ray standing wave microscopy: chemical analysis with atomic resolution. Appl. Phys. Lett, 81, 2279-2281.
40 Castelnau, O., Drakopoulos, M., Schroer, C., Snigireva, I., Snigirev, A. and Ungar T. (2001) Dislocation Density Analysis in Single Grains of Steel by X-Ray Scanning. Microdiffraction. Nucl. Instrum. and Meth. A, 467-468, 1245-1248.
41 Golosio, B., Simionovici, A., Somogyi, A., Lemelle, L., Chukalina, M. and Brunetti, A. (2004) Internal elemental microanalysis combining X-ray fluorescence, Compton and transmission tomography. J. of Appl. Phys, 94, 145-156. 42 Marchesini S., Schmithüsen F., Tegze M., Faigel G., Calvayrac
Direct 3D Imaging of Al70.4Pd21Mn8.6 Quasicrystal Local Atomic Structure by X-ray Holography. Phys. Rev. Letters, 85, 4723-4726.
43 Somogyi, A., Drakopoulos, M., Vincze, L., Vekemans, B., Camerani, C., Janssens, K., Snigirev, A. and Adams, F. (2001) ID18F: a new micro X-ray fluorescence end-station at the European Synchrotron Radiation Facility (ESRF): preliminary results. X-Ray Spectrometry 30, 242-252. 44 Lengeler, B., Schroer, C., Tümmler, J., Benner, B., Richwin,
M., Snigirev, A., Snigireva, I. and Drakopoulos, M. (1999) Imaging by parabolic refractive lenses in the hard X-ray range. J. Synchrotron Rad., 6, 1153-67.
45 Sanchez-Valle, C., Martinez, I., Daniel, I., Philippot, P., Bohic, S. and Simionovici, A. (2003) Dissolution of strontianite at high P-T conditions: An in-situ synchrotron X-ray fluorescence study. American Mineralogist, 88, 978-985.
46 Plummer, L.N. and Busenberg, E. (1982) The solubilities of calcite, aragonite and vaterite in CO2-H2O solutions between 0 and 90 ºC, and an evaluation of the aqueous model for the
system CaCO3-CO2-H2O. Geochimica Cosmochimica Acta, 46, 1011–1040.
47 Hawkesworth, C.J., Gallagher, K., Hergt, J.M. and McDemott, F. (1993) Mantle and slab contributions in arc magmas. Annual Reviews of Earth and Planetary Sciences, 21, 175–204.
48 Plummer, L.N. and Busenberg, E. (1987) Thermodynamics of aragonite-strontianite solid solutions: Results from stoichio-metric solubility at 25 and 76 ºC. Geochimica Cosmochimica Acta, 54, 1393-1411.
49 Helz, G.R. and Holland, H.D. (1965) The solubility and geologic occurrence of Strontianite. Geochimica and Cosmo-chimica Acta, 29, 1303–1315.
50 Ragan, D.R., Gustacsen, R. and Schiferl, D. (1992) Calibration of the R1 and R2 fluorescence shift as a function of temperature from 0 to 600 K. Journal of Applied Physics, 72, 5539–5544.
Final manuscript received in May 2005
Copyright © 2005 Institut français du pétrole
Permission to make digital or hard copies of part or all of this work for personal or classroom use is granted without fee provided that copies are not made or distributed for profit or commercial advantage and that copies bear this notice and the full citation on the first page. Copyrights for components of this work owned by others than IFP must be honored. Abstracting with credit is permitted. To copy otherwise, to republish, to post on servers, or to redistribute to lists, requires prior specific permission and/or a fee: Request permission from Documentation, Institut français du pétrole, fax. +33 1 47 52 70 78, or [email protected].