HAL Id: hal-01692453
https://hal.archives-ouvertes.fr/hal-01692453
Preprint submitted on 25 Jan 2018HAL is a multi-disciplinary open access archive for the deposit and dissemination of sci-entific research documents, whether they are pub-lished or not. The documents may come from teaching and research institutions in France or abroad, or from public or private research centers.
L’archive ouverte pluridisciplinaire HAL, est destinée au dépôt et à la diffusion de documents scientifiques de niveau recherche, publiés ou non, émanant des établissements d’enseignement et de recherche français ou étrangers, des laboratoires publics ou privés.
Is electricity affordable and reliable for all in Vietnam?
Minh Ha-Duong, Hoai Son Nguyen
To cite this version:
Minh Ha-Duong, Hoai Son Nguyen. Is electricity affordable and reliable for all in Vietnam?. 2018. �hal-01692453�
DOCUMENTS DE TRAVAIL / WORKING PAPERS
2017- 65
Is electricity affordable and reliable
for all in Vietnam?
Minh Ha-Duong
1et Hoai Son Nguyen
2July 2017
1Corresponding author. < [email protected] >. CIRED/CNRS, Campus du Jardin Tropical, 45 avenue de la belle Gabrielle, 94736 Nogent
sur Marne CEDEX, France. Tel. (VN) +84 16 26 38 77 84 ; (FR) +33 668 52 59 15. Fax (FR) +33 1 43 84 73 70
Abstract
Access to clean and affordable energy for all is the seventh sustainable development goal. This manuscript examines the state of access to electricity for all in Vietnam, based on national households’ surveys conducted in the time period 2008-2014. We find that in Vietnam, the problem of providing access to clean energy for all is largely solved for now: the fraction of households without access to electricity is below two percent, the median level of electricity usage in 2014 was 100 kWh per month per household, the fraction of households declaring unsatisfied electricity needs is below three percent. We find that electricity is becoming a heavier burden in Vietnamese households’ finances. In 2010, the electricity bill exceeded 6% of income for 2.4% of households, but in 2014 that number reached 5.5% of households. In practical terms, we discuss the challenge of a socially just increase of electricity tariff, necessary to finance a clean development of energy system. Our theoretical contribution to debates on energy poverty is to account for the human dimension by using a self-reported satisfaction indicator. Our study shows that subjective energy poverty indicators –designed from surveys asking people if they had enough electricity to meet their households needs– are as relevant as objective indicators –from engineering or economic data. While objectivity is laudable, development is not only about technology and money: measuring human satisfaction matters.
Keywords
: Electricity, Vietnam, Sustainable Development Goals, IndicatorsHighlights
A) Electrification in Vietnam is extensive: in 2014, 96.9 % of rural, and 99.8 % of urban households, used grid electricity for lightning.
Engineering and economic energy poverty indicator are not substitutes for a subjective indicator of needs satisfaction.
B) In 2014 less than 3 % of all Vietnamese households declared that their electricity use was insufficient to meet their needs.
C) In 2014, the electricity bill was greater than 6 % of income for 5.5 % of households. That burden in increasing.
D) A much more progressive retail tariff of electricity for households can reduce energy poverty and encourage energy savings.
Introduction
Access to clean and affordable energy for all is the seventh United Nations Sustainable Development Goal, one of our overarching civilization goals in the beginning of this millennium. This text discusses the progress towards this goal of a middle-income country comprising over ninety million people, the 14th most populated country in the world: Vietnam.
Vietnam’s development is highly successful in economic terms. Its GDP per capita grew from 97.2 USD in 1989 to 2 110 USD in 2015 (World Bank database, accessed 2016-09-11). Table provides more details on the country’s conditions in recent years.
Vietnam’s rural electrification program is oft-cited as an exemplary success of providing energy access (Doan Van Binh, 2010; Asian Development Bank. 2011). Yet in the considerable academic literature on energy poverty (Li, Pan, and Wei, 2015) it is hard to find any study about Vietnamese households among the reports on China, India, Brazil and South Africa. (Sovacool et al. 2011) includes Vietnam, but looks at small businesses rather than households.
This manuscript contributes facts and numbers on the state of access to electricity for all in Vietnam, based on large-scale surveys conducted in the time period 2010-2014 independently from EVN, the national electricity company. We focus on electricity poverty, leaving fuel poverty questions for further research.
The outline and main results of the manuscript are as follows. Section 2 presents the scope relative to previous existing research, our data and methods. It presents this paper’s main theoretical discussion on using a self-reported satisfaction indicator to account for the human dimension of energy poverty. One way to measure energy poverty is simply to ask people if they had enough of it to meet their needs. We will show that results obtained by this approach complement, rather than substitute, results obtained by engineering and economic approaches of energy poverty.
Section 3 presents statistics on grid access and electricity usage, in kWh. Its main results are that 1/ Less than two percent of households’ lack grid access; and 2/ The median level of electricity usage in 2014 was 100 kWh per month per household.
Section 4 discusses affordability, using a more narrative historical perspective on measures taken by the Government of Vietnam, in the form of a block tariff and direct subsidies. Our statistics find that 94.5% of households spend less than 6% of their income on electricity in 2014, but the effort level is increasing.
Section 5 presents results about satisfaction of needs. We observe that satisfaction increased quickly between 2010 and 2012, and conjecture two explanations. One is that the observation is due to chance, weather variability. The other is that the satisfaction increase is due to a great increase of system reliability in that period.
Policy discussion section 6 synthesizes the observed progress in terms of sustainable development indicators, and peeks at the challenges ahead: wealth and population growth; urbanization and lifestyle changes; national independence; and pollution. We Table 1 : Vietnam’s economy and electricity conditions in 2008-2014.
a Source GSO, accessed 2016-10-10, b Source IEA, accessed 2016-10-10 c In 2014, includes
industry 54%, household 36%, services 5%, agriculture 2% and other 4% (Solidiance 2015).
Year 2008 2010 2012 2014 Populationa 85 118 700 86 947 400 88 809 300 90 728 900 GDP at current prices, billion Dongsa 1 616 047 2 157 828 3 245 419 3 937 856 Price index, base 100 in 2008a 100,0 116,9 151,1 167,7
Share of population in urban areaa 28,99 % 30,50 % 31,83 % 33,10 % Electricity final consumption, annualb 67,8 TWh 86,9 TWh 105,4 TWh 130,9 TWh Electricity final
consumption, annual per capitac
quantify an example of a more progressive electricity tariff that aim at the same time a) reduce energy poverty, b) incite the richer households to conserve energy and install rooftop solar panels as well as c) increase available income to finance a cleaner development of the electricity generation system.
Section 7 summarizes and concludes.
1 Scope, data and method
Universal access to electricity is sought at the early stages of economic development because it is an enabler. Lighting and electric engines increases productivity. Radio communication connects people. Refrigeration allows to preserve vaccines and better store food for sale or consumption. An electric turbofan in advanced cook stoves reduces the indoor air pollution caused by inefficient combustion in traditional biomass. Full electric cooking eliminates it in urban areas.
To focus the attention of the international community on the need to provide these benefits to all humans, the United Nations have adopted « Ensure access to affordable, reliable, sustainable, and modern energy for all » as Sustainable Development Goal 7. To assess progress towards this goal (SDSN, 2015) gives the following two Key Performance Indicators, the KPI #50 and #51:
• Share of the population with access to modern cooking solutions (%)
• Share of the population with access to reliable electricity, by urban and rural (%)
These two KPI share a similar pattern. They each start from an aspect of energy poverty: respectively cooking with traditional solutions, and lacking access to reliable electricity. Then the indicator is constructed as « Share of the population not in that energy poverty situation ». Academic literature offers many others ways to recognize an energy poverty situation.
• Not having access to enough energy to meet the basic needs, defined according to human and environmental considerations. Shelter is a basic need for physical well-being. For example, the official French definition according to the « Loi Besson du 2010-07-12 », also known as « Grenelle 2 law » states that "is in energy precarity a person who experiences in her house special challenges to have the necessary energy supply to satisfy its basic needs because of the inadequacy of its resources or its habitat." Make cities and human settlements inclusive, safe, resilient and sustainable. In short, energy poors face death from winter cold and summer heat.
• The previous definition overlaps the SDG Goal 11, and does not translate conveniently in statistics. A different take on the unsatisfied basic needs idea is to define an energy poverty line. There are many methods. One is to ask experts. Another is to consider the average energy consumption of households around the income poverty line (Foster, Tre, and Wodon, 2000). Yet another econometric approach defines the energy poverty line as “the threshold point at which energy consumption begins to rise with increases in household income”. At or below this threshold point, households consume a bare minimum level of energy and should be considered energy poor. (Barnes, Khandker, and Samad, 2011) (He and Reiner, 2016)
• Spending more than 10 % of the income to pay the energy bill, including electricity and fuel for heating and cooking excluding transportation. This definition has been set out officially in the UK Fuel Poverty Strategy 2001, according to the critical study by (Hills, 2012). According to ONPE (2016), this has also been used in France. While a convenient rule of thumb to assess the magnitude of the issue from national-scale statistics, it has a fundamental flaw: not related to absolute poverty. This is why Hill (2012) led UK to replace the 10 % of income criteria by a new definition under which households are considered fuel poor if a/ They have required fuel costs that are above the median level; and b/ were they to spend that amount they would be left with a residual income below the official poverty line. This Low Income High Cost definition is also used in France (Chérel, 2014).
To better focus on the facets of energy poverty related to electricity usage, we set aside aspects related to fuels for cooking, transportation or heating. The present note leaves
KPI #50 out of its scope. On the other hand, we take a broad view on KPI #51 by looking not only at electricity access in terms of grid presence, but according to actual electricity use.
We argue that the approaches based purely on energy quantity and/or monetary indicators can only provide a structurally incomplete view of energy poverty, because they all come from an engineering or econometric approach. This remark also includes composite indices such as those proposed in (Nussbaumer, Bazilian, and Modi 2012; Foster, Tre, and Wodon 2000; Pachauri et al. 2004).
Only 2 out of 232 Sustainable Development Goal Indicators are subjective (indicators 10.3.1 and 16.7.2). While objectivity is laudable, development is not only technology and money. People’s satisfaction matters, indicators from Human and Social Sciences can be used. Sustainable development has a social pillar, and social sciences have long integrated the need to include the voice of the subjects into its research methods. (Vignon, 2014, 16) argues that in Europe, a subjective indicator of “being cold in winter” is relevant, and has been use in France and in Ireland.
This report describes the situation of Vietnam with respect to the electricity part of SDG 7 from three perspectives mixing two objective and one subjective point of view: we complement the energy quantity and energy economic indicators with a satisfaction indicator. Section 3 is about access, section 4 is about affordability, and section 5 is about satisfaction levels.
The subjective observable in section 5 is based on replies to the question “In the last month, did your consumption of electricity met the needs of your household?” A clear-cut Yes/No question directly related to the variable being estimated has methodological advantages. Households themselves are best placed to judge if their electricity needs are met. This reduces error compared to indirect measures of energy poverty based on income, expenditure, or basic needs. Regarding basic needs in particular, the adequacy of a shelter is expensive to observe statistically, as it depends on local climate and customs.
Surveys are an objectively repeatable measurement: two independent survey companies applying the same method will find coherent results. And while indicators based on energy quantity or income are theoretically based on precise objective numbers rather than subjective self-assessments, in practice they are also collected by declarative survey and suffer from the same kind of imprecision.
A theoretical limit of the question is that the “needs of your household” as respondents understand it is not identical to the “basic needs” concept used in the poverty research. This can often be seen in rural electrification projects: when providing additional electricity capacity to a previously off-grid community, the demand increases as households buy new electric equipment. The households change their needs well above the small amount of power previously provided, usually at high price and by standalone diesel generators.
The data used to produce all results presented below come from of four large sample surveys conducted in 2008, 2010, 2012 and 2014: the Intercensal Population and Housing Surveys (General Statistical Office, 2015). Conducted under the Ministry of Planning and Investment with support from the United Nation Population Fund, the surveys aim to systematically collect basic information about population and housing as a basis for research, and for assessing and formulating policy mechanisms, programs, targets and plans on national socio-economic development generally, and for the population and housing sectors in particular.
The methods for analyzing the data are ordinary, based on simple robust estimators: counts and quantiles. All Stata and Python scripts we used are published as an electronic supplementary material, with open access under creative commons license. The dataset extracted from the primary survey files is also published.
We did not weigh answers, de-bias or otherwise adjust the data except by clipping outlying values and dropping missing responses. Clipping does not affect the counts and quantiles, but non-responses are known to affect survey results. We were not involved in the data collection. We believe that the surveys were organized in the best possible conditions for the context. The results we present below are subject to systematic and random errors unavoidable in all survey data (Kasprzyk, 2005). We did not attempt to
quantify these errors formally, but hereby forewarn that in the numbers presented below the third digit is not policy-relevant, it is meaningful mathematically only.
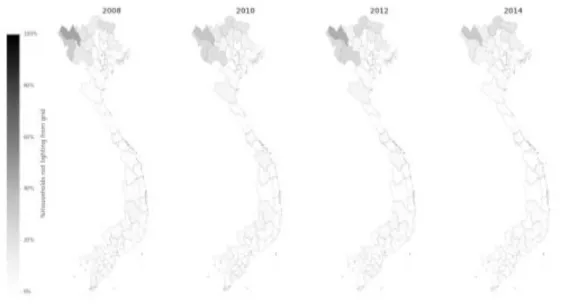
The maps in Figure Illustration and Illustration are drawn without tone intensity correction for province size and province population: they reflect energy poverty levels within a province. Thus, a large gray area does not imply that a large number of people are impacted, since provinces in remote mountains are less densely populated than provinces in the river deltas.
2 Grid access and electricity usage
Surveys asked “Which Is the main lighting in your household”, with possible answers: 1. National-grid electricity, 2. Battery or generator or small-scale-hydroelectricity, 3. Gas, oil lamps of various kinds, 4. Other. Figure Illustration shows the percentage of households who did not declare using national-grid electricity for lighting. This is a proxy for the state of electrification over 2008-2014. It shows that the grid was already operational in most of the territory in 2008, but problem areas remain in the remote villages of the northern mountains are slow to disappear. The cost of these grid connections is high compared to the number of households serviced, in these areas there are not many roads.
With respect to the overall population, our data shows that:
In 2014, 97.7 % of households in Vietnam used grid electricity for lighting.
This number is consistent with the estimate of (Doan Van Binh, 2010) who wrote that:
Vietnam has gone through a rapid increase in electrification since 1990 where electrification levels jumped from a pre-policy reform rate of less than 50% in the late 1980s–early 1990s to 77% by 2001 and 96% by 2009. The Electrification Program driven by the Vietnamese government has resulted in increased access for 82 million people between 1976 and 2009. One million people primarily in the northern mountainous regions of Vietnam are currently without access to electricity.
Other estimates are also about one million without access. (EVN, 2015) reports that by the end of 2014, as much as 98.22 % percent of households were connected to electricity, which means that 1,78 % were not. According to (General Statistical Office 2015, 23–25), as of 1 April 2014 the national population of Viet Nam reached 90,493,400 people […] In 2014, the number of households in the entire country reached 24,264,990, an increase of 1,820,668 households since the 2009 Census. Based on the previous numbers, about 430,000 households were not connected in 2014, and assuming a homogeneous household size that amounts to 1.5 million people.
Figure 1: Progress of electrification.
The share of households not relying on the national grid for lightning decreased from 2010 to 2014 in most provinces.
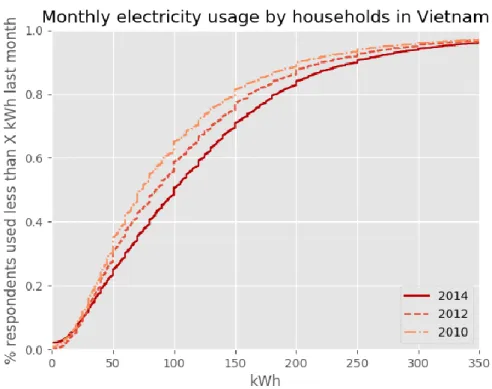
Figure Illustration shows the amount of electricity the households declared using in the last month. Vietnam is a lower middle-income economy in 2014. In this context, the median amount of electricity usage was 100 kWh per month, and the first quartile 50 kWh:
In 2014, out of four Vietnamese households, one used less than 50 kWh per month, and another between 50 kWh and 100 kWh.
Over the 2010-2014 period the distribution shifted to the right, that is towards higher quantities. The median electricity consumption per Vietnamese household in the surveyed month went from 73 kWh to 100 kWh in these four years (+40%), and the mean from 104 kWh to 126 kWh (+21%).
Over that period, the use of electricity by Vietnamese households moved towards a more uniform distribution. The Gini index of Figure Illustration ‘s distributions was 45.3 in 2010, 43.1 in 2012 and 42.6 in 2014.
The main reason why the electricity consumption increased is economic growth, as shown Table. Richer consumers demand more electricity. To quantify this effect, we regressed within period the quantity of electricity used over the annual income. The relation is s table for all three years (see Supplementary Figure), we report only for 2014:
Electricity use in kWh per month = 28.3 + 0.99 * annual income in M VND (eq. 1)
In other words, statistically a Vietnamese household used 1 kWh per day as basic needs, plus 1 kWh per month for each million VND of annual income.
That rule of thumb only applies to compare different households within a period. It does not apply across periods. From 2010 to 2014, the increase in electricity consumption was
Figure 2: Monthly electricity usage by households in Vietnam.
This is a cumulative distribution. For example, it shows that in 2010, about 80 % of the households used less than 150kWh of electricity in the month.
27 kWh for the median, and 22 kWh for the mean. According to our survey dataset, the household income increase from 2010 to 2014 was about 12 M VND2014 for the median and 11 M VND2014 for the mean, when adjusted for the inflation of the consumer price index. We did not use panel data, but these aggregate numbers suggest that across periods, the electricity / household income elasticity may be much higher than 1 kWh per million VND.
3 Energy affordability ensured by block tarification and
subsidies
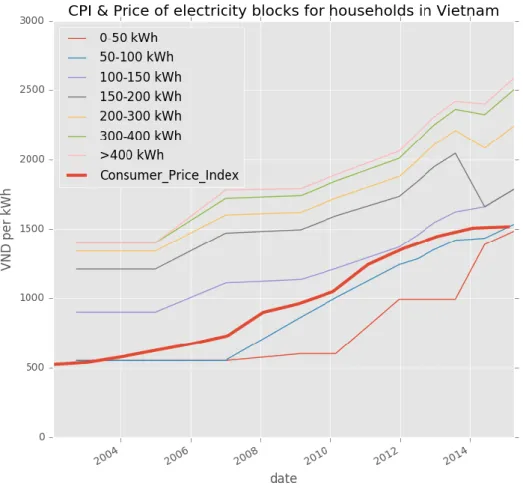
Figure Illustration shows the electricity tariffs in Vietnam, from 2004 to 2014, compared to inflation. There are many curves, because the tariff is progressive. In 2010 for example, consumers paid electricity 600 VND/kWh up to the first 50 kWh, then 1004 VND/kWh from the 51st kWh to the 100th, and so on (see Supplementary Figure for a visual explanation).
Progressive block tariffs for electricity are popular for many developing countries since it has two advantages. Progressive block tariffs mean that the more a household consumes the higher price it has to pay. First, they ensure that poor people can access to electricity at lower price. Second, progressive tariffs stimulate electricity saving behavior, since bigger consumers face higher marginal costs. The first block can be provided at a price lower than production costs, enacting a solidarity between users.
Vietnamese government has adopted progressive block tariffs for electricity since 1994. The rules have evolved as follows:
• 1994: 3 blocks – the first block is 150kwh
• 1995: The 1994 first block was separated to 100kwh for new first block and 50kwh for second block
• 2009: splitting the first block to 2 blocks. The first 50kwh has the price of 35 – 40% of average electricity price. The second 50kwh has the price equaling to the average production costs.
• 2011: amending the first two blocks
◦ The first block is 0 – 50 kWh. The price equals to average production costs. This block and price is only for low income households which consume less than 50kwh per month. These households have to register to EVN for the block. If the electricity consumption of three months exceeds 150 kWh, the seller will apply the price for the second block.
◦ The second block is 0 – 100 kWh. The price is set to the average approved price of electricity.
◦ A household which has an income poverty certificate would get the subsidy of 30.000 VND/household/month if it consumes less than 50 kwh.
• 2014: Adding households that get subsidized price. The household must meet the criteria that Prime Minister define and use less than 50 kWh per month. The subsidized amount equals to the consumption of 30 kwh at the price of the first block.
Figure 3: The price of electricity in Vietnam increased slower than other prices.
Electricity block tariff for households in Vietnam, and inflation (Consumer Prince Index)
Table 2: Electricity bill as a fraction of income.
Source: VHLSS
Figure Illustration shows that electricity tariffs for the first block was kept under control during the high-inflation years after the global economic crisis of 2008 (Nguyen, 2010).
Year 2008 2010 2012 2014
Households not paying anything 0.023 % of household 3.4 % of households 3.2 % of households 2.2 % of households Households paying more than
10 % of their income for electricity bill 0.5 % of households 0.4 % of households 0.5 % of households 1.1 % of households Half of the households pay less
than 1.7 % of income 1.5 % of income 1.8 % of income 2.1 % of income 95 % of the households pay
less than 4,8 % of income 4.6 % of income 5.2 % of income 6.2 % of income
This contributed to protect the poorer consumers and to mitigate inflation. Tariffs eventually caught up when the inflation cooled down (TN News, 2012), but as of 2017 are still lagging behind the general price index.
Table shows the weight of electricity bill in the budget of households (see Supplementary Figure). This is in real terms, corrected for the inflation of the consumer price index. Between 2008 and 2014, Vietnamese households became richer, and the amount of money that they devote to electricity almost doubled. The share of income that Vietnamese households devote to electricity remains modest:
In 2014, 95 % of Vietnamese households devote less than 6.2 % of income to electricity.
This can be regarded as a measure of success that electricity is affordable in Vietnam, as it is far below the 10 % energy poverty limit mentioned above Section 2 (see Supplementary Figure). It does not include any fuel expenses, for transportation or cooking. However, the table shows a worrying trend:
Between 2010 and 2014, the share of income that Vietnamese households devote to electricity increased by about one third.
4 Satisfaction: people say their electricity needs are
meet
Table summarizes the answers to VHLSS 2010/2012/2014 surveys Q12. Has consumption of electricity [.…] been sufficient to meet needs over the last 30 days? It shows that:
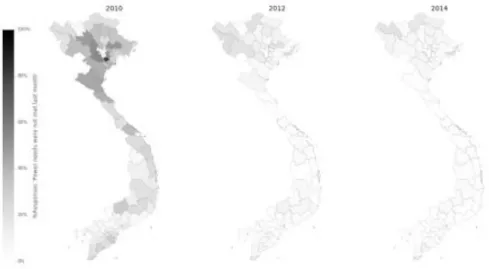
In 2010, one out of four households in Vietnam declared that their electricity use was insufficient to meet their needs. That ratio dropped under 3 % in 2014.
Figure Illustration shows geographically this rapid progress in satisfaction between 2010 and 2012. In the 2014 survey wave, only 2.7 % answered that their consumption of electricity did not meet their needs. This may be a surprising result compared to the relatively slower progress of the grid shown Figure Illustration. During the 2010-2014 time period, what quick and decisive progress towards meeting the UN Sustainable Development Goal 7 could explain this result? Several reasons can be considered.
Expanded energy access: we do not think that is the main reason for the result. The grid did not expand that fast. A systematic survey error may be present, but according to the survey documentation, the wording of the question was exactly the same in 2010, 2012, 2014.
Energy-using expectations and behaviors are known to adjust. Would it be that households were more able to meet their needs with what was provided? We believe this effect may rather play in the opposite direction, given that the equipment levels increased. Regarding the demand for electricity by households, (General Statistical Office, 2015, 26) stated that:
The percentage of households with fixed and/or mobile telephones reached 85%, the rate of households using a computer was 25.1%, the rate of households using a washing machine reached 30.9% and the rate of households using refrigerators was 59.0%. All of these were at least twice times higher than the indicators in the 2009 Census. In addition, the rate of households using air conditioning stood at 13.3%, nearly three times higher
than the rate in the 2009 Census.
We cannot rule out that physiological needs decreased. Energy demand is known to be sensitive to weather, which is random. It is conceivable that the 2010 heatwave could have led to exceptionally high cooling needs and shortages due to low flows to hydropower stations. Further research is necessary to assess this effect in Vietnam, and to compare the 2014 heatwave to previous ones.
We conjecture that another reason for increasing satisfaction levels between 2010 is that the reliability of electricity supply increased. We cannot verify this conjecture statistically
here, but in 2010 there were many shortages due to delays in adding new coal power plants. After that year reserve generation capacity and therefore reliability improved. According to EVN 2016 annual reports, System Average Interruption Duration Index (SAIDI) went from 8077 minutes per customer in in 2012 (earliest year available), to 3134 minutes in 2014 and 2281 minutes in 2015. Numbers for 2010 are not available.
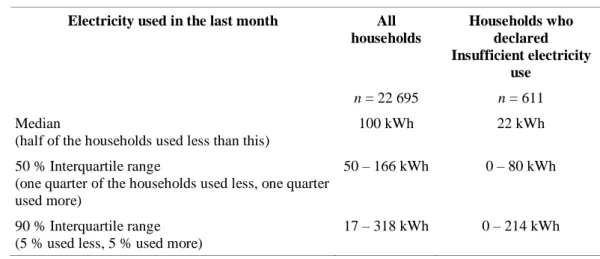
Are the households who declared that their electricity usage did not meet their needs counted with the objective energy poverty indicators discussed in the two previous sections? First, consider the ‘energy poverty bar’ idea based on the quantity of electricity used. Table shows that in 2014, the electricity consumption of households with unsatisfied tend to be lower than in the rest of the population:
In 2014, half of the households in Vietnam who declared insufficient electricity used less than 22 kWh per month.
What is the amount in basic needs terms? The energy quantity 22 kWh divided by 30 days amounts to 733 Wh per day. This is largely enough to charge many telephones, since a phone battery contains about 5 Wh. It is also enough for lightning, as a modern efficient light bulb about 10W and it is used a few hours per day. A TV and fans can also fit in this energy budget. However, it does not go beyond into modern comfort appliances. This amount of energy is not enough to run an air conditioning unit, refrigerator, electric cooking or heating.
While households who declared that their electricity usage did not meet their needs tend to use little electricity (in 2014), the converse is not true. In our sample, among the households who used less than 22 kWh of electricity, most did not declar e their needs unsatisfied (see Supplementary Figure). Using small quantities of electricity can satisfy needs, if they are modest. This shows that the absolute amount of energy used is not a sufficient indicator to determine satisfaction. It is the perceived comparison of the energy used with the needs of the household that determine sufficiency.
Second, consider ‘high cost’ ideas based on the share of income devoted to electricity. As mentioned previous, in 2014; about 6% of households had ‘high costs’ of electricity,
defined as over 6% of their income. Keeping only the ‘low income’ households, there is less than 1% of the population in the ‘Low income High cost’ energy poverty situation. Survey results show very small overlap between that population and the households declaring than their needs were not met (see Supplementary Figure). This shows, again, that the share of income devoted to energy is not a sufficient indicator to determine satisfaction. (Vignon, 2014) also found a low correlation between objective and subjective energy poverty indicators. More specifically, in France, only 20% of the households spending more than 10% of their income on energy also declare suffering from cold. More investigation seems needed to better understand these effects, which also depend on the effectiveness of existing subsidies (see Supplementary Figure).
Figure 4: Satisfaction levels progress.
The share of households declaring their electricity consumption was not sufficient to meet their needs in the previous month decreased rapidly between 2010 and 2012.
Table 2 : Satisfaction with the electricity consumption.
Source : Question ‘Has your household’s consumption of electricity over the last 30 years been sufficient to meet its needs ?’ , Vietnam Intercensal Population and Housing Survey (2010, 2012, 2014).
Survey year 2010 2012 2014
n = 9 261 n = 9 242 n = 22 695
Not sufficient 24.4 % 4.8 % 2.7 %
Sufficient 72.6 % 89.6 % 91.7 %
Table 3 : Quantity of electric energy used a month.
Source : Vietnam Intercensal Population and Housing Survey (2014)
Electricity used in the last month All households Households who declared Insufficient electricity use n = 22 695 n = 611 Median
(half of the households used less than this)
100 kWh 22 kWh
50 % Interquartile range
(one quarter of the households used less, one quarter used more)
50 – 166 kWh 0 – 80 kWh
90 % Interquartile range (5 % used less, 5 % used more)
17 – 318 kWh 0 – 214 kWh
5 Discussion: Key Performance Indicators and future
challenges
Based on our survey data, Table summarizes the three previous sections in key performance indicators to monitor progress towards the sustainable development goal SDG7 related to access to clean, reliable and affordable energy for all. Indicators are reported in the “minimize” direction.
The first row directly refers to the KPI #51 (see section 2). For now, the problem of providing access to clean energy for all is largely solved. The fraction of households without access to electricity is one to two percent. This represents in the order of a million people, in areas where extending the grid is technically and economically difficult. The future may involve more decentralized electricity supply in these areas.
The second row is about satisfaction, the share of households stating that their electricity needs were not met. The perceived sufficiency of supply relates to the ‘reliable’ dimension of the SDG7.
These two indicators show success on the basic level of the sustainable development goal. Two essential engineering challenges have been solved: access to grid –as apparent from the first row– and generation capacity to satisfy demand –as apparent from
the second. In one generation, most Vietnamese families are experiencing the transition from using decentralized, traditional energy to using modern fossil fuels and electricity grid power from centralized production sources.
The third row is the share of households below an electricity poverty line. This is a classic indicator. The literature offers many diverging approaches about where is the line. In the table we set the electricity poverty line at 30 kWh. There are three reasons to choose this number in Vietnam. First, it is the amount subsidized in official policies. Second, it is close to intercept when we regress the electricity consumption on income. Third, it corresponds to 1 000 kWh per day, which is a round number easy to reason with by stakeholders and researchers alike.
That third row shows that more than 10% of the population is still on the first step of the energy ladder –with less than 1 000 kWh per day, one can hardly use a refrigerator or air conditioning. This fraction is declining. This is consistent with the lower middle-income status of the economy.
The fourth row is the share of households spending less than 6 % of income on electricity. This is also a classic indicator discussed above, related to affordability. We set the threshold at 6% for several reasons. a) Our statistic is for electricity only, excluding fuels for heating and transportation. b) The low number of answers in Vietnam at 10 % implies that relative measurement error is larger. c) For these reasons, we believe that 10 % threshold, commonly used in the literature discussed section 2, is not the appropriate criteria here. d) The shape of the tail of the distribution is regular, so the value of the threshold is does not matter much to assess progress. It does not matter is we look at a 4%, 6% or 8% threshold: the burden is increasing, fast.
That fourth row shows that electricity is affordable for most households in Vietnam. The improvement between 2008 and 2010 coincide with a period where the electricity tariff increased slower than the inflation. The degradation after 2010 show that electricity expenses have increased faster than income. One part of this is a price effect, the first block catching up with the general level of prices, and another part is a quantity effect, with demand for electricity increasing.
In 2014 almost all households in Vietnam had access to affordable and reliable electricity, but one KPI is not moving in the socially ideal direction. There are challenges ahead. As apparent in Table, the population growth rate is about one percent per year, and the economic growth rate six percent, the urbanization gains 0.7 percentage point per year. The average size of household is also decreasing, as the traditional family model with three generations under one roof is losing ground. These factors imply a continued growth in the demand for electricity services. This growth has to be met by increase in energy efficiency and increase in energy generation, transmission and delivery capacity. This is challenging as the level of public debt is getting near the limits defined by the parliament, and the electricity generating companies are also deeply in debt. The domestic production of coal has peaked and since 2016 is too low to feed all power plants. Raising further the price of electricity is necessary to pay the price of imported coal, to finance investments in capital-intensive solar and wind power plants, to reinforce the grid and to make it smarter.
There is no space to discuss here all these challenges in detail, but household-level statistics allow to examine the distributional consequences of an increase of retail electricity tariffs accompanied by a change in subsidies mechanism.
More precisely, we demonstrate here that it is possible to reform the electricity tariff to achieve at the same time two seemingly opposite goals: increase the total sales revenue and improve the welfare of those who remain energy poor. The key to this is making the tariff more progressive. We will compare the tariff effectively paid by consumers –called “EVN 2013” in what follows– with a more progressive tariff, for the month of March 2014.
The tariff reform question is politically important as of 2017 (Nguyen Quoc Khanh, 2012; Koos Keefjes, Michaela Prokop, and Pham Thi Lien Phuong, 2014). A complete discussion would require working with many months from observed rather than declared data, considering differences in household composition, making forward looking projections for demand and macroeconomic considerations on inflation. More modestly, we discuss and illustrate (see Figure Illustration, top panel, blue curve) a more progressive tariff in four blocks based on these principles:
A) The first block ensures universal access for basic needs, for free.
B) The top block is incitative. The marginal cost of electricity is set high, so that households who can conserve energy and invest in domestic production such as solar PV do so.
C) The second and third blocks are where the majority of households lie. Tariff is based on electricity production costs. The distinction between the two blocks is about the way solidarity goes. A household at the frontier between blocks two and three pays exactly its electricity production cost. Consequently, those in the third block and above are subsidizing those in the first two blocks.
The primary justification for A) is that the existing subsidy mechanism does not work well. In the 2014 survey, the households receiving the subsidy were only: 20% of households declaring that their electricity use did not meet their needs; 8.8% of households those bills was over 6% of their income, and 37% of households using less than 30 kWh in the last month (see Supplementary Figure, bottom). Many eligible households do not claim the subvention because given their socio-economic conditions, the time and other administrative costs to claim it are large relative to the amount of the subvention – worth about 2 dollars per month. Others may not know the existence of the subvention.
Extending the subsidy all households, regardless of their income or power consumption level, eliminates that administrative cost. Moreover, making the first block free has an ethical basis on universal access to basic needs, and is a political carrot to offset the increase of marginal costs stick.
The first block is 30 kWh in our example. Currently, the first block limit is 50 kWh, but the current subsidy is only for 30 kWh of electricity. A smaller first block minimizes the cost of the measure to EVN. And as discussed previously, this number corresponds to basic needs viewed technically as phone charging, lightning and fan. It also corresponds to the basic needs viewed econometrically (eq. 1) as the intercept of the power consumption / income regression line.
The last block starts at 300 kWh in our example. This aims the incitative tariff at the top 6% of electricity consuming households in March 2014. The EVN 2013 tariff distinguishes between a [300 kWh, 400 kWh] and a >400 kWh. In 15 years, the relative difference between the tariff of those two blocks never exceeded 3.4%. Regarding income, it makes little difference to merge them into a single “over 250 kWh”. Regarding political aspects of the tariff reform, more simplicity and dropping the top block makes a difference. Alternatively, defining the last block at >250 kWh would target the top 10% electricity using households in 2014.
We set this upper block tariff to 3500 VND/kWh, a marginal electricity cost of about 15 US cents/kWh. In the power system of tomorrow, so-called the Smart Grid, a critical mass of households will have become energy prosumers, and take an active part in providing energy and services to the electric network. A high electricity tariff alone is not sufficient to ensure that households take action, but it is more than a small nudge in the right direction. Numbers for this block are meant to shock and awe in proportion to the urgency of the climate change issue.
Having thus defined the first and last blocks, we turn to the middle blocks. In our example, we define the difference between the second and third blocks so that it defines the direction of solidarity. Households in the second block pays electricity at less than production costs, while those in the third block pay at more than cost. This requires defining the limit and tariff of the second block at the same time. If we keep to the round block limits used so far in Vietnam, there are two options, 100 kWh per month and 150 kWh per month.
• Setting the block limit at 100 kWh with a tariff of 2200 VND/kWh would ensure that the average cost of electricity to a household consuming 100 kWh per month, with the first 30 kWh for free, equals the EVN production cost which was 1540 VND/kWh in 2014 according to (EVN 2016). This divides the burden roughly 50/50 in numbers of households: half would pay less than the average production cost, and half pay more.
• Setting the block limit at 150 kWh with a tariff of 1925 VND/kWh ensures that the average cost of electricity to a household consuming 150 kWh per month, with the first 30 kWh for free, equals 1540 VND/kWh. This divides the households 70/30. This is the option used in our example.
According to VHLSS data the median annual income in 2014 was 81 million VND. According to (eq. 1) this corresponds to a monthly consumption of 108.5 kWh. With our option choice, the household with median income level falls in the second block, paying less than production cost.
The EVN 2013 tariff had a [50-100 kWh] block at the 1418 VND/kWh tariff, and a [100-150 kWh] block at the 1622 VND/kWh. For both options, the marginal electricity cost will increase. Accounting for the free 30 kWh, in the first option the households using less than 50 kWh would still come ahead under the more progressive tariff. As seen above this is a quarter of the household numbers. In the second option, households using up to 80.8 kWh benefit from the more progressive tariff.
We set the tariff for the third block at 2500 VND/kWh. This is purely illustrative. Total revenue generated would be some important criteria for this number.
Figure Illustration compares the two tariffs: EVN 2013 and the more progressive one defined above. In terms of total cost of electricity, they are very close up to 150 kWh. We re-estimated the monthly bill of each household in the sample under the more progressive tariff.
On the one side, we found that:
• The share of households with a zero-electricity bill increases from 2.2% to 6.5%. The majority were not previously subsidized (see Supplementary Figure)
• Any household which were previously directly subsidized, do not lose their previous benefit, they access 30 kWh for free as every other household.
• The bill decreases for 28.3% of households, at most by -29.6 kVND.
On the other side, we found that the total revenue to EVN increases by 15%. This is because the average bill increases 15% from 199.9 kVND to 229.1 kVND, that is 29.2 kVND. Moreover:
• For 50% of households, the bill increases over 19.7 kVND
• For 5% of households, the bill increases over 83.6 kVND
• For 1% of households, the bill increases over 301.7 kVND, with a maximum increase of 1374.0 kVND
Supplementary tables Supplementary Table and Supplementary Table provide more detailed results on the impacts on energy poverty of using the more detailed tariff, using different definitions of energy poverty. It stands out that the reform negatively impacts the households who already have a high cost of electricity, i.e. those who pay more than 6% of their income on the electricity bill. For example, the progressive tariff pushes 2.7% of the households in the high cost condition, while it lifts only 0.3% out of it.
But as shown in the theoretical literature discussed section 2, the high cost condition does not mean energy poverty. That criteria do not account for absolute wealth level, so it conflates rich households who spend a lot on energy services with poor households how cannot afford enough energy services. Our results show that under an energy poverty definition considering both high cost and official poverty status, the redistributive consequences of the tariff reform are not regressive.
6 Conclusion
To sum up, in 2014 almost all households in Vietnam had access to affordable and reliable electricity, in amounts coherent with a middle-income development level:
• In 2014, 97.7 % of households in Vietnam used grid electricity for lighting.
• In 2014, out of four Vietnamese households, one used less than 50 kWh per month, and another between 50 kWh and 100 kWh.
• In 2014, 95 % of Vietnamese households devote less than 6.2 % of income to electricity.
• Between 2010 and 2014, the share of income that Vietnamese households devote to electricity increased by about one third.
• In 2010, one out of four households in Vietnam declared that their electricity use was insufficient to meet their needs. That ratio dropped under 3 % in 2014.
Vietnam now faces the tough problem of financing the transition of a clean energy system. One of the tools available is an increase of the electricity retail tariff to households. We illustrate how that could be done, using self-reported electricity costs and consumption levels from March 2014. The more progressive block tariff increases the revenue for EVN by 15% and at the same time provides free access to 30 kWh basic need per household. Lowering the costs to 28% of the households comes at the expense of increasing them for the 72% others. But we argue that high marginal electricity cost to the highest consumers is a useful signal in the context of clean development.
Our theoretical contribution to debates on energy poverty is to account for the human dimension by using a self-reported satisfaction indicator. We have demonstrated that, at least for Vietnam in 2014, objective energy poverty indicators defined from engineering or economic data alone are not sufficient to measure the satisfaction of needs. Our study shows that the subjective energy poverty indicator –designed from surveys asking people
they had enough electricity to meet their households needs– is not subsumed by either the ‘below poverty line’ or the ‘low income high cost’ indicator.
Moreover, the subjective indicator may be easier to measure, and less biased than indicators based on energy companies. In our case for example, the national electricity company did not compute the System Average Interruption Duration Index in 2010. But the subjective satisfaction indicator was available. Only this indicator provides a clear view the development of access to affordable and reliable energy in that period.
7 References
Asian Development Bank. 2011. “Energy for All: Viet Nam’s Success in Increasing Access to Energy through Rural Electrification.” ADB. https://think-asia.org/bitstream/handle/11540/963/rural-electrification-vie.pdf?sequence=1.
Barnes, Douglas F., Shahidur R. Khandker, and Hussain A. Samad. 2011. “Energy Poverty in Rural Bangladesh.” Energy Policy, Special Section on Offshore wind power planning, economics and environment, 39 (2): 894–904. doi:10.1016/j.enpol.2010.11.014.
Chérel, Didier. 2014. “Premier rapport de l’ONPE. Définitions, indicateurs, premiers résultats et recommandations.” Rapport de synthèse. Observatoire National de la
Précarité Energétique.
http://onpe.org/sites/default/files/pdf/documents/rapports_onpe/onpe1errapportsynthese.p df.
Doan Van Binh. 2010. “Vietnam Rural Electrification Programme.” http://energy-access.gnesd.org/cases/34-vietnam-rural-electrification-programme.html.
EVN. 2015. “Vietnam Electricity Annual Report 2015.” Vietnam Electricity. http://www.evn.com.vn.
———. 2016. “Announcement of EVN Electricity Production Cost of 2014.” February 2. http://en.evn.com.vn/d6/news/Announcement-of-EVN-electricity-production-cost-of-2014-66-163-37.aspx.
Foster, Vivien, Jean-Philippe Tre, and Quentin Wodon. 2000. “Energy Prices, Energy Efficiency, and Fuel Poverty.” Unpublished Paper. Latin America and Caribbean Regional
Studies Program, Washington, DC: The World Bank.
http://www.mediaterre.org/docactu,bWF4aW0vZG9jcy9wZTE=,1.pdf.
General Statistical Office. 2015. “The 1/4/2014 Viet Nam Intercensal Population and Housing Survey: Major Findings.” Vietnam: Ministry of Planning and Investment.
He, Xiaoping, and David Reiner. 2016. “Electricity Demand and Basic Needs: Empirical
Evidence from China’s Households.” Energy Policy 90: 212–221.
doi:10.1016/j.enpol.2015.12.033.
Hills, John. 2012. “Getting the Measure of Fuel Poverty: Final Report of the Fuel Poverty Review.” CASE report 72. Center for Analysis of Social Exclusion. http://eprints.lse.ac.uk/43153.
Kasprzyk, Daniel. 2005. “Measurement Error in Household Surveys: Sources and Measurement.” In Household Sample Surveys in Developing and Transition Countries. New York: United Nations Publications.
Koos Keefjes, Michaela Prokop, and Pham Thi Lien Phuong. 2014. “Green Growth and Fossil Fuel Fiscal Policies in Viet Nam - Recommendations on a Roadmap for Policy Reform.” Ha Noi, Viet Nam: UNDP.
http://www.vn.undp.org/content/vietnam/en/home/library/environment_climate/green_grow th_and_fossil_fuel_fiscal_policies_in_viet_nam.html.
Li, Kang, Su-Yan Pan, and Yi-Ming Wei. 2015. “A Bibliometric Analysis of Energy Poverty Research: Results from SCI-E/SSCI Databases.” International Journal of Global Energy Issues 38 (4–6): 357–72. doi:10.1504/IJGEI.2015.070263.
Nguyen, Minh Phong. 2010. “Preventing Power Tariffs From Stoking Inflation.” The Saigon Times, February 25. http://english.thesaigontimes.vn/8896/Preventing-Power-Tariffs-From-Stoking-Inflation.html.
Nguyen Quoc Khanh. 2012. “Study on the Impacts of Electricity Tariff Increase on the National Economy of Vietnam.” In Energy Market Integration in East Asia: Theories, Electricity Sector and Subsidies, ERIA Research Project Report 2011-17, 253–67. Chapter 10. Jakarta: ERIA.
Nussbaumer, Patrick, Morgan Bazilian, and Vijay Modi. 2012. “Measuring Energy Poverty: Focusing on What Matters.” Renewable and Sustainable Energy Reviews 16 (1): 231–43. doi:10.1016/j.rser.2011.07.150.
Observatoire National de la Précarité Energétique. 2016. “Caractériser le phénomène et le mesurer.” http://www.onpe.org/definition_indicateurs/definition_des_indicateurs.
Pachauri, S., A. Mueller, A. Kemmler, and D. Spreng. 2004. “On Measuring Energy Poverty in Indian Households.” World Development 32 (12): 2083–2104. doi:10.1016/j.worlddev.2004.08.005.
SDSN. 2015. “Indicators and a Monitoring Framework for the Sustainable Development Goals.” Draft 7. Leadership Council of the Sustainable Development Solutions Network. http://unsdsn.org/wp-content/uploads/2014/05/140522-SDSN-Indicator-Report.pdf.
Solidiance. 2015. “Vietnam’s Power Sector. Opening the Way towards a Greener Future?” Solidiance. http://www.solidiance.com/whitepaper/vietnams-power-sector.pdf.
Sovacool, Benjamin K., Ishani Mukherjee, Ira Martina Drupady, and Anthony L. D’Agostino. 2011. “Evaluating Energy Security Performance from 1990 to 2010 for Eighteen Countries.” Energy 36 (10): 5846–53. doi:10.1016/j.energy.2011.08.040.
TN News. 2012. “Vietnam to Raise Power Prices from July 1 after Inflation Slows.” Thanh Nien Daily. June 30. http://www.thanhniennews.com/business/vietnam-to-raise-power-prices-from-july-1-after-inflation-slows-6608.html.
Vignon, Jérome. 2014. “Premier Rapport de l’ONPE: Définitions et Indicateurs.” Les Notes de l’ONPE - Observatoire National de La Précarité Energétique, December 10.
8 Supplementary material
Supplementary Table 1: Winners and loosers with the more progressive tariff according to
different energy povety criteria.
‘Lack electricity’ defined according to answer to the question ‘Did the consumption of electricity of your household meet your needs’
‘Officially poor’ defined according to answer to the question ‘1. Have the local authorities classified your household as 'poor' ...?’
'Low income' defined as reported household income per capita per month lower than 400 kVND in rural area, 500 kVND in urban areas (official definition in 09-2011/QD-TTg)
'High costs' defined as declaring an electricity bill last month > 6% annual income / 12
Household category Winners Indifferent Loosers # households
Paid for <30kWh 990 (4.3%) 513 (2.2%) 0 (0.0%) 1503 (6.5%) Using <30kWh 2461 (10.7%) 512 (2.2%) 58 (0.3%) 3031 (13.2%) Lack electricity 160 (0.7%) 253 (1.1%) 198 (0.9%) 611 (2.7%) Officially poor 1587 (6.9%) 282 (1.2%) 467 (2.0%) 2336 (10.2%) Low income 437 (1.9%) 115 (0.5%) 95 (0.4%) 647 (2.8%) High cost 168 (0.7%) 0 (0.0%) 1233 (5.4%) 1401 (6.1%)
High cost & officialy poor 81 (0.4%) 0 (0.0%) 80 (0.3%) 161 (0.7%)
High cost & low income 58 (0.3%) 0 (0.0%) 63 (0.3%) 121 (0.5%)
Supplementary Table 2: Households with high costs under the EVN 2013 (ex ante) and the more
progressive tariff (ex post)
Supplementary Figure 1: Monthly electricity use as a function of annual income
All respondents Officially poor Low income
Never high cost 20956 (45.6%) 2149 (4.7%) 520 (1.1%)
High cost with both tariffs 1323 (2.9%) 118 (0.3%) 90 (0.2%)
High cost only ex ante 78 (0.2%) 43 (0.1%) 31 (0.1%)
High cost only ex post 640 (1.4%) 26 (0.1%) 6 (0.0%)
Supplementary Figure 2: How a block tariff works Electricity used (kWh) 50 100 Electricity price (VND per kWh) 1484 1533 1786 130 Example :
a household uses 130 kWh in month
its bill is 204 430 VND = 1 484 * 50 + 1 533 * 50 + 1 786 * 30 74 200 VND 76 650 VND 53 580 VND 0
Supplementary Figure 7: Different energy poverty criteria are weakly correlated
Acknowledgements
NHS provided the initial idea and the data, HDM directed the research. The two authors contributed to the statistical analysis and writing this manuscript. We gratefully acknowledge comments from our colleagues Audrey Berry, Franck Nadaud, Nguyen Trinh Hoang Anh. The authors declare no conflict of interest. This research did not receive any specific grant from funding agencies in the public, commercial, or not-for-profit sectors.