ANALYSIS AND OPTIMIZATION OF A NEW ACCIDENT TOLERANT FUEL CALLED FUEL-IN-FIBERS
By Briana Hiscox
B.S., Mechanical Engineering (2015) University of Connecticut
SUBMITTED TO THE
DEPARTMENT OF NUCLEAR SCIENCE AND ENGINEERING
IN PARTIAL FULFILLMENT OF THE REQUIREMENTS FOR THE DEGREE OF MASTER OF SCIENCE IN NUCLEAR SCIENCE AND ENGINEERING
AT THE
MASSACHUSETTS INSTITUTE OF TECHNOLOGY February 2018
© 2018 Massachusetts Institute of Technology All rights reserved.
Signature of Author: ______________________ Briana Diane Hiscox Department of Nuclear Science and Engineering
01/26/2018 Certified by: ___________________________________________________________________
Koroush Shirvan Assistant Professor of Nuclear Engineering Thesis Supervisor Certified by: ___________________________________________________________________
Kord Smith KEPCO Professor of the Practice of Nuclear Science and Engineering Thesis Reader Accepted by: __________________________________________________________________
Ju Li Battelle Energy Alliance Professor of Nuclear Science and Engineering and Professor of Materials Science and Engineering
3
Analysis and Optimization of a New Accident Tolerant Fuel Called Fuel-in-Fibers by
Briana Hiscox
Submitted to the Department of Nuclear Science and Engineering on January 24, 2018 in partial fulfillment of the requirements for the
Degree of Master of Science in Nuclear Science and Engineering
ABSTRACT
The 2011 Fukushima Daiichi accident highlighted the weakness of the current nuclear fuel and motivated R&D of accident tolerant fuels. Accident tolerant fuels (ATF) are fuels that can tolerate loss of active cooling in the core of light water reactors (LWRs) for a considerably longer period of time while maintaining or improving the fuel performance during normal operations. Fully Ceramic Microencapsulated (FCM) fuel is an ATF concept aimed at significantly increasing the fission product retention capability of nuclear fuel at high temperatures. The FCM concept is made up of fuel particles surrounded by multilayers of ceramic material similar to the TRISO fuel concept. The fuel particles are embedded in a SiC matrix in cylindrical pellet geometry which gives the fuel its high temperature corrosion resistance. However, when implementing the FCM concept in a conventional PWR fuel geometry, it is not possible to maintain an 18 month fuel cycle length and remain below the proliferation enrichment limit of 20 w/o U235. This is a critical challenge that needs to be overcome in order to benefit from the high temperature fission product retention capability of FCM-type ATF concepts.
Therefore, this work aims at investigating the potential benefits of a new accident tolerant fuel, Fuel-in-Fibers (F-in-F) concept. The Fuel-in-Fibers concept was created by Free Form Fibers, a laser chemical vapor deposition direct manufacturing company. It aims to combine the same robust fission product retention and high temperature stability as the FCM fuel concept while drastically decreasing the necessary fuel enrichment. This is done by designing a fuel fiber in cylindrical geometry as opposed to spherical particles to increase the packing fraction within a cylindrical pellet. The direct manufacturing allows for minimization of the volume occupied by the SiC matrix as well as direct deposition of high density fuels like uranium nitride (UN).
Assembly level calculations in the Monte Carlo code SERPENT determined that the Fuel-in-Fibers concept could maintain a typical PWR cycle length with less than 20 w/o U235 (LEU) enrichment. The fibers in the fuel pellet were then homogenized for use in lattice physics code CASMO and core simulator code SIMULATE3. The SIMUALTE full core simulation showed that the Fuel-in-Fibers design required enrichments of 8% and 6% for UO2 and UN as fuels, respectively. Overall, the full core analysis of a standard 4-loop Westinghouse PWR showed Fuel-in-Fibers concept has similar behavior as the conventional fuel. Due to the high fissile enrichments, the calculated radial power peaking factors were higher in Fuel-in-Fibers concept. This may result in decrease of the coolant outlet temperature by 5 K in order to maintain safety margins. The shutdown margin analysis showed that using B4C instead AgInCd control rods is needed.
4
A design optimization was also performed to calculate the ideal geometry for Fuel-in-Fibers concept. An in-house MATLAB single channel code, built to evaluate PWR Thermal Hydraulic and Structural performance, was used to vary the fuel pin Pitch and Pitch-to-Diameter ratio (P/D Ratio). The results showed that a smaller pitch and larger diameter of 13.2 mm and 12 mm, respectively will improve the Fuel-in-Fibers concept enrichment requirements. A simplified economic analysis based on highly uncertain fabrication cost estimates was performed. The economics analysis determined that the fuel in fiber design is estimated to cost more than current UO2 fuel by 1.25x – 15x due to the increased enrichment and fabrication costs but may be offset by the additional safety margins provided by the Fuel-in-Fibers concept.
Thesis Supervisor: Koroush Shirvan
5
Acknowledgments
The funding for this work was provided by DOE SBIR Phase II subcontract DE-SC0011954 from Free Form Fiber Company, the developer of the Fuel-in-Fibers concept. The design and simulation work presented in this report was guided by fiber manufacturing constraints obtained through discussion with Joe Pegna of Free Form Fiber Co. I am very thankful to Free-Form-Fibers for funding my research. My research has also been funded by the Presidential Fellowship.
I would like to sincerely thank my advisor Koroush Shirvan. I have learned a great amount about nuclear simulations and good research practices from him. Koroush and his tireless work ethic has supported me and my research when needed -- no matter the time.
Others at MIT who have helped me to reach this point include Kord Smith, Mike Short, Marina Dang, Heather Barry, Lisa Magnano-Bleheen and the members of my research group, especially my officemate Yanin Sukjai.
I would like to thank Professor James Sherrard for teaching me in the beginning of my nuclear engineering career and encouraging me to continue on to MIT.
Thanks also to my roommates Aliaa and Devika for being understanding of me taking over the kitchen table with my papers when one of my many deadlines came looming.
I would also like to extend my gratitude to my nuclear engineering friends who have supported me throughout my years here. My peers at other schools- Louis Chapdelaine, Dylan Prévost, and Joseph Fustero for giving me perspective, and to the members of the “Manhattan Project” for your support every single day. Thanks as well to Guillaume for being a great running partner. And last but not least my parents. I would not be the person I am today without you.
6
Table of Contents
ABSTRACT ... 3 Acknowledgments ... 5 List of Tables ... 10 Introduction ... 11 II. Background ... 13 II.I Silicon Carbide Cladding ... 13 II.II Fully Ceramic Microencapsulated fuel ... 15 II.III High Density fuels ... 16 III. Design Analysis Codes ... 17 III.I Serpent ... 17 III.II SERPENT Benchmark ... 17 III.III CASMO4e ... 18 III.IV SIMULATE3 ... 19 III.V SIMULATE terminology ... 19 III.VI Single channel in-house MATLAB code ... 20 IV. Reference PWR Core ... 23 IV.I Reference PWR background ... 23 IV.II PWR Core Design ... 24 IV.III Power Peaking Factors ... 26 V. Design Methodology ... 28 V.I FFF Additive Manufacturing Technology ... 28 V. II Specifics of the fibers and design constraints ... 29 VI. Fuel-in-Fiber Design Study ... 31 VI.I Design Constraints and Smearing ... 31 VI.II Optimization of Fuel Pin Design ... 32 VI.III Neutron Spectra ... 37 VII. Core Design and Safety Assessment ... 38 VII.I SERPENT and CASMO assembly comparison ... 38 VII.II Fuel-in-Fiber Core ... 40 VII.III Assembly optimization ... 41 VII.IV Fuel-in-Fibers UO2 Assemblies ... 427 VII.V Fuel-in-Fibers UO2 Core results ... 44 VII.VI Fuel-in-Fibers vs. Reference Design Safety Performance ... 47 VIII. Fuel Assembly Design Optimization ... 50 IX. Economics Analysis ... 58 Conclusions ... 62
APPPENDIX A: SERPENT input file ... 69
8
List of Figures
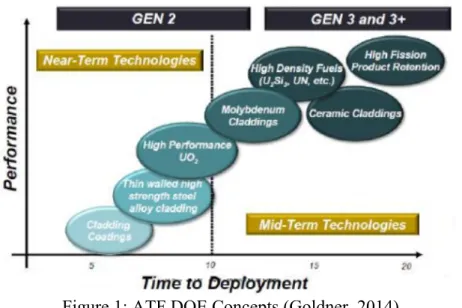
Figure 1: ATF DOE Concepts (Goldner, 2014) ... 12
Figure 2: Comparison of failure behaviors of monolithic and CMC SiC tubing (Carpenter, 2010) ... 14
Figure 3: SiC triplex Cladding side and top view (Carpenter, 2010) ... 14
Figure 4: Kernel and layers of a TRISO particle (Hales, et al., 2013) ... 15
Figure 5: Pin cell case from Brown et. al, and our similar pin cell ... 18
Figure 6: Reference PWR assembly (right) and core loading pattern (left) ... 23
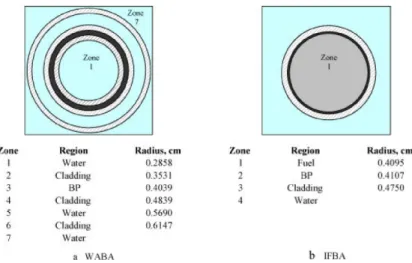
Figure 7: WABA vs IFAB geometry/composition (Li, 2012) ... 25
Figure 8: Typical PWR core radial power distribution ... 26
Figure 9: FFF's implementation of a ceramic fiber laser printing process through three successive magnifications. (Pegna, 2015) ... 28
Figure 10: Design of woven fibers (Pegna, 2015) ... 29
Figure 11: A horizontal and axial cross section of the fiber ... 29
Figure 12: The top view of the Pin cell and the assembly. ... 30
Figure 13: The top view of the Pin cell and the assembly. ... 31
Figure 14: k∞ vs EFPD for varying fiber pitches ... 33
Figure 15: k∞ vs EFPD for Varying Fuels ... 34
Figure 16: k∞ vs EFPD for Varying w/o Enrichments of UO2 ... 34
Figure 17: k∞ vs Burnup for the Reference PWR and the 11.5% UO2 F-in-F case ... 35
Figure 18: k∞ vs EFPD for Varying w/o Enrichments of UN ... 36
Figure 19: Neutron spectra for the Fuel-in-Fibers and Reference PWR ... 37
Figure 20: A cross section view of a heterogeneous and a homogeneous pincell ... 38
Figure 21: Serpent Homogenous and Heterogeneous fuel geometry and error ... 39
Figure 22: A comparison of SERPENT and CASMO4e for a Regular PWR ... 39
Figure 23: SERPENT and CASMO pin comparison ... 40
9
Figure 25: k_inf for top two reference assemblies and top two Fuel-in-Fibers assemblies
un-normalized burnup ... 42
Figure 26: K_inf for top two reference assemblies and top two Fuel-in-Fibers assemblies normalized cycle length by fuel mass ... 42
Figure 27: k∞ for top 2 reference assemblies and top two Fuel-in-Fibers assemblies normalized by cycle length ... 43
Figure 28: Plots of U235 wt% and total Pu wt% with MWD Normalized ... 43
Figure 29: The average boron concentration in the Reference and Fuel-in-Fibers cores ... 44
Figure 30: Core radial assembly peaking factor for Reference and Fuel-in-Fibers ... 45
Figure 31: Axial peaking factor for Reference and Fuel-in-Fibers at BOC, MOC and EOC ... 45
Figure 32: FΔh for the Reference and Fuel-in-Fibers case ... 46
Figure 33: The fuel mass over a range of geometries for the Fibers-UN (left) and Fuel-in-Fibers -UO2 (right) ... 52
Figure 34: The fuel mass over a range of geometries for the standard PWR assembly ... 52
Figure 35: The H/HM ratio for UN and UO2 over a range of geometries for the F-in-F concept 53 Figure 36: The H/HM ratio for the standard PWR assembly over a range of geometries ... 53
Figure 37: The failure mode for different diameters and pitches ... 54
Figure 38: The fretting wear ratio over a range of geometries ... 54
Figure 39: The core Pressure drop over a range of geometries ... 55
Figure 40: The MDNBR over a range of geometries ... 55
Figure 41: The oxide and nitride fuel centerline temperatures over a range of geometries ... 56
Figure 42: Enriched uranium cost based on UxC fuel cycle calculator ... 59
Figure 43:Uranium enrichment costs per core ... 59
Figure 44: The front-end fuel cycle cost estimates ... 60
Figure 45: Total Front-end Fuel cost per full core ... 61
10
List of Tables
Table 1: Procedure for the shutdown margin calculation ... 20
Table 2: Parameters of the Reference PWR Core ... 24
Table 3: Geometrical Values of the Fiber before and after Smearing ... 32
Table 4: Varied pitches and BOL k with UN ... 33
Table 5: Fuel volume, mass and Uranium mass fraction comparison ... 36
Table 6: Reactivity coefficients of the F-in-F and Reference designs ... 47
Table 7: Shutdown margin (SDM) calculation with AIC for F-in-F and Reference designs ... 48
Table 8: The core kinetic parameters of the Fuel-in-Fibers and Reference designs ... 48
Table 9: Shutdown margin (SDM) calculation for F-in-F with B4C and Reference designs ... 48
Table 10: The core kinetic parameters of the F-in-F B4C and Reference designs ... 49
Table 11: Parameters changed in the MATLAB code ... 51
Table 12: Operational variable and limits for the optimization study ... 51
11
Introduction
Prior to the Fukushima Daiichi accident, nuclear fuels research was focused on increasing burnup (to minimize waste), and increasing power density (for power uprates) (Bragg-Sitton et al., 2015). After the accident, the fuel R&D focused on fuels and claddings that are more accident tolerant under severe accident conditions. This new fuels focus is called accident tolerant fuels and according to Department of Energy (DOE) (Goldner, 2014), is defined as fuels that, in comparison with the standard UO2 – Zr system, can tolerate loss of active cooling in the core for a considerably longer time period (depending on the LWR system and accident scenario) while maintaining or improving the fuel performance during normal operations. These improved properties are mainly focused on reducing the oxidation rate and hydrogen (or other combustible gases) production at high temperatures because of the hydrogen explosions during the Fukushima Daiichi accident in March of 2011. Other cladding improvements have been aimed at increasing the cladding melting point and its strength at high temperatures compared to current Zircaloy cladding. Improvements to the fuel have also been considered, especially in the areas of better fission gas retention and higher temperature margin to fuel melt.
Figure 1 shows the qualitative performance of many proposed ATF concepts and the expected time to deployment according to DOE (Goldner, 2014). A correlation can be seen between time to deployment and performance of listed concepts. One of the reasons behind ranking concepts such as molybdenum claddings and high-density fuels as mid-term technology is due to lack of experience and sufficient database for behavior of such technologies under LWR operating conditions The presence of strong database and experience for proper verification and validation (V&V) is essential for any successful simulation effort. The new Fuel-in-Fiber concept proposed in this thesis combines several of the mid-term technologies- ceramic claddings, high density fuels, and high fission product retention which means the technology is very different from current fuels and provides unique challenges in its design study.
12
Figure 1: ATF DOE Concepts (Goldner, 2014)
The goal of this work is to determine if an accident tolerant fuel that meets all of the ATF program goals can be designed using the Free Form Fiber technology. This will be done by designing and simulating the behavior of the fuel-in-fiber concept under nuclear reactor operating conditions. The fibers will be within a SiC matrix that will replace what is usually the fuel pellet in a regular light water reactor cylindrical fuel pin. This design will hopefully combine the same robust fission product retention and high temperature stability as the Fully Ceramic Microencapsulated fuel (FCM fuel) (Brown et al., 2013) while decreasing the necessary fuel enrichment to LEU levels.
13
II. Background
The Fuel-in-Fiber concept combines several of the mid-term technologies- ceramic claddings, high fission product retention, and high density fuels. Ceramic claddings, in this case silicon carbide claddings, do not have the undesirable oxidation effects of Zircaloy when they come in contact with high temperature steam. Fully Ceramic Microencapsulated fuel (FCM) provides high fission product retention capability as an accident tolerant fuel. High density fuels are good for economics because they can lower enrichment requirements given the same fuel geometry or allow for power uprates by maintaining fuel enrichment to less than 5%, the current fuel enrichment licensed limit.
II.I Silicon Carbide Cladding
As seen in Figure 1 the term ATF refers to several different concepts. The concepts with the shortest time to deployment are claddings and coatings. The coatings involve applying a thin coatings (less than 30 µm) to the current Zircaloy cladding with a highly corrosion resistant material such as metallic Chromium (Brachet et al., 2017). The cladding involves replacing the Zircaloy material with silicon carbide or steel-based material such as Iron-Chromium-Aluminum alloys (FeCrAl). Silicon carbide (SiC) is a promising replacement cladding material. SiC
cladding has the benefits of being stable at high temperature and at high levels of neutron flux. SiC also has a good thermal conductivity, less neutron absorption than Zircaloy(Carpenter, 2011), good high temperature corrosion resistance (Guenoun, 2016), increased fission product retention, and high temperature oxidation resistance (Avincola et al., 2016). However, the monolithic SiC material is susceptible to brittle fractures under stresses developed by normal operation and accident conditions (Avincola et al., 2016). The irradiation and corrosion resistance of SiC is also highly dependent on how it is manufactured (Barrett et al., 2012).
A solution to the SiC brittleness problem is to form a Ceramic Matrix Composite (CMC). SiC CMCs are woven fibers of SiC (~10µm diameter) covered with carbon interphase layer embedded in a SiC matrix. CMCs are a well-established technology, used in particular by the aerospace industry (Kiser et al., 2005), but they have also been examined for use in fusion applications. They have improved fracture toughness, improved resistance to cracking, and retain the high temperature and irradiation stability of monolithic SiC. Many tests have been done to prove that SiC CMCs significantly alleviate the structural issues with brittleness while preserving its chemical and irradiation stability(Lee, 2013). There is an interface layer between the fibers and the matrix that allow them to slide under stress/ strain. Following the fiber sliding, microcracks are formed leading to fiber breakup. Thus, the CMC failure can be classified as plastic (Guenoun,
14
2016) and fails at three orders of magnitude more strain compared to monolithic SiC, and they do not break into pieces when they do fail. This failure mechanism by CMC avoids the catastrophic brittle fracture of monolithic SiC material (Figure 2).
Figure 2: Comparison of failure behaviors of monolithic and CMC SiC tubing (Carpenter, 2010) In order to optimize the cladding a combination of SiC/SiC CMC’s and monolithic SiC must be used. The most common SiC cladding design in the nuclear industry (Guenoun, 2016) is called SiC ceramic Triplex cladding (Figure 3) and is made up of three layers. The inner monolithic SiC layer, the middle SiC CMC layer, and the outer layer of SiC (Figure 3). The inside layer helps retain fission gasses (Barrett et al., 2012) the middle CMC layer helps to resist brittle failure/provide a graceful failure in accident conditions/provide strength and the outer layer provides an environmental/corrosion barrier (Feinroth et al., 2009). An alternative design, where a CMC layer is followed by an external layer of monolithic SiC reduces tensile strength in the cladding according to (Stone et al., 2015). The monolithic SiC layer also ensures the strength, fission product retention, and corrosion resistance of the cladding.
Figure 3: SiC triplex Cladding side and top view (Carpenter, 2010)
The Triplex design fabricated by Ceramic Tubular Products has been irradiated inside the MIT reactor and tested at Oak Ridge National Lab (ORNL) (Feinroth et al., 2009). This study found that the triplex idea is impermeable to fission gases during normal reactor operation,
15
maintains coolability during severe accidents, and has a ~30% higher flexural strength than monolithic SiC. More information about the triplex concept has been collected by researchers at INL (Barrett et al., 2012) and (Bragg-Sitton et al., 2015) who found that SiC cladding performed significantly better than normal Zircaoly cladding in a loss of cooling (LOCA) accident. They also found that the SiC/SiC CMC greatly improved the strength of the cladding.
II.II Fully Ceramic Microencapsulated fuel
Another accident tolerant fuel idea that utilizes the properties of Silicon Carbide is Fully Microencapsulted fuel, (FCM). Developed at ORNL (Brown et al., 2013) (Powers et al., 2013) FCM has also been explored for other reactors designs, such as the HTGR (Lu, et al., 2018) and a PWR with different fuel pin pitch and diameter (Shapiro, et al., 2016). FCM focuses on retention of fission products and is based on tristructural-isotropic (TRISO) particles design for high temperature gas reactors. The TRISO particles are packed in a random distribution in a SiC matrix and used to form a fuel pellet, similar in size as a regular LWR fuel pellet. TRISO particles are made of several layers as seen in Figure 4 for enhanced fission product retention and structural stability under high temperatures. In Figure 4 at the center is the fuel kernel (which can be any fuel though is often UO2 or UCO), the next layer is a buffer layer made up of porous PyC which “attenuates fission recoils and provides void volume for gaseous fission products and carbon monoxide” (Minatoa, et al., 2000). The next layer is an IPyC coating layer that helps contain gaseous fission products. The next layer is SiC which provides structural strength and stops the diffusion of metallic fission products. The outside layer, OPyC, protects the SiC layer (Minatoa, et al., 2000). The SiC matrix that the particles are in is dense, radiation resistant, has a high thermal conductivity, and also helps prevent fission product escape in case of fuel defects or failure in one or more of the TRISO layers (Bragg-Sitton, et al., 2014).
Figure 4: Kernel and layers of a TRISO particle (Hales, et al., 2013)
Despite its good fission product retention, due to the manufacturing process the fuel mass in the pellet is small. The current process requires sufficient matrix volume mixed with the TRISO
16
particles such that when the pellet is pressed (hot or cold pressing) the TRISO fuel does not crack. This means that even with a fuel kernel made of 20% enriched UN the cycle length required to meet a three batch 18 month PWR fuel cycle is not achieved (Brown et alt., 2014).
II.III High Density fuels
The last mid-term accident tolerant technology seen in Figure 1 that serves as a background for this work is high density fuels. High density fuels, such as UN [99% Enriched in N15], U3Si2, and UCO have higher densities than UO2 which means that for the same volume they require a lesser fuel enrichment. This is important to new accident tolerant fuel designs that are trying to lessen their fuel enrichment to remain LEU. In addition to enrichment benefits UN also has a higher thermal conductivity than UO2 which would cause the fuel pin’s centerline temperature to
be lower. This makes the fuel more accident resistant because it increases the margin to safety. (Giudicelli, 2017). While some may be worried about the stability of UN because it starts to slowly decompose after 675 C (Chinthaka-Silva et alt., 2009) and conversion into a low density oxide when exposed to high temperature water or steam (Sajdova, 2017). This might happen if the fuel rod leaks in normal operation or in an accident situation. However, several studies have been done to mitigate this risk. (Sajdova, 2017) showed that by doping the UN matrix with a protective component such as chromium or aluminum the stability of the UN fuel when exposed to boiling water was much longer. (Malkki, 2015) showed that the corrosion resistance of UN could be significantly extended by using an additive such as ZrN. In this work, the SiC CMC cladding and the multilayers present for TRISO fuel, is used to mitigate concerns over reaction of UN with high temperature water or steam.
High density fuels also have economic benefits, they can help decrease enrichment costs, increase cycle length (reduced outage frequency provides economic benefits) and help maximize uranium utilization in fuel (Bragg-Sitton et al., 2014) Cycle length analysis (Giudicelli, 2017) show that for the AP1000 power can be increased by 16% by decreasing the core inlet temperature and using 4.3% enriched UN. The economic analysis shows that the 5% increase in fuel cycle costs is much smaller than the generated revenue from the power uprate.
17
III. Design Analysis Codes
In order to analyze to perform the fuel design analysis, several modeling and simulation tools had to be used. This section will explain why the codes were chosen and how they work. The first step in analyzing a new fuel is typically the neutronics performance. The code SERPENT was used to match a benchmark that previously analyzed FCM (Brown et al., 2013). Then the Fuel-in-Fibers concept at the assembly level was simulated in SERPENT. After the assembly level neutronics calculations, the code CASMO4e was used to simulate assemblies with burnable poisons and to generate cross section libraries for the code SIMULATE3. SIMULATE3 was used to study the full core neutronics characteristics and power peaking factors. Afterwards an in-house single channel code was used to investigate the effects of changing the geometry of the pins.
III.I Serpent
It was decided that the best code package to study the assembly level neutronics performance of the fuel-in-fiber concept is SERPENT (Leppänen, 2015). SERPENT was created by Jaakko Leppänen and a group at VTT, the Technical Research Centre of Finland. SERPENT is a continuous-energy Monte Carlo reactor physics code designed for highly detailed burnup calculations. SERPENT tracks the neutrons over their lifetime, where the neutrons can be absorbed, leak out or undergo fission. Based on this information SERPENT can then calculate the multiplication factor (K). K is a parameter that tells determines if the neutron population is growing, constant, or decreasing. The amount that K departures from criticality (e.g. K=1) is called reactivity. In SERPENT, the user defines the geometry and the material properties, including the density, enrichment of the fuel, and amount of energy extraction per unit mass (burnup). SERPENT versions 1.1.18 and 2.1.24 were used for all neutronics calculations. The ENDF/B-7 cross section library was used in all neutronics calculations except for the CASMO4e and SIMULATE code comparisons in Section V.I where ENDF/B-6 was used.
III.II SERPENT Benchmark
Initially, I benchmarked our SERPENT models against FCM concept simulations by Brown et al., 2013. The paper models a different type of fuel geometry called FCM- fully ceramic microencapsulated fuel- which are similar to TRISO particles but larger. The particles are randomly distributed in a SiC matrix at several different packing factors and then the reactivity as a function of burnup is evaluated for each of the different cases. I created several pin cells in
18
SERPENT with the same geometry as in Brown et al., 2013. A comparison of two of these geometries (Brown et al., on the left, ours on the right) is shown in Figure 5 and the resulting Kinf (assuming no leakage) are compared in Table 1. As listed in Table 1, the differences are within the calculated Monte-Carlo 3σ uncertainty of 90 pcm (pcm is units of reactivity: 105ΔK/K) . These cases were run with 10,000 neutrons per cycle and 250 active cycles and 50 inactive cycles.
Table 1. Kinf with different packing fractions.
Packing fraction k_inf Brown k_inf this work pcm difference
.25 1.4393 1.43828 71 .30 1.4715 1.47186 24 .33 1.4866 1.48641 13
Figure 5: Pin cell case from Brown et. al, and our similar pin cell
III.III CASMO4e
While the fuel can be modeled on an assembly level in the neutronics code SERPENT, in order to analyze the fuel in a full core a switch the code CASMO4e must be made. CASMO4e is an industry-standard lattice (assembly) depletion code that has been extensively used and benchmarked for PWR reactor physics applications. Unlike SERPENT which uses Monte Carlo to determine the reactivity as a function of depletion, CASMO4e uses 2D method of characteristics algorithm to solve the neutron transport equation on a fine mesh (resolving multiple azimuthal and radial regions within a pin) for a PWR assembly at any axial level. The primary feature of CASMO4e used in this study is its ability to generate two-group cross section data for a 2D slice of each PWR assembly type, for a range of temperatures, moderator densities, boron concentrations and depletion (burnup) points. It is important to note that CASMO4E has many built-in models, including fuel geometric expansion as a function of burnup and correction factors
19
to ENDFVI cross-sections not modeled in the SERPENT code. Despite such differences, as seen in Section V.I, the homogeneous model of the Fuel-in-Fibers case in CASMO reasonably agrees with the heterogeneous one in SERPENT.
III.IV SIMULATE3
Following the CASMO4E simulations, the generate cross section libraries are used to run full core calculations in SIMULATE3 (also created by STUDSVIK). SIMULATE3 is an industry-standard tool for simulation of core performance that uses three-dimensional two-group nodal methods. SIMULATE3 uses CASMO cross section data for each assembly and can simulate the core on a pin-level. SIMUALTE3 uses thermal hydraulic and structural specification of the PWR core in order to accurately produce power distributions and reactivity coefficients. like CASMO4e, SIMULATE3 has been benchmarked against many critical experiments and operational reactors (Uegata et al., 1993).
III.V SIMULATE terminology
The following design parameters in SIMULATE3 are considered to compare the performance of a PWR reactor core with standard UO2 pellets and Fuel-in-Fibers design, described in the following section.
Ø Cycle Length [Effective Full Power Days (EFPD)]: is the total cycle length between reactor refueling, assuming the core operates at 100% of rated power with no interruptions. Ø Core Loading [Metric-tons (MT)]: is the total mass of uranium or heavy metal loaded in
the core.
Ø Equilibrium Cycle: is the cycle at which the addition of fresh fuel produces cycle length and fuel batch burnups that are the same as the previous cycle. The equilibrium cycle is usually used for comparison of two different designs to fully capture the effects of a change in design.
Ø Boron [ppm]: is the concentration of boron diluted in the coolant. Boron is used to control reactivity and decreases through the cycle.
Ø Reactivity [pcm]: is the definition from criticality and is the ratio of keff-1 to keff . The cycle is terminated when core reactivity is zero.
Ø Moderator Temperature Coefficient (MTC) [pcm/oF]: measure of the change in reactivity due to the change in the moderator (e.g. water) temperature divided by the change in average moderator temperature. It is desired for this value to remain negative at rated operating power to meet licensing requirements.
20
Ø Isothermal Temperature Coefficient (ITC) [pcm/oF]: measure of the change in reactivity due to the uniform change in the fuel and moderator inlet temperatures divided by the change in the average moderator temperature.
Ø Uniform Doppler Coefficient (UDC) [pcm/oF]: measure of the change in reactivity due to the uniform change in the fuel temperatures divided by the change in the average fuel temperature.
Ø Boron Coefficient [pcm/oF]: measure of the change in reactivity due to the uniform perturbation of the boron concentration divided by the boron change.
Ø Power Coefficient [pcm/%]: measure of the change in reactivity due to the uniform change in the power level divide by the percent change in power. This quantity is required to be negative for licensing.
Ø Shut-Down Margin (SDM) [pcm]: measure of the margin available for the core to be shutdown under many conservative assumptions. Since, PWRs are designed with a negative MTC and density feedback coefficients, the reactivity change from hot full power (HFP) to hot zero power (HZP) is very large, and there needs to be sufficient margin for the control rods to ensure the shutdown of the core. The calculation methodology of SDM, used in this study, is shown in Table 2. The reactivity generated by going from HFP to HZP needs to be overcome by the control rods assuming the most effective control rod is not functional in addition to a 10% uncertainty on control rod worth, accounting for its depletion. The the minimum SDM of 1300 pcm is typically enforced.
Table 1: Procedure for the shutdown margin calculation
Symbol Reactivity Difference
∆𝒌𝟏 HFP to HZP ∆𝒌𝟐 HFP to All Rods In (ARI) ∆𝒌𝟑 HFP to Most Effective Rod In
𝑆𝐷𝑀 = ∆𝑘++ 0.9(∆𝑘2 − ∆𝑘4)
III.VI Single channel in-house MATLAB code
In order to optimize the Fuel-in-Fibers concept for a PWR, an in-house MATLAB single channel code, built to evaluate PWR Thermal Hydraulic and Structural properties, (Giudicelli et al., 2017) was utilized. This code is designed to compare different fuel materials and geometries, arranged in square arrays, in PWRs. It can find the optimum design performance given set of constraints. The limits include:
• Core geometry constraint • Fuel bundle pressure drop
• Minimum departure from nuclear boiling ratio (MDNBR) • Fretting and sliding wear
21
• Steam cycle limit
• Fuel average temperature • Fuel rod centerline temperature
The following is the brief description of each of these limits. For more detailed description of the code, Giudicelli and Shirvan, 2016, can be referred.
The core geometry limit is set by the geometry of the core. The size of the core calculated when the pitch changes must be less than 4.5% different from the original core size. This means that when the code scans over pitches and diameters, if it tries to fit too many rods with a large pitch in the assembly, it will not be able to physically fit in a core, resulting in exclusion of the case. Having too many or too few rods results in other problems than geometrical- rods that are too thin are more likely to break and rods that are too thick are more likely to melt. Because of this the pitch search is only between 6.5 and 12.5 mm and the code only considers 15x15 to 24x24 fuel rods per assembly.
The fuel bundle pressure drop limit is calculated by the code. It is limiting because a pressure drop that is too large will be hard to physically produce by the reactor coolant pump. The pressure drop is evaluated by a 1D model which uses the Cheng and Todreas correlation to calculate pressure drop due to friction. The In model and Chun and Oh mixing coefficients are used to determine the pressure drop due to spacer grids and intermediate flow mixing grids, respectively. The total pressure drop takes into account pressure drops due to: friction, gravity, form loss, and the upper plenum.
The MDNBR is the ratio of critical surface heat flux to the surface heat flux. At this point the boiling changes from nucleate boiling to film boiling, which is a poor heat transfer mechanism. The MDNBR limit is also calculated by the code. Since the critical heat flux is dependent on the channel’s geometry and fluid properties, it is calculated over the whole core using the W3-L correlation – Westinghouse’s W3 correlation improved for L-type spacer grids. The code assumes the turbulent cross flow mixing parameter to be .038 and the grid spacing parameter to be .066.
Fretting and sliding wear takes place at the location of the spacer grids, because the flow causes the rods to vibrate. The difference is that fretting wear is due to rubbing between the cladding and the grid spacers due to the spacer springs loosening with radiation exposure, and sliding wear happens when the fuel rod moves inside the support spring. If fretting occurs too much it can cause a break in the cladding barrier. This is a common cause of fuel failures in PWRs (IAEA, 2010). These are modeled using the Au-Yang model, which relates the vibrations created by turbulence to the wear rate. The fretting wear ratio is defined as the ratio of the new fretting to
22
the reference fretting. The sliding wear ratio is the ratio of the computed sliding wear to the reference sliding wear.
In case of power uprates or reducing the core pressure drop, it is desirable to reduce the inlet temperature of the core. However, the lower core inlet temperature results in a lower saturation temperature and pressure on the secondary side of the plant. The lower steam temperature and pressure adversely impacts the plant steam power cycle efficiency. For example, a decrease in core average temperature of 10 K will result in a loss of steam cycle efficiency of ~20 MWe according to (Shirvan, 2015). Thus, the minimum core inlet temperature is limited to 257oC as the “steam cycle limit”.
23
IV. Reference PWR Core
It is important to discuss the geometry and characteristics of the reference PWR core in order to better understand its comparison to the Fuel-in-Fibers core in later sections. This section will discuss the geometry of the reference PWR core as well as explain the meaning and importance of the peaking factors that will be calculated and discussed in Section V.V.
IV.I Reference PWR background
The standard PWR Westinghouse 4-Loop core is consists of 193 assemblies of pins filled with fuel (Figure 6). The reference loading pattern used in this study (Andrews et al., 2016), as shown in Figure 6, is rotationally symmetric in each quadrant. The number of fresh fuel assemblies reloaded during each outage is 84, matching well with the current industrial practice. The core design also has a cycle length and reactivity coefficients very similar to that of the Seabrook plant which operates at 3587 MWth.
24
The reference core was made of 4 independent fuel “segments”. The middle 3 m of the “high enriched” and “Low enriched” assembly types, denoted in Figure 6, had about 4.3 w/o average enrichments with IFBA coatings on some pins in the assembly. The remaining ~30 cm of fuel on each side were divided into two non-IFBA enrichment zones of 3.5 w/o and 2.5 w/o, respectively. Thus, most of the core performance is highly depended on only two fuel segment types of about 4.3% enriched with IFBA coatings.
Table 2: Parameters of the Reference PWR Core
Values Regular PWR
Power [GW] 3.411 Pressure [MPa] 15.51 Coolant inlet temperature [C] 293.1 Coolant outlet temperature [C] 326.8 Mass Flow rate [kg/s] 18624 Active core height [m] 3.66
Total core height [m] 4.058 # Fuel assys in core 193 # of spacer grids (Zircaloy) 8 Thermal conductivity of UO2 [W/mK] 5.0
Fuel density UO2 [g/cc] 10.4025
IV.II PWR Core Design
As seen in previous sections a PWR assembly manufactured by Westinghouse typically consists of a 17 x 17 square array of fuel pins as shown in Figure 6. There are 264 fuel rods and 25 guide tube channels reserved for control rods, instrument tubes, or sometimes burnable absorber rods in each assembly. The reactivity in the core is controlled by three means: control rods, soluble boron concentration, and burnable absorbers in the fuel or the burnable absorber rods in guide tubes.
In PWRs, control rods fulfill an additional safety function: they can be inserted into the core to shutdown the fission chain reaction. There are two types of control rods- black and grey. Black control rods have a high rate of neutron absorption and grey control rods are partially transparent to neutrons. Black control rods are typically made of Silver-Indium-Cadmium (AIC), Boron Carbide (B4C), or Hafnium. AIC rods have the least rod worth and B4C rods having the most worth with Hafnium in the middle (Soldatov, 2009). The reference PWR core was first explored with AIC control rods and later on was switched to B4C. The soluble boron in the core comes from boron tank and the chemical volume control system. Each cycle starts out with relatively high boron (less than ~1500 ppm) and the boron is diluted with coolant until there is none left at the end of the 18-month cycle.
25
The fuel can be manufactured with burnable absorbers. The three major types of burnable absorbers used are: WABA (Wet Annular Integral Absorber), IFBA (Integral Fuel Burnable Absorber and gadolinia (Gd2O3) rods. In a WABA there are layers of water and cladding surrounding one layer of burnable poison made of (Al2O3-B4C). (O'Leary, 2000) (Wagner, 2002). The WABA was not utilized in this thesis for simplicity and was left as future work. In comparison, in IFBA, a thin layer of ZrB2 compound is deposited on the fuel pellet outer (side) surface (see Figure 7 below). In a Gad pin, the gadolinia is mixed uniformly with the fuel. In IFBAs and in Gad pins the absorption of thermal neutrons causes the initial k_inf to decrease and the reactivity curve to peak at a higher burnup, when the burnable absorbers are almost depleted. Because Gad is mixed in with the fuel it burns in layers, from the outside in, which induces a strong spatial self-shielding (Wagner, 2002) (O'Leary, 2000) effect and causes the Gad pins to last much longer than IFBAs. However, Gadalonia displaces fuel mass, resulting in high enrichments which is not desirable especially for the Fuel-in-Fibers design.
The burnable absorber’s primary purpose is to reduce the soluble boron concentration and flatter the radial peaking factor of fuel rods in the core. In any of these three cases fuel pins without burnable absorbers outnumber fuel pins with burnable absorbers. The higher the U235 content (e.g. enrichment), the higher the initial reactivity and power of each assembly and the higher its peaking. The assembly enrichment decreases as it produces power and “burns” in the core. Therefore, burnable poisons are utilized to reduce the initial power of the “fresh” assemblies when they are introduced into the core in order to minimize peaking near the beginning of the cycle.
26
IV.III Power Peaking Factors
When looking at power peaking in a core there are many different types of peaking factors that must be evaluated. Firstly, there is radial peaking. The radial peaking factor is the ratio of the highest peaking to the average peaking of the assemblies when a 2D slice of the core is considered. Figure 8 shows a radial power distribution of a typical PWR core, where the outside most assemblies are producing the least amount of power because they are not fresh fuel (to minimize leakage) and the assemblies on the outer ring are the highest peaking (the red color). This is a common “low-leakage” loading pattern with what is often called a “ring-of-fire” on the outside and a checkerboard pattern in the inside. While radial peaking varies from plant to plant it usually has a maximum technical specification limit of 1.40 to 1.70 and varies during the fuel cycle length.
Figure 8: Typical PWR core radial power distribution
The second peaking factor of interest is the axial peaking factor. Axial peaking is the ratio of largest peaking in the axial nodes to the average. Axial peaking also varies by power plant but usually has a maximum of 1.3 - 1.55 (assumed for safety analysis). It is also noted that controlling (minimizing) axial peaking is as important as flattening the radial peaking. Axial peaking is of interest throughout the life of the core. In a reference PWR the axial peaking is expected to be mostly symmetrical but slightly higher in the bottom of the core at BOC due to the increased water density which increases moderation. At the end of the cycle the axial peaking flattens as the bottom of the core is more “burned” and balances the moderation feedback.
27
For a fuel rod with uniform fuel enrichment and poison distribution, the peak in axial power is found toward the axial center of the rods. The reason for this shape is the leakage of neutrons from both ends of the fuel rods. Neutron leakage is when a neutron escapes from the boundaries of the core before becoming thermalized. The axial neutron leakage is typically minimized by using axial blankets composed of natural or low enriched uranium. The radial neutron leakage is also reduced with steel baffles/reflectors that reflect a fraction of the neutrons leaving the core periphery back into the fuel. A reduction in leakage, not only will reduce the power peaking axially and radially, but also will enable a decrease in enrichment as more neutrons are conserved and “neutron economy” is improved. Leakage varies by core design but is usually around 2%-4%.
Another important value to analyze is F-delta-h (FDH). F-delta-h is the ratio of the change in enthalpy in the hot channel over the core to the average change in enthalpy over the core. It is important that F-delta-h remains below its set limit because it is important for thermal hydraulic reasons (MDNBR) that the hot channel outlet enthalpy remain low with sufficient margin to saturated boiling. The limit for F-delta-h varies by plant but is usually between 1.55- 1.70.
28
V. Design Methodology
The idea and sponsorship for this project comes from a small company called Free Form Fibers (FFF). They have created a new additive (direct) manufacturing process and with the help of funding from several Small Business Innovation Research Proposals (SBIR) from the DOE ( Pegna, 2015) , and MIT, they have been investigating its use for nuclear fuel applications.
V.I FFF Additive Manufacturing Technology
The new additive manufacturing process is similar to 3D printing. It is based on an existing technology called Laser-Induced Chemical Vapor Deposition (LCVD). LCVD works by using a laser focused on a small region of material to create growth. The deposited material grows towards the laser beam. Fibers or filaments are created by moving the focus of the laser (Pegna, 2015). The benefit of this technique is that it works well for materials that can be difficult to process such as Silicon Carbide (SiC). FFF has developed a more efficient version of this technology. Called the Digital Spinneret (DS) it parallelizes the LCVD technique (as seen in Figure 9). The DS can not only produce fibers of exotic materials but also coat them in very thin layers. The layers are very uniform and can be as small as a few microns thin which gives great precision. FFF has demonstrated this technology on the creation of SiC fibers and found that the grain distribution in the SiC they created was unique and expected to provide additional toughness. They have also shown that the technology can successfully coat the SiC fibers with a thin coating of nanopourous carbon.
Figure 9: FFF's implementation of a ceramic fiber laser printing process through three successive magnifications. (Pegna, 2015)
29
The purpose of the MIT contract with the company is to determine the best way to use this technology to create an ATF technology. The focus of the company is on the material and structural testing and the focus of this thesis is on the most optimal way to use this technology to create a new fuel and analyze if the fuel meets the goals of the ATF program. The original invention suggested by the company, herein denoted as “Fuel-in-Fibers” concept, was to create a fuel pellet the size of a normal PWR fuel pellet out of the fibers by weaving them into a CMC (see Figure 10) similar to the SiC CMC design. A second option was pursued in this study and later a variant adopted by the company. Due to the brittleness of the fibers, instead of fiber weaving, the fibers were put vertically upright in a SiC matrix. This concept was motivated from the nature of available geometry options in the neutronics codes, discussed further in the thesis.
Figure 10: Design of woven fibers (Pegna, 2015)
V. II Specifics of the fibers and design constraints
In the fuel-in-fiber concept, the fibers themselves are made up of layers of SiC, carbon, and fuel, similarly to TRISO particles. They are capped on both ends with SiC to retain fission particles as seen in Figure 11.
Figure 11: A horizontal and axial cross section of the fiber
30
The fibers are then placed into a SiC matrix to form a pellet the size of a regular PWR fuel pellet and then placed in a typical PWR assembly with SiC cladding as seen in Figure 12. They are subject to several design constraints due to manufacturing limits:
Ø For stability, the fibers core must be SiC which is different from the TRISO particle’s fuel center.
Ø The outside diameter of the fiber must have a maximum of 150 µm.
Ø The SiC caps on each end of the fiber must account for at least 10% of the length of the fiber.
31
VI. Fuel-in-Fiber Design Study
VI.I Design Constraints and Smearing
As previously mentioned, the three geometrical design constraints are as follows: the maximum diameter of the fuel is 150 µm, the minimum diameter of the fibers SiC core is 15 µm, and the maximum coverage of the fiber by the fuel is 90%. These bounds were used to improve fuel volume fraction and to ensure sufficient fuel volume for fission product retention. The two fundamental neutronic constrains on the design are:
1. The Fuel-in-Fibers concept must have the same assembly burnup (1500 effective full power days), as a normal PWR fuel (UO2 enriched at 4.5 w/o% )
2. The enrichment must remain under 20 w/o in order to avoid proliferation risks by being classified as Low Enriched Fuel (LEU).
The top view of the fibers in a pin cell and in a standard PWR assembly can be seen in Figure 13. Note that since the fibers are so small – OD of 150 µm compared to the 8190 µm OD of the fuel pellet, they are hard to visualize so a section of the pellet has been enlarged for better visualization.
Figure 13: The top view of the Pin cell and the assembly.
The fibers were placed in the pin cell in a hexagonal close packed matrix to maximize packing. Because of the SiC caps in the fiber design, the distribution of fuel axially is non-uniform– they consist of multiple layers in the center but the tops and bottoms are capped by SiC as seen in Figure 11. In order to overcome the challenges of simulating such non-uniformity, the fuel and fiber fraction were axially smeared such that it would result in the same physical mass for each material. Converting the material in the fiber from a heterogeneous mixture to a homogeneous one is feasible because of the small scale. The diameter of the fiber is on the order of 150µm and the mean free path of neutrons, the average distance they will travel between collisions, is around 2 cm (Σt~.5/cm) at thermal energies, which is much larger than 150µm. This means the neutron has
32
the same probability of interacting with a material in the homogenized or heterogeneous case. Following this logic it may not be feasible to effectively homogenize a whole pincell, because the size of the ~1 cm cell is closer to the neutron mean free path.
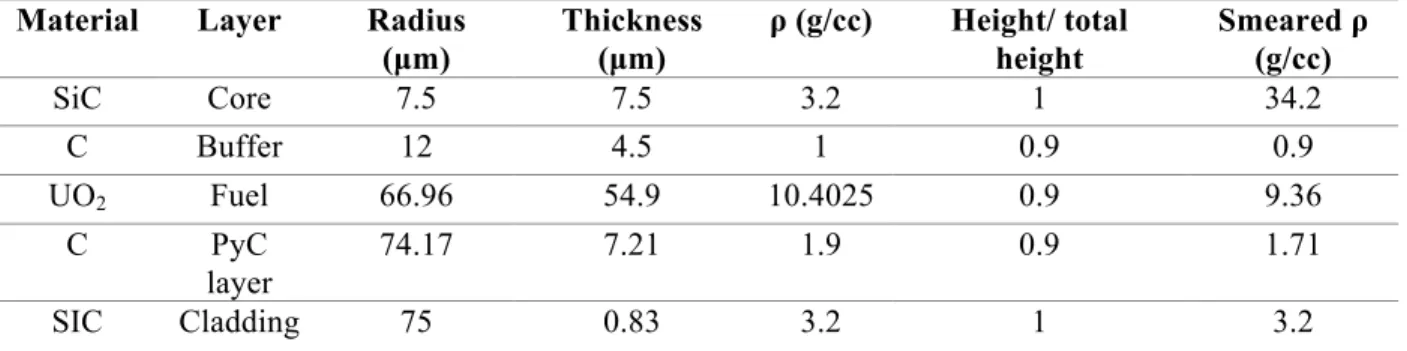
The dimensions of the fibers along with actual and smeared densities are listed in Table 4. Note that the smeared density of SiC is much larger since the volume of SiC surrounding the fuel is very small compared to the SiC volume in the end caps as shown in Figure 11.
Table 3: Geometrical Values of the Fiber before and after Smearing
Material Layer Radius
(µm) Thickness (µm) ρ (g/cc) Height/ total height Smeared ρ (g/cc) SiC Core 7.5 7.5 3.2 1 34.2 C Buffer 12 4.5 1 0.9 0.9 UO2 Fuel 66.96 54.9 10.4025 0.9 9.36 C PyC layer 74.17 7.21 1.9 0.9 1.71 SIC Cladding 75 0.83 3.2 1 3.2
The assembly-level burnup calculations were performed with SERPENT on an averaged power assembly representative of a 193 assembly 3400 MWth PWR core. The simulations were run with 20,000 neutrons for 200 active cycles and 40 inactive cycles. Boron and burnable poisons were not considered for the purpose of this initial investigation. The temperature of the water and cladding was set to 600 K and the temperature of the fuel was set to 900 K.
VI.II Optimization of Fuel Pin Design
After gaining confidence in simulations with SERPENT by completing the benchmarking study, and smearing the pin so it could be modeled, the design needed to be optimized, given the mentioned constraints. Many of the design parameters of the Fuel-in-Fibers concept are changeable, such as the thicknesses, the fiber pitch, the length of the repeatable fuel-fiber geometry, and the diameter of the fiber. Series of sensitivity studies were performed to determine the best configuration.
In order to maximize the fuel volume, the maximum fiber diameter of 150 µm was used. This resulted in testing the fiber pitch (center of one fiber to center of the other fiber) from 160 to 200 µm as shown in Table 5 with the corresponding infinite multiplication factor (𝑘6) at BOL and at 1500 EFPD.
33
Table 4: Varied pitches and BOL k with UN
Pitch (µm) BOL 𝒌6 Error (pcm) 𝒌6 at 1500 EFPD Uncertainty (pcm) 160 1.55488 39 0.86861 37 170 1.56187 39 0.77080 59 180 1.56664 44 0.67655 28 190 1.56983 42 0.63267 28 200 1.57189 39 0.60107 25
The fuel was simulated with 9.5 w/o UO2. Figure 14 shows that for the considered pitches, the infinite multiplication factor (𝑘6) increases as the pitch increases slightly at the beginning of life but the different pitches have different slopes and by the end of life the largest pitch has the lowest 𝑘6 since it has less fuel loading. By taking advantage of the direct manufacturing
fabrication technique, variation in pitch could be used as a method to control reactivity both radially and axially in a fuel assembly.
Figure 14: k∞ vs EFPD for varying fiber pitches
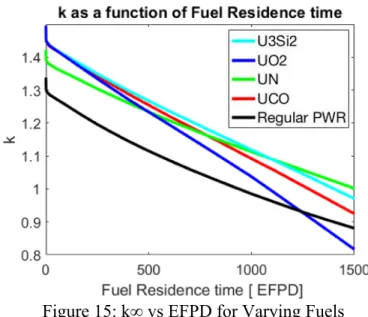
Also examined were the effects of different fuels on 𝑘6. In addition to UN (with Enriched 15N), UCO, UO2, and U3Si2 were studied at 9.5% enrichment with pitch of 0.016 cm. It was found (as seen in Figure 15 that UN (13.585 g/cc), UCO (10.925 g/cc), and U3Si2 (11.59 g/cc) had fairly similar profiles. UO2, however, had a drastically steeper slope causing it to have a much lower 𝑘6 at the end of life due to its lower fissile inventory. The fibers in the cases in Figure 15 are at a pitch of .016 cm. The reactivity plot of a regular PWR assembly with 4.5 w/o UO2 fuel is also shown in Figure 15.
34
Figure 15: k∞ vs EFPD for Varying Fuels
The UO2 fuel case in Figure 16 was run with UO2 in the fibers at different enrichments of 8.5%, 9.5%, 10.5%, 11.5%, 12.5%, and 13.5%. These are compared to the regular PWR case, which has an enrichment of 4.5 w/o. The fibers are at a pitch of .016 cm.
Figure 16: k∞ vs EFPD for Varying w/o Enrichments of UO2
Compared to regular PWR, the Fuel-in-Fibers design initially has a much higher reactivity due to increase in moderation relative to fuel but its reactivity decreases faster. This means a stricter reactivity control is needed to achieve the same EFPD for the Fuel-in-Fibers concept compared to a regular PWR. However, the reactivity and required enrichment is significantly lower compared to the traditional TRISO-type fuels proposed for PWRs (Brown et al., 2013) and (Shapiro et al., 2016). The FCM concept is unable to match the reactivity curve of a regular PWR
35
at 1500 EFPD at an enrichment below 20% for UO2 or UN. At 1200 EFPD, it is able to match the reactivity curve of the regular PWR with an enrichment of 18.6% for UN, after optimization using a 11x11 fuel rod per assembly design, while neglecting the thermal hydraulic consequences (Shapiro et al., 2016). In comparison the Fuel-in-Fibers design requires only 11.5 w/o enrichment of UO2 for a regular PWR assembly design without optimization, as shown in Figure 16.
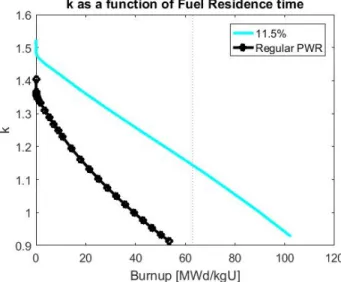
Figure 17: k∞ vs Burnup for the Reference PWR and the 11.5% UO2 F-in-F case
It is worth noting that while the Fuel-in-Fibers UO2 case matches cycle length with a regular PWR at 1500 EFPD at 11.5% enrichment, it has a higher burnup. The burnup limits on fuel in many currently running plant in the US are 62 MWd/kgU (as shown by the dotted line in Figure 17). Enforcing this limit on this technology would make it difficult to keep the enrichment low, but the burnup limit was previously set because of the Zircaloy and if SiC cladding is used the burnup limit can increase. The fuel is also more resistant to high burnup due to the many layers.
Since there was no constraint on fuel material from the manufacturer (in fact UO2 is more challenging due to presence of oxide at high temperatures), the UN fuel was also considered because, as seen in Figure 15, UN’s higher density allows for lower enrichments to be achieved for the same EOL target reactivity. The enrichment curves for UN fuel are shown in Figure 18. As seen in Figure 18 UN requires only a 7.5% enrichment in order to match the regular PWR curve as compared to the 11.5% required for UO2.
36
Figure 18: k∞ vs EFPD for Varying w/o Enrichments of UN
Fuel volumes and packing fractions of the UO2 and UN cases were compared to the regular PWR and FCM (Shapiro et al., 2016). The normalized fuel volumes are listed in Table 6 below.
Table 5: Fuel volume, mass and Uranium mass fraction comparison
Concept F-in-F FCM
Parameter UO2 UN UO2 UN
Fuel Volume 0.52 0.52 0.14 0.14
Fuel Mass 0.52 0.68 0.14 0.18
Uranium Mass 0.52 0.72 0.14 0.20
Another method of comparison is the packing fraction, which is the ratio of the volume of the particles to the total volume of the pellet. Compared here are the packing fractions of the FCM concept to the Fuel-in-Fibers concept. The packing fraction of the FCM ranges from .25 to .33 in Brown et al. The packing fraction for Fuel-in-Fibers at its smallest pitch- .016 um- is .79.
37
VI.III Neutron Spectra
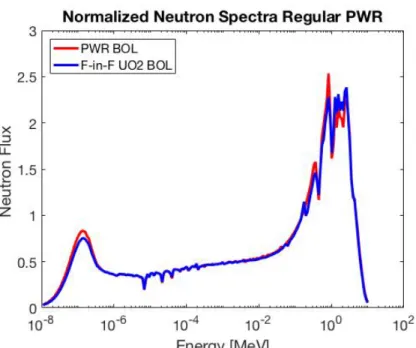
Figure 19: Neutron spectra for the Fuel-in-Fibers and Reference PWR
While looking at the Fuel-in-Fibers assembly, its neutron spectra was evaluated compared to the neutron spectra of the reference PWR assembly using the code SERPENT. The Fuel-in-Fibers assembly that is plotted here has an enrichment of 8.5%. The maximum error due to SERPENT in Figure 19 is 1.3% (1σ). The neutron energy spectra plot shows a large spike around 1.0 MeV where the fast neutrons are born and at 10-6 MeV where the thermal neutrons are present. It can be seen that the Fuel-in-Fibers case has a lower magnitude in the thermal energy region and a higher magnitude in the fast energy region. This means the Fuel-in-Fibers case has a slightly harder spectrum than regular PWR fuel.
38
VII. Core Design and Safety Assessment
VII.I SERPENT and CASMO assembly comparison
Previous sections show the neutronics results of the Fuel-in-Fibers concept when analyzed on an assembly level in neutronics code SERPENT. In order to analyze the fuel in a full core there must be a switch to the code CASMO4e.
As seen, in Figure 20, in CASMO4e, the fibers in the fuel pellet cannot be modeled explicitly and had to be homogenized. In order to prove that this approximation was sufficient a pincell for a reference PWR in SERPENT and CASMO4e and the Fuel-in-Fibers pincell were compared. The SERPENT calculations were run with 20,000 neutrons per cycle, 500 active cycles, and 100 inactive cycles for a single pin without boron. The ENDF/B-6 neutron cross section library is available in CASMO4e at MIT. For the comparison in Figure 22 the ENDF/B-7 library was used which accounts for the relatively large difference (500 pcm). For Figure 22 the ENDF/B-6 library was used in SERPENT for increased accuracy. In both cases the difference in reactivity between the two codes are sufficiently small (<600 pcm). The homogenization is an approximation and tends to lower the estimated reactivity of Fuel-in-Fibers fuel.
39
Figure 21: Serpent Homogenous and Heterogeneous fuel geometry and error
The error between the Homogeneous and Heterogeneous cases in Serpent is at a maximum less than 600 pcm. While this appears large the change in reactivity over 1500 EFPD is much larger for this fuel than a regular PWR (60,000 pcm change for this fuel compared to a 40,000 pcm change in a regular pwr over 1500 efpd) .
40
Figure 23: SERPENT and CASMO pin comparison
It is noted that the difference in reactivity between the heterogeneous case (SERPENT) and the homogeneous case (CASMO4e) for the Fuel-in-Fibers case is larger than the desired value of ~100 pcm, but considered close. Also, the pcm difference between homogenous and heterogeneous cases are similar to the effects of fuel grain size on reactivity. Previous studies show that for MOX fuel with large grains (~250 µm), the reactivity difference between 200 and 400 pcm were calculated when modeled homogeneously and heterogeneously. These calculations were based on CASMO5 and MCNP5 simulations.
VII.II Fuel-in-Fiber Core
The core for the Fuel-in-Fibers fuel features the same geometry as the standard PWR Westinghouse 4-Loop core- 193 assemblies each with 264 fuel rods and 25 nonfuel rods. The loading pattern used in this study is shown below in Figure 24 and is rotationally symmetric in each quadrant. The number of fresh fuel assemblies reloaded during each outage is 84, matching well with the current industrial practice and the reference. The Fuel-in-Fibers fuel pins are surrounded by a SiC cladding.
0 500 1000 1500
Cycle Length [EFPD]
0.8 0.9 1 1.1 1.2 1.3 1.4 1.5 1.6 ki nf
Homogeneous pin vs Hetrogeneous pin
Hetro Homog
0 500 1000 1500
Cycle Length [EFPD]
-100 0 100 200 300 400 500 600 PCM Error
Homogeneous pin vs Hetrogeneous pin
41
Figure 24: Core Loading pattern for Fuel-in-Fibers full core calculations
The fuel volume in the Fuel-in-Fibers core is significantly lower than the fuel volume in the reference core because of the extra silicon carbide and carbon layers in the fiber that are displacing fuel. The Fuel-in-Fibers core has 50.16 metric tons of fuel vs. 90.42 metric tons of fuel in the reference PWR. This means that the enrichment of the Fuel-in-Fibers core must be higher than the reference PWR in order to meet the same cycle length.
VII.III Assembly optimization
Many different assemblies were created in CASMO. Fuel enrichment was varied from 2 to 10.5%. Gad pins, IFBA pins, and a combination of both were tested to see which would reduce the reactivity at the beginning of the cycle and reduce the peak k_inf most effectively. Both the Gad percentage and the B10 concentration in the IFBA were varied. Assemblies were judged on suitability according to their BOC k_inf, max k_inf in cycle, and the pin peaking factor within the assembly. It was found that assemblies with combination IFBA and Gad pins (1.78 mg/cm B10 loading and 5% Gd) with fuel enrichments between 5.5% and 8.5% worked the best for minimizing the peaking and achieving the target cycle length.
42
VII.IV Fuel-in-Fibers UO
2Assemblies
The three figures shown below (25, 26, 27) show a comparison between the reactivity curves for the two most common assemblies in the reference core and in the Fuel-in-Fibers core. The 2 most common assemblies in the Fuel-in-Fibers core are 8.5% and 7.5% fuel enriched with 5% Gd and 1.78 mg/cm B10 in the IFBA’s. The two most common assemblies in the reference core are 4.740% and 4.437% enriched with .927 mg/cm B10 loading in the IFBA’s. The fuel mass in the reference PWR core is 90.42 metric tons and the fuel mass in the core for the Fuel-in-Fibers PWR is 50.16 metric tons.
Figure 25: k_inf for top two reference assemblies and top two Fuel-in-Fibers assemblies un-normalized burnup
Figure 26: K_inf for top two reference assemblies and top two Fuel-in-Fibers assemblies normalized cycle length by fuel mass
43
Figure 27: k∞ for top 2 reference assemblies and top two Fuel-in-Fibers assemblies normalized by cycle length
As seen by Figures 25-27 above the max k∞ of the Fuel-in-Fibers cases is higher than the reference. This is to be expected because of the increased enrichment. Also as expected the Fuel-in-Fibers assemblies shown here do not match the cycle length of the reference case. As shown in previous sections the enrichment needed to match the cycle length of an individual assembly is 11.5% for UO2 as a fuel. Of note: the reference assemblies were only run for 60 MWD/kg because that is the current US regulatory limit for fuel. The Fuel-in-Fibers cases were run for 100 MWD/kg so they have similar ending points when plotted in MWd because the Fuel-in-Fibers has lower fuel mass. A benefit of the increased burnup of the Fuel-in-Fibers concept is it can minimize waste and increase uranium utilization.
44
Figure 28 above shows the rate of destruction of U 235 and creation of Pu in both fuels on a normalized cycle length basis. Even though Fuel-in-Fibers reaches much higher burnup compared to the REF design, the total Pu is slightly lower for the Fuel-in- Fibers design compared to the Reference design, because of the softening of the neutron spectrum (e.g. higher H/HM ratio).
VII.V Fuel-in-Fibers UO
2Core results
Figure 29: The average boron concentration in the Reference and Fuel-in-Fibers cores The core Boron concentration is shown in Figure 29. While the maximum boron concentration for Fuel-in- Fibers is greater than the Reference design, its magnitude is reasonable. Above Boron concentration of 2000 ppm, there are concerns regarding the moderator temperature reactivity feedback. At above 1500 ppm, there are concerns regarding axial offset anomaly caused by deposition of boron on the fuel rods. The higher magnitude of boron concentration is directly correlated to the higher reactivity seen in Figure 16.
45
Figure 30: Core radial assembly peaking factor for Reference and Fuel-in-Fibers
The core radial power peaking as a function of burnup for Fuel-in-Fibers is shown in Figure 30. As shown, the radial power peaking is larger than reference design, because of the reactivity mismatch shown in Figure 16. At the EOC, the radial peaking factors are comparable.
Figure 31: Axial peaking factor for Reference and Fuel-in-Fibers at BOC, MOC and EOC The axial power peaking factor at BOC, MOC and EOC is shown for each core in Figure 31. As shown, the axial peaking factors remain in approximately the same range of the reference core.
46
Further improvements in the axial power shape can be obtained by changing the axial enrichment distribution. It is worth noting that the BOC and MOC Fuel-in-Fibers axial peaking factors are much higher on top and bottom of the core than in the reference case. This is because in the reference case the fuel has no poisons in the end 30 inches. In the Fuel-in-Fibers case the fuel has no poisons only in the end 15 inches. The only effect of this is it is not optimal for leakage reasons. If poisons are put in the end 30 inches of the Fuel-in-Fibers concept the axial peaking at the top and bottom is greatly reduced but the addition of more poisons causes a reduction in cycle length.
Figure 32: FΔh for the Reference and Fuel-in-Fibers case
The FΔh peaking factors are shown for the Fuel-in-Fibers case and the reference case. While FΔh limits vary by power plants and they are usually around 1.55-1.7. The FΔh for the Fuel-in-Fibers case goes above the current PWR limits. In order to maintain safety limits despite high peaking, the outlet enthalpy of the reference core of decreased according to the ratio of the maximum FΔh to the imposed maximum limit of 1.7. In order to keep the same power level and mass flow rate, the core inlet temperature will also have to decrease by the same amount as the outlet temperature. It was found the decreasing the core inlet temperature by 5 K maintained the same maximum enthalpy between the Fuel-in-Fibers core and a current PWR with a 1.7 FΔh limit. The decrease in core average temperature will result in a loss of steam cycle efficiency of ~ 10 MWe according to (Shirvan, 2015). This will be accounted in the economic analysis of section VII.