First International Conference on Bio-based Building Materials
June 22nd - 24th 2015
Clermont-Ferrand, France
USE OF BIO-BASED INSULATION MATERIALS IN BUILDINGS: MODELLING OF
HYGROTHERMAL CONDITIONS IN USE – RESISTANCE OF A WOOD FIBRE
MATERIAL TO MOULDS ACCORDING TO CLIMATIC CONDITIONS
J. Lamoulie1*, I. Le Bayon1*, M. Draghi2, M. Roger3, C. Pompeo4, M. Gabille1, M. Prégnac1,
M.Jequel1, M. Kutnik1
1 Institut Technologique FCBA, BP 227, 33028 Bordeaux cedex, France
2 CSTB, Direction Santé Confort/ Division agents biologiques et aérocontaminants, 84 avenue
Jean-Jaurès, Champs-sur-Marne, 77447 Marne-La-Vallée cedex 2, France
3 CSTB, Direction Isolation et Revêtements, 84 avenue Jean-Jaurès, Champs-sur-Marne, 77447
Marne-La-Vallée cedex 2, France
4 CSTB, Direction Energie-Environnement, Division Enveloppes Matériaux Innovants, 24 rue
Joseph Fourier, 38400 Saint-Martin d’Hères, France
*Corresponding authors; e-mail: julien.lamoulie@fcba.fr and isabelle.lebayon@fcba.fr
Abstract
Due to their positive environmental attributes and their performance, the use of bio-based insulation materials such as wood fibre, loose fill cellulose, hemp, flax and straw has been increasing in the construction industry across Europe. However, the current test method requirements to get technical approval do not take into account the real hygrothermal conditions in use. This research project aimed to model hygrothermal conditions of bio-based insulation materials (rigid, semi-rigid and loose-fill). The modelling of coupled thermal and humidity transfers was carried out with WUFI 2D software. Representative wall and roof were studied, with different end uses for insulation materials (outer, inner, distributed insulation). Four unfavourable French climates where studied (cold continental, humid oceanic, Mediterranean, mountain). Regarding modelled hygrothermal conditions and insulation material behaviour, two humidity use classes could be defined. An experimental design was carried out with wood fibre insulation material to assess the impact of temperature and relative humidity on the mould growth. An innovative mould test was developed with a quantitative assessment of mould growth. Finally, corroborating these two parts, this project gave to the manufacturers of bio-based insulation materials the option to highlight natural durability of their products, testing them in an environment that fits with the real hygrothermal conditions in use.
Keywords:
Bio-based; Insulation; hygrothermal; use class; mould; test method; WUFI 2D software.
1 INTRODUCTION
From various studies, it was shown that 30% to 45% of United Kingdom buildings (Hunter et al. 1988; Platt et al. 1989), 20% to 30% of Finnish buildings (Koskinen et al. 1999), 20% to 25% of Netherland buildings (Adan, 1994, Gravesen et al. 1999), 37% to 47% of French buildings (Moularat et al. 2008), 40% of American buildings (Brunekreef et al. 1989) were contaminated by moulds. Mould fungi usually require a minimum water activity of 0.65, thus meaning a minimum relative humidity of 65% (Botton et al. 1990). Existing laboratory test methods to assess the resistance of materials against moulds such as ISO846, ASTMC1338 and EN15101-1 Annex F are carried out at 95% of relative humidity only. This humidity is selected for mould growth. There is no link with usual hygrothermal conditions. In addition, the
scope of these test methods is not bio-based insulation materials, except EN15101-1 which deals with loose fill cellulose.
In a first step, this study aimed to model hygrothermal conditions of bio-based insulation materials. This study, carried out for low and medium hygrometry buildings (ordinary use buildings) takes into account the two-dimensional phenomena of accumulation and transport: heat transfer by thermal conduction as a function of humidity, latent heat transfer by vapour diffusion, accumulation of moisture by vapour sorption and capillary moisture transfer by diffusion of vapour, moisture transfer in fluid transport (surface diffusion and capillary conduction). The following climatic variables are considered too: indoor and outdoor temperature, indoor and outdoor humidity, solar radiation and long wave.
In a second step, an experimental design was carried out with wood fibre material. An innovative method to assess the resistance of a wood fibre material was developed. The impact of relative humidity and temperature on mould growth was discussed.
In a third step, two use classes were proposed for bio-based insulation materials.
2 MATERIAL AND METHODS
2.1 Characterization of thermal and humidity conditions in insulation materials layers
Thermal and moisture transfers
The enthalpy variation is mainly due to two distinct phenomena: first the gradient of the density of heat flow, proportional to the conductivity of the material and to the temperature gradient (Fourier law) and also the gradient flow heat transported by the flow of moisture. By hypothesis, only the heat content caused by the phase change (liquid - vapour) is kept (the liquid water heat capacity and steam are much lower than the latent heat of vaporization). The transfer of moisture is done by the liquid phase and vapour phase.
Boundary conditions
If limit conditions are of Neumann type (imposed flow) vapour concentration at the material border is established by convective transfer, modelled by an exchange law of this type:
]
)
(
)
[(
v border v environment m vh
p
p
g
=
−
(1) gv is the vapour flow density, hm is the coefficient ofmass convective exchange and pv is the vapour
pressure.
In parallel there are two types of heat transfers to the borders, either convective or radiative. The law resulting convective heat exchange is similar to the previous one involving heat transfer coefficient hc
]
[
border environmentc
T
T
h
q
=
−
(2) q is the heat flow density and T the temperatureIn free fluids there is a relationship between hc and hm:
t environmen v c m
D
h
h
λ
0=
(3)Dv0 is the coefficient of vapour diffusion in the air (m²s -1)
Environments
French climates of outdoor environment used in the calculations were chosen: an unfavourable cold climate (Nancy), an oceanic climate (Brest), a mountain climate (La Pesse), a Mediterranean climate (Nice). The indoor temperature is at 20°C during winter. In the summer, the indoor temperature is calculated in function of the sunshine and of the outdoor temperature with a phase shift.
About humidity, in winter (October 1 – April 30) we have: 3 3 _ int _ v ext 5.10 kg/m v =ρ + − ρ e.g. ) ( ) 10 . 5 ) ( ( int int 3 int T P M RT RT M T P RH RH sat ext ext sat ext× × + × = − (4) RH is relative humidity, Psat the saturation vapour
pressure, R the perfect gas constant and 5.10-3 kg/m3
is the French standard hygrometry rate for medium hygrometry buildings (maximal hygrometry rate for building studied during this project)
In summer (May 1 – September 30), the indoor temperature increases gradually from the 1st May to
the 1st June from 20°C to 25°C. Then this temperature of 25°C is kept constant until the 1st of September. Finally the temperature decreases gradually from the 1st September to 30th September to 20°C. Also in summer, indoor relative humidity is calculated as below: ) ( ) ) ( ( int int int T P M RT RT M T P RH RH sat ext ext sat ext× × × = (5)
Configurations of walls and roofs selected and studied Tab 1: Selected configurations
Type Insulation position / vapour barrier
(VB) Insulation material Comments
Walls
Concrete or masonry
Internal insulation with VB 4
Thermal resistance = 3,7 m².K/W Internal insulation without VB 4
External insulation + ventilated cladding 4 Timber
frame More than 250 configurations Straw Timber frame wall + straw 1
vapour regulation with coatings (factor 3 on Sd values interior / exterior) Roofs Roof void
with VB 4 Thermal resistance = 7 m².K/W without VB 4
Rampant
with VB 4 Thermal resistance = 7 m².K/W without VB 4
Sarking Wood fibre 110 kg/m3
Thermal resistance = 7 m².K/W
The choice of these different configurations was done by the project steering committee, according to the French building good practices.
The four insulation materials were: wood fibre panels, loose-fill cellulose, cotton panels, and hemp fibre panels. All these parameters have been crossed, leading to over 350 configurations.
Calculation means
"WUFI 2D" is a software for finite element analysis. This software is based on solving the equations defined above and simulates heat, water vapour and liquid water transfers. The software WUFI 2D, based on input parameters, allows simulating the temperature and humidity in all products forming the building element.
2.2 Experimental design
A specific experimental design to study precisely influence of temperature and relative humidity on mould development was needed to direct the analysis of the numerous calculation results.
A full factorial design with 2 factors (temperature and relative humidity) was performed with one selected insulation material based on wood fibre panel. 2 results were studied: the mould growth and the moisture content of insulation material. For each result studied, 4 tests were carried out (with 4 replicates each) : 20°C 95% RH, 28°C 95% RH, 20°C 70% RH, 28°C 70% RH. An central point was tested (4 replicates): 24°C 85% RH. An additional test was tested:12°C 95% RH.
Sterilization of test materials prior to mould tests
To avoid contaminants prior the fungal test, all test specimens were put in polyethylene bags and sterilized by gamma radiation at 25kGy.
Test insulation material
Untreated wood fibre based panels were cut into test specimens of 6.1cm x 6.1cm x 0.8 cm. Four replicates were prepared per test condition and were sterilized as described in 2.2
Fungal strains
Aspergillus niger (MNHN-48-521), Chaetomium globosum (BAM ATCC 6205) and Penicillium funiculosum (MNHN 561527) were grown separately
on malt (4%m/m) agar (2% m/m) medium at 22°C±2°C and 70%±5% of relative humidity (RH) for 3 to 4 weeks. Conidia of each strain were prepared as follow. Demineralised sterile water (with 0.9% of NaCl and 0.05% of Tween 80) was added to the culture. The shaken fungal solution was filtered in sterile conditions on gauze and was centrifuged 3 times at 2000 g for 20 minutes, thus suspended 3 times in sterile water with NaCl and Tween80. After counting on a Malassez cell under a microscope (Leica, DM750), the 3 fungal solutions were diluted then mixed with the same concentration of conidia in order to finally spray the insulation material.
Controls
The cultivability of the fungal conidia was checked by inoculating 0.1 mL of the fungal inoculation solution in 2 Petri dishes malt (4% agar 2%) per dilution (8 dilutions). Petri dishes were stored at 22°C±2°C and 70%±5% RH. After 3 to 5 days, counting of Colony Forming Units (CFU) was carried out.
Inoculation of the test insulation material with moulds and incubation
Wood fibre test specimens were artificially contaminated with a spray of 1.3x10⁴ cultivable conidia per cm² under sterile conditions, put in sterile Petri dishes and maintained for 4 weeks in 6 different climate rooms (Binder, APT Linne KBF 115- Memmert, CTC256 -CTS, C40/600 and climate rooms ) : 20°C C±2°C and 95%±5% RH, 28°C C±2°C and 95%±5% RH, 20°C C±2°C and 70%±5% RH, 28°C C±2°C and 70%±5% RH, 24°C C±2°C and 85%±5% RH, 12°C C±2°C and 95%±5% RH.
Quantitative assessment of cultivable fungal units
Prior the incubation and after the inoculation of test specimens, 4 test specimens were analysed to assess the initial cultivable fungal units that were sprayed on the test specimens. Each test specimen was homogenised in sterile demineralised water (NaCl 0.9% and Tween 80 0.05%). A series of dilution of this solution was inoculated on malt (4%) agar (2%) Petri dishes thus allowing the counting of cultivable fungal units (Colony Forming Unit/ Petri dish) after 3 to 5 days at ±2°C and 70%±5% RH. At the end of the test, each test specimen was analysed to assess the cultivable fungal units (CFU/ Petri dish) once exposed to each climatic condition. The number of CFU/ Petri dish was used to calculate the number of CFU / Test specimen thus allowing the calculation of the number of CFU/ cm² of insulation material. Values were transformed in log10 CFU/cm² as the logarithm (10) is the usual
microbiological unit.
Moisture content measurement of test specimens
At the end of the test 3 test specimens were weighed: m1 (g) (balance with 0.001 g precision). The test
specimens were dried at 70°C (Binder, ED 115)) for 2 days and were weighed: m2 (g) (balance with 0.001 g
precision). The mean moisture content (MC) was calculated: 2 2 1
100
(%)
m
m
m
MC
=
×
−
(6) Expression of resultsResults of initial load of cultivable fungal units (T0: beginning of the test) were compared with the number of cultivable fungal units at the end of the test (T4 weeks: end of the test). Results were in log10 CFU/cm²
of insulation material. Results of moisture content (MC) in wood fibre specimens were expressed as mean values (%).
3 RESULTS
3.1 Experimental design with wood fibre insulation panels
To assess the impact of relative humidity and temperature on the mould growth and on the insulation material moisture content, an experimental design was performed. A factorial design with 2 factors (temperature and relative humidity) was performed. Two results were studied: mould growth in insulation material after 4 weeks an moisture content of insulation material after 4 weeks.
The selected model was untreated wood fibre material. A new test method based on quantitative analysis of mould growth was developed. Fibre wood specimens were inoculated with moulds and were submitted to six different climates. The mould growth was assessed at
the beginning of the test (T0) and at the end of the test (T4 weeks). The final number of cultivable fungal units was compared to the initial load of cultivable fungal units in order to detect a mould growth. At T0, the initial load of moulds was 3.65 log10 CFU/cm².
Effect of the relative humidity and the temperature on the mould development
28 24 20 4,0 3,5 3,0 2,5 2,0 1,5 95,0 82,5 70,0 Temperature °C M o u ld g ro w th ( lo g 1 0 C FU / c m ² ) Relative humidity % Top Centre dot kind
Fig.1: Effect of the main factors on the mould growth in a wood fibre material (mean values in log10 CFU/cm²).
As shown in Fig.1 in the temperature graph, the slope is nearly flat. The temperature (in the tested range) had no effect on mould growth. The relative humidity graph showed a high slope thus indicating a high impact on mould growth. Moreover both the temperature effect and the relative humidity effect were not linear as the central points are far from the straight lines. In addition, interactions of these two factors were not significant (graph not shown).
Results are presented in Fig.2.
Fig.2: Number of cultivable fungal units in the wood fibre test panel (log10 CFU/cm² of test material)
according to 6 different climate conditions. Mean value (n=4 replicates) and standard deviation.
Between 20°C and 28°C, with a constant relative humidity, the temperature did not impact the number of cultivable fungal units per cm² of insulation specimen (Fig.2).
At 12°C and 95% RH, the mould growth was reduced of nearly 1log10 CFU/cm² in comparison with 20°C or
28°C and 95%RH (Fig.2).
The final load of mould at 20°C (3.95 log10 CFU/cm²)
and 28°C (4.00 log10 CFU/cm²) at 95%RH was higher
than the initial load of mould (3.65 log10 CFU/cm²).
95% of relative humidity leads to a mould development on this test material.
Between 20°C and 28°C, with a relative humidity between 70% and 85%, the mould growth was
considerably reduced (between 1.47 and 2.02 log10
CFU/cm²) in comparison with the initial load of moulds. These results indicate that the mould could not develop well in the tested wood fibre material once exposed at 70% to 85% of relative humidity.
Effect of the relative humidity and the temperature on the moisture content of fibre wood specimens
The effect of the main factors on moisture content of wood fibre was studied. Results are detailed in Fig.3.
Fig.3: Moisture content of the tested panel (%m/m) according to 6 different climate conditions. Mean value
(n=4 replicates) and standard deviation (%m/m).
Once exposed to 95% of relative humidity, this wood fibre material reached between 19.8% and 21.5% of moisture content (Fig.3). The moisture content was 13.6% when exposed to a relative humidity of 85%. It was between 10.7% and 10.9% when exposed to 70% of relative humidity. The relative humidity impacted the moisture content of the wood fibre material. However the range of tested temperatures did not impact it. Whereas at 95%RH and 20°C to 28°C, mould grew on this test wood fibre material, it did not grew nor at 85% nor at 70% RH (Fig.3).
3.2 Simulation results dividing
As mentioned in introduction, one of the aims of the project was to determine specific use classes for bio-based insulation materials.
The experimental design described above showed that biological tests did not allow too narrow divisions according to relative humidity.
We also learn that there was no risk of mould growth in this tested wood fibre material when RH did not exceed 85% (within the tested range of temperatures) or when temperature did not exceed 12 °C (within the tested range of relative humidity). This conclusion was valid for the tested wood fibre material..
3.3 Use classes set up
Analysing the results of calculations and because of the precision of the biological tests two use classes where determined:
• A “dry” class with a relative humidity in insulation materials always lower than 85% (or greater than 85% but no more than 48h) during the year.
• A “wet” class with a relative humidity in insulation materials that can be higher than 85% more than 48h per year.
These conditions were determined by analysing the results of the third year on the simulation.
Tab 2: Use class allocation for concrete or masonry walls
Concrete or masonry walls Situation of the
insulation material
Use class of the insulation material
Internal insulation with vapour barrier Dry Internal insulation without vapour barrier Wet External insulation (only one layer) Wet External insulation (more
than one layer) Wet for the first 4 cm on the external side, or the whole layer if its thickness is upper than 4 cm
Dry for the layers outside the external first 4 cm.
Tab 3: Use class allocation for timber frame walls
Timber frame walls
Situation of the insulation material
Use class of the insulation material
On the external side of the vapour barrier Dry On the internal side of the
vapour barrier (thermal resistance < 1/3 wall total thermal resistance)
Wet
On the internal side of the vapour barrier (thermal resistance < 1/4 wall total thermal resistance)
Dry
Straw Dry
3.4 Allocation in the two use classes of insulation materials in real use conditions in the buildings parts
Exploitation of the calculation for the 300 configurations (analysis of RH and temperature in several areas of each configuration) and application of “the worst case scenario” allow the following result synthesis. More than 1500 graphs like Fig. 4 and Fig.5 were produced and analysed in order to fill in the tables 3, 4 and 5 presented in this paper. These graphs were impossible to be detailed in this paper due to the huge amount of results.
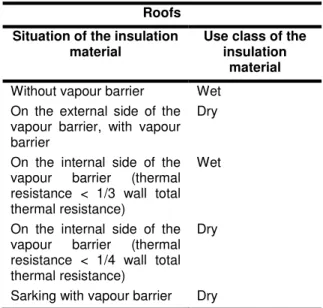
Tab 4: Use class allocation for roofs
Roofs Situation of the insulation
material
Use class of the insulation
material
Without vapour barrier Wet On the external side of the vapour barrier, with vapour barrier
Dry On the internal side of the vapour barrier (thermal resistance < 1/3 wall total thermal resistance)
Wet
On the internal side of the vapour barrier (thermal resistance < 1/4 wall total thermal resistance)
Dry
Sarking with vapour barrier Dry
Tab 5: Use class allocation for other construction parts
Other situations
By default, Wet ; unless if calculations can justify “Dry” conditions.
Example of a wet situation (concrete / internal insulation / without vapour-barrier / wood fibre)
Example of a dry situation (concrete / internal insulation / with vapour-barrier / wood fibre)
Fig. 5: RH and temperature for a Dry situation.
4 DISCUSSION
4.1 Resistance of a tested wood fibre material to moulds according to climatic conditions
Effect of relative humidity
The relative humidity has an impact on mould growth as shown in the results of the experimental design (Fig.1 and Fig.2). Whereas the tested wood fibre material was not resistant to moulds at 95%RH, it was resistant to mould at 85% RH and at 70% RH.
A Finnish research work was done about a mould growth model on pine and spruce Hukka and Viitanen, 1999). There was no mould growth at 75%RH. The lowest humidity condition for mould growth was 80 to 85% which led to a water activity of 0.80-0.85 (Viitanen and Ritschkoff 1991). An important point that can be considered is the water activity requirements for mould fungi. No mould growth was observed whatever the fungus species when the water activity was less than 0.62 (Scott, 1957).
Effect of temperature
Results showed no effect of the temperature range 20°C to 28°C on mould growth (Fig.2). On the other hand at 12°C, the temperature reduced the mould growth. The bibliography indicates optimum of mould growth between 22°C and 35°C (Ayerst, 1966; Panasenko, 1967, Carpenter, 1972, Botton et al. 1990). Whereas psychrophilic strains can develop at temperatures between 0°C and 5°C, thermophilic strains develop at temperatures not exceeding 62°C (Botton et al. 1990).
Thus, the choice of 26°C for the mould test is a “worst case scenario” taking into account both the optimal mould temperature and the highest temperature
obtained from hygrothermal conditions in real building situations.
Generalisation to other bio-based materials
To assess the relevance and the applicability of such tests to other bio-based insulation materials, and to validate the experimental design model, an additional study has just been carried out. Loose fill cellulose, wood fibre, hemp, flax and straw were tested (Le Bayon et al. 2015). The test method to assess the mould resistance was developed.
4.2 Extension of the methodology
This study led to different test requirements in accordance with the end use claimed by insulation manufacturers: real hygrothermal conditions in use can be taken into account.
If an insulation manufacturer targets an end use corresponding to a wet class, a mould test with a relative humidity of 95% could be suitable. If the targeted end use of the insulation material corresponds to a dry class, a mould test with a relative humidity of 85% could be suitable.
Several materials were tested during the project. We created information about hygrothermal behaviour and natural durability of the studied materials. Other insulation materials could be observed as well, including non bio-based materials (cellular plastics, mineral wools…).
The utility of the project results can encourage developing the definition of more use classes, introducing other building parts into the wet or dry classes. We can quote as example of “unknown” hygrothermal conditions the bio-based insulation materials used in flat roof, underfloor crawlspace, breathing walls, insulating coatings…
In addition, it would be possible to extend the methodology to other climate areas, because of course, hygrothermal conditions in insulation layers are directly linked with outside climate.
First of all, in France, we will have to take into account the particularities of our overseas territories: tropical or equatorial climate conditions, specific building techniques and local materials like bagasse (sugar cane residues), vetiver or coconut tree fibre.
5 CONCLUSIONS
Customers of bio-based insulation materials look for “natural” products, free from biocides or other chemical products. One of the conclusions of this project is the possibility for the manufacturer to highlight the natural durability of its products, with the choice of use classes.
This study led to an innovative test method to assess the resistance of bio-based insulation materials to moulds.
Results showed that mould tests need to take into consideration the climatic conditions of insulation materials use in building. Otherwise, results are disconnected from practical and industrial uses. Usual hygrothermal conditions and usual roof and wall configurations in France led to two use classes: • a “dry use class” usually lower than 85%RH
(except for a whole duration not exceeding 48 hours),
• a “wet use class” with a usual relative humidity that can be greater than 85% for more than 48 hours.
Based on the “worst case scenario” of each use class, and on the results from the experimental design, two laboratory test conditions are proposed to assess the resistance of bio-based materials to moulds:
• 85%RH and 26°C to assess bio-based insulation material intended to the “dry use class”
• 95%RH and 26°C to assess bio-based insulation material intended to the “wet use class”
6 AKNOWLEDGEMENTS
We acknowledge the French Ministry of Ecology, Sustainable development, Transport and Housing for its financial support.
7 REFERENCES Paper in a journal:
Ayerst, G. Influence of physical factors on deterioration by moulds. Society of Chemical Industry Monograph, 1966, 23, pp.14-20.
Botton, B.; Breton, A.; Fevre, M; Gauthier, S. et al. Moisissures utiles et nuisibles. Importance industrielle. 1990, Masson 2ème édition. P312-313, 512p.
Brunekreef, B.; Dockery, D.W.; Speizer, F.E.; Ware, J.H.; Spengler, J.D.; Ferris, B.G. Home dampness and respiratory morbidity in children. Am. Rev. Respir. Dis., 1989, 140, pp.1363–1367.
Carpenter, P.L.. .Microbiology. W.B. Saunders Company, 1972, New York.
Gravesen, S.; Nielsen, P.A.; Iversen, R.; Nielsen, K.F. Microfungal contamination of damp buildings— examples of risk constructionsand risk materials.
Environ. Health Perspect., 1999, 107 (sup.3), pp.505–
508.
Hukka, A. and Viitanen H.A. A mathematical model of mould growth on wooden timber. Wood Science Technology, 1999, 33, 475-485.
Hunter, C. A.; Grant, C.; Flannigan, B.; Bravery, A. F.; Mould in Buildings : the Air Spora of Domestic Dwellings. Int. Biodeterior., 1988, 24: 81-101.
Koskinen, O.;, Husman, T.; Meklin, T.; Nevalainen, A.; Adverse health effects in children associated with moisture and mold observations in houses. Int. J.
Environ. Health, 1999, R 9, pp. 143–156.
Moularat, S; Derbez, M; Kirchner, S; Ramalho, O.; Robine, E. Détermination de la contamination fongique des logements français par un indice chimique. .
Pollution Atmosphérique, 2008, 197: 37-44.
Panasenko, V.T. Ecology of microfungi. The botanical
review, 1967, 33, pp.189-215.
Platt, S. D.; Martin, C. J.; Hunt, S. M.; Lewis C. W. Damp housing, mould growth, and symptomatic health state. Brit. Med. J., 1989, 298: 1673-1678.
Scott, W.J. Water relations of food spoilage microorganisms.Adv. Food Res., 1957, 7, pp.83-127
Paper in proceedings:
Le Bayon I.; Draghi, M.; Gabille, M.; Pregnac M.; Jequel, M.; Kutnik, M. Development of a laboratory test method to assess the resistance of bio-based insulation materials against moulds, International Conference on Bio-Based Materials, 2015, Clermont-Ferrand.
Viitanen, H. and Ritschkoff, A.C. Mould growth in pine and spruce sapwood in relation to air humidity and temperature, 1991, Uppsala, Sveriges Lantbruksuniversitet: 33.
Technical reports or thesis:
Adan, O.C.G. On the fungal defacement of interior finishes. Ph.D. Dissertation, Eindhoven University, The Netherlands, 1994.
Conseil Supérieur d’Hygiène Publique de France.. Contaminations fongiques en milieux intérieurs. Diagnostic, effets sur la santé respiratoire, conduites à tenir. France. Groupe de travail « Moisissures dans l’habitat ». Septembre 2006.
Standards
ASTM C1338. 2008. Standard test method for determining fungi resistance of insulation materials and facings. AFNOR. 3p.
EN15101-1. 2014. Thermal insulation products for buildings. In-situ formed loose cellulose (LFCI) products. Part 1: Specifications for the products before installation. Annex F: Method for determining mould fungi resistance. 64p.
NF EN ISO846. 1997. Plastics. Evaluation of the action of microorganisms. 23p.