O
pen
A
rchive
T
OULOUSE
A
rchive
O
uverte (
OATAO
)
OATAO is an open access repository that collects the work of Toulouse researchers and
makes it freely available over the web where possible.
This is an author-deposited version published in :
http://oatao.univ-toulouse.fr/
Eprints ID : 15549
To link to this article : DOI:10.1021/acs.langmuir.5b04218
URL : http://dx.doi.org/10.1021/acs.langmuir.5b04218
To cite this version :
Sendekie, Zenamarkos Bantie and Bacchin,
Patrice Colloidal Jamming Dynamics in Microchannel Bottlenecks.
(2016) Langmuir, vol. 32 (n° 6). pp. 1478-1488. ISSN 0743-7463
Any correspondence concerning this service should be sent to the repository
administrator: [email protected]
Colloidal Jamming Dynamics in Microchannel Bottlenecks
Zenamarkos B. Sendekie
*
,†,‡and Patrice Bacchin
†,‡†
Laboratoire de Génie Chimique, Université Toulouse III, 118 Route de Narbonne, F-31062 Toulouse, France
‡
CNRS, UMR 5503, F-31062 Toulouse, France
ABSTRACT: The purpose of this work is to examine the interplay between hydrodynamic conditions and physicochemical interactions from filtration experiments of microparticles. Experiments are performed in microfluidic filters with real-time visualization at pore scale. Both flow rate and pressure are measured with time to analyze the dynamics of pore clogging and permeability. Flux stepping experiments are performed at different physicochemical conditions to determine the different clogging conditions. The results allow distinguishing different clogging behaviors according to filtration conditions which are discussed by considering particle−particle and particle−wall colloidal interactions whose main characteristics are an important repulsive barrier at 0.01 mM, a significant secondary minimum at 10 mM, and low repulsive barrier at 100 mM. Clogging delay at moderate ionic strength and deposit fragility and associated sweeping out of aggregates of particles at high ionic strength are discussed from the deposit structure, specific resistance, and deposit relaxation analyses. It has also been observed that an opening angle at microchannel entrance causes rapid clogging, this effect being more
pronounced when the repulsion is partially screened. Three different scenarios are discussed by analogy to crowd swarming: panic scenario (0.01 mM) where repulsion between particles induce pushing effects leading to the creation of robust arches at pore entrances; herding instinct scenario (10 mM) where the attraction (in secondary minima) between particles enhances the transport in pores and delays clogging; and sacrifice scenario (100 mM) where the capture efficiency is high but the aggregate formed at the wall is fragile.
1. INTRODUCTION
Transport and deposition of microparticles in porous media is of primary importance in many fields of science and process engineering. In such systems, pore clogging phenomena can have dramatic consequences. A lot of studies have then been performed for better understanding of the cause and the consequence of clogging for different discrete objects in different application fields. These studies cover systems of very different nature and spectrum such as colloidal dispersions for transport in soil, in blood vessels, in filtration processes, or in continuous flow reactors; granular materials for flow interruptions in silos; person or animal for panic disorder; vehicles for traffic jam, etc. Clogging can be understood as a transition between different flow regimes1 and then linked to jamming phenomena,2 the jamming being defined as the conversion of a liquid system into a solid by imposed stress.3 Different parameters can induce the unclogged/clogged states: the driving force (flow velocity), the constriction geometry (particle/constriction size ratio), and the background noise (Brownian motion, external excitation, etc.).1The liquid/solid transition appears when a unidirectional load is applied on a concentrated dispersion of particles,2leading to the formation of force chains between particles forming a solid clog at the constriction level. When formed, the clog is considered as a “fragile matter”.2,3The fragility of the clog depends on how the system came to be jammed (“construction history”).2 These authors also defined the concept of “bulk fragility” or
“boundary fragility” to explain the way clogs can be liquefied under stresses. For example, if a force different to the unidirectional load leading to the clog formation is imposed at the base of the clog (i.e., the bond between the clog and the wall), it is certain that boundary fragility will occur: the boundary bonds will be broken, leading to clog fragility. In general, clogging occurs when an important number of discrete units pass through a constriction, i.e., competition of too many units for little space. The development of clogs obstructing the bottleneck can lead to intermittent flow4 and to a partial or a complete blocking of the flow. This dynamic arrest or jamming, which is linked to intriguing rheological properties, occurs in a wide range of applications such as ceramic production, food processing, waste management, pharmaceuticals, cosmetics, medicine, etc.
Clogging has also been linked to a shear-induced gelation.5 The shear stress, when large enough, leads the particles to overcome the interaction barrier forming viscous non-New-tonian clusters that can occupy the available space. The interconnection of these clusters leads to the formation of solid-like gel with specific structure. This gelation process initiates from fractal clusters formed through diffusion-limited aggrega-tion and reacaggrega-tion-limited aggregaaggrega-tion mechanisms. The
clogging is then described as a percolation transition which is also observed for granular materials:6 the interconnection of clusters when they become crowded leads to clogging or jamming. The solidlike transition of stabilized colloidal dispersion has been observed and discussed with a gelation approach when imposing an intense shear by forcing it to pass through microchannels.7 The key events involved in such gelation processes are the aggregation and the breakage of clusters. A breakage number (a dimensionless number that represents the ratio between the shearing energy acting on particles to the energy required to breakup an interparticle bond) has been introduced to define hydrodynamic conditions within microchannels where the shear rate is large enough to lead to clusters breakage. This regime has been previously reported as being linked to a critical Péclet number that account for the maximum potential barrier and the type of flow.8 Such critical Péclet numbers are very close to the one defined for the aggregation occurring on a membrane:9below the critical value, the aggregation can only take place by Brownian diffusion and then is very slow because of the repulsive potential barrier whereas above the critical value the hydrodynamic force can overcome the potential barrier and then conduct to the aggregation (but also possibly to the aggregate breakage). Finally, the gelation approach of clogging using the Smoluchoski equation framework5 shows a lot of similarities with the mechanical approach of jamming based on force chains,2 and both approaches underline the “soft aspect” of the clogs and the control of the clogging dynamics by their fragility.
With recent new advancements in the microfabrication technology enabling direct visualization of filtration processes, clogging has been experimentally investigated at the pore scale.10 Clogging of a microsystem can occur through successive particle deposition, particle size exclusion, or a combination of these effects depending on the particle size distribution.11Numerical studies revealed that particle
deposi-tion during filtradeposi-tion of colloidal suspensions is controlled by hydrodynamic conditions, fluid properties (ionic strength), and particle and substrate properties.12−15 However, very few of
these simulations accounted for the possibility of particle re-entrainment that seems to be an important event from the experimental studies.
The purpose of this work is to examine the interplay between hydrodynamics and colloidal interactions from clogging analysis during microfluidics filtration experiments. The coupling of colloidal interactions and hydrodynamics makes the analysis of the clogging phenomena complex. There have been studies on separate effects of colloidal interaction and hydrodynamics on clogging. However, for colloidal systems under flow, the interplay between the two factors has a very significant role in the dynamics of the aggregation of particles and the breakage of aggregates controlling the clogging establishment. In this work, we analyze the clogging mechanisms of microchannels using dispersion of charge-stabilized polystyrene latex particles. We vary the ionic strength of the suspension and the flow rate in order to explore the effect of the coupling between the colloidal interactions and the hydrodynamics on the filtration dynamics, the critical flux, the deposit morphology, and clog fragility. Dispersions with three well different interaction profiles are filtered through microchannels bottlenecks, and the flow rate is varied by about 2 orders of magnitude. Additionally, and in order to further analyze the fragility of the clogs, the complexity
of the geometry will be investigated by using two bottleneck shapes (squared and tilted angle microchannel entrances).
2. EXPERIMENTAL METHODS
The experiments in this work have been performed with microfluidic devices fabricated with OSTEmerX 322 crystal clear polymer by soft lithography and replica molding techniques16 (see the Supporting Informationsection 1 for the description of the fabrication process). The microfluidic device consists of a main feeding channel (1.7 mm wide) followed by a filtering part constituted of an array of 29 parallel, narrow channels with widths of 10 μm (seeFigure S1). The height of the microchannels and the main channel is 50 μm. The width of the pillars between the channels is 50 μm. Such devices allow realizing separation of microparticles with real-time visualization at pore scale through an optical microscope. The filtration experiments are performed in dead-end mode at both constant pressure and constant flow rate by using Microfluidic Flow Control System (MFCS) and Flowell (from Fluigent) (seeSupporting Informationsection 2 for the description of the experimental setup and the filtration process). During experiments, the flow rate and the pressure are measured with time to analyze the dynamics of the pore clogging and the permeability.
The suspensions used in this experimental work consisted of monodisperse (5 μm in diameter) latex polystyrene microspheres (Invitrogen) dispersed in water. The latex particles are negatively charged with functional sulfate groups on the surface: the zeta potential, measured with a Malvern Zetasizer, is −57 ± 5 mV at pH 7.17 The latex suspensions used in the filtration experiments are obtained by diluting the stock suspension in KCl solution until a volume fraction of 10−5(1.5 × 10⁵particles/mL) is reached. The KCl concentration is varied in the range from 0.01 to 100 mM which allowed modifying the suspension stability by changing the magnitude of the repulsive electrostatic interaction between particles and between particles and the walls of the channels. These concentrations in salt are inferior to the critical concentration for coagulation (CCC) which is observed by sedimentation tests to be above 200 mM. Prior to experiments, the latex suspensions are exposed to ultrasonic waves for 3 min in order to break down aggregates of particles, if any.
During the experiments, filtration conditions are kept in laminar flow regime, and the maximum Reynolds number is 2.39 calculated at the maximum flow velocity (0.0835 m/s) using the channel hydraulic diameter as the characteristic length (the maximum shear rate at the wall being 66 800 s−1). The range of filtration velocities used in our experiments are in the range of those used in membrane micro-filtration (up to 0.015 m/s, based on data for a MF-Millipore membrane with 8 μm pore size, operated at 100 mbar). The inertial effect and the Brownian motion are negligible due to the low Stokes number (10−4) and the high Peclet number (105), respectively.
Three main classes of experiments have been performed in this work: flow stepping, constant pressure, and constant flow rate experiments. The flow stepping experiments are performed by running constant flow rate filtration starting from 5 μL/min and increasing the flow rate by 5 every 10 min until we reach 70 μL/min. The slope for each constant flow rate experiment (i.e., for 5, 10, 15, ..., 70 μL/min) is determined from the flow stepping experiments to evaluate the fouling rate (seeSupporting Informationsection 3, Figure S3). Based on the results from the flow stepping experiments, three different constant flow rate experiments are performed at 15, 30, and 70 μL/min in order to study the effect of the hydrodynamics on the initial stages of the microchannel clogging and the deposit morphology. Constant pressure experiments are performed at 200 mbar. This pressure drop is selected in order to compare the results with constant flow rate experiments since the flow rate with the clean system at this pressure drop is 70 μL/min. All these experiments are performed with low (0.01 mM), moderate (10 mM), and high (100 mM) ionic strength suspensions with at least three times repetition for each run.
3. RESULTS
Filtration experiments with direct observation have been performed with different ionic strength suspensions using a microseparator. The following sections present the results for particle capture and deposit formation dynamics at low (0.01 mM), moderate (10 mM), and high (100 mM) ionic strengths. In section 3.1, flux stepping experiments will be analyzed in order to determine critical flux values for the clog formation.
Section 3.2 will analyze the results obtained in constant flux experiments performed with filtration flux above or below the critical conditions in order to discuss the interplay between hydrodynamic and physicochemical conditions.Section 3.3will present the importance of the microchannel entrance geometry on the clogging formation. Finally, section 3.4 analyzes the influence of the operating conditions on the deposit structure through the determination of the hydraulic resistances and specific deposit resistances.
3.1. Critical Flux Analysis.Flux stepping experiments are performed at different physicochemical conditions under the CCC of the particles to determine the different clogging conditions (Figure 1a). Identifying the clogging conditions is made possible through the monitoring of the pressure drop from the inlet to the outlet with respect to time18and from the microscopic observations. The results in Figure 1a show that particle capture occurs at low flow rates for high ionic strength (100 mM) suspensions. The high repulsion barrier between the particles and the microchannel walls causes a delay in particle capture at low ionic strength (0.01 mM). A huge delay in particle deposition was observed at moderate ionic strength (10 mM). With the microscopic observations, this delay can be linked to temporary deposition and sliding of particles over the walls and finally get swept out. This specific behavior will be discussed insection 4.1.3by considering the significance of the secondary energy minimum and its consequences on the way particles are captured on collectors.19
These results are further substantiated by calculating the fouling rate (see Supporting InformationFigure S3) for each constant flow rate filtration run.Figure 1b presents the fouling rate as a function of the permeate flow rate. Such a plot allows distinguishing critical flux behavior with negligible fouling below the critical flux value and a significant fouling rate above.17The increase in the fouling rate is associated with the formation of dense deposit (inset images inFigure 1b).Figure
1b shows that the fouling rate increases rapidly at low flow rate for the high ionic strength suspensions, and it can be noted that there is a critical flux between 5 and 10 μL/min. There is a gentle increase in slope for the low ionic strength suspensions at a relatively higher flow rate, and the critical flux seems to be between 15 and 20 μL/min. These results are in agreement with theoretical studies,17 demonstrating that the critical flux increases when the colloidal repulsions are more important. For moderate ionic strength, the fouling rate hardly increases until we reach 60 μL/min, after which an abrupt increase is observed. These observations help to realize that surface interactions play an important role in particle capture and hence the jamming of porous media. When the particle−particle and particle−wall interactions are strongly screened out (e.g., in the case of 100 mM suspension), the drag force overcomes the repulsive DLVO forces at low flow rate and particles are captured easily leading to clogging. At high repulsive forces, particle capture is delayed, and the clogging is controlled by many-body interactions. The dynamics of particle capture is very much progressive for moderate ionic strength due to the significant role of secondary energy minimum: this specific behavior will be discussed insection 4.1.3.Figure 1a also shows that at high flow rates important permeability fluctuations are observed. Thanks to microscopic observations, these variations are related to the collapse of jammed particles network that are expelled through the microchannels when the force chains formed by the particles are overcome by the flow.
3.2. Constant Flow Rate Filtrations.Based on the results from the flow stepping experiments, constant flow rate experiments are performed at three flow rates (15, 30, and 70 μL/min) with low (Figure 2a), moderate (Figure 2b), and high (Figure 2c) ionic strengths to study the effect of hydrodynamics on the clogging phenomena. The dynamics of particle deposit buildup is strongly dependent on the solution chemistry.Figure 2a shows that there is no increase in pressure drop at 15 μL/ min but only small fluctuations, while there is significant increase in pressure drop at 30 μL/min after collecting 0.5 mL permeate volume. Thus, a critical flux leading to deposit has been overcome between 15 and 30 μL/min. Above the critical flux, the drag force acting on particles overcomes the particle− wall repulsive interactions leading to adhesion of particles onto the microchannel walls. These results are in agreement with the critical flux measurements done with flux stepping method
Figure 1.(a) Flow stepping experiments at different solution ionic strengths: 0.01, 10, and 100 mM of KCl. (b) Fouling rates calculated from the flow stepping curves. The inset images are observations for 10 mM suspensions before and after deposit formation.
(Figure 1b). At high flow rate (70 μL/min), one can note a more progressive increase in pressure until a certain permeate volume is collected (1 mL), after which the pressure drop increases by about 50 mbar. It seems that the hydrodynamic force is not only able to overcome the repulsive forces for particle capture but is also able to break the interparticle and particle−wall bonding forces. However, when clogging is initiated after 1 mL, the pressure increases rapidly: filtration of 0.5 mL leads to a pressure increase of 700 mbar. The pressure increment is less important for lower flow rate: at 30 μL/min, the pressure increases by 500 mbar for the same permeate volume. This difference is related to the difference in the deposit morphology formed.
At high ionic strength (100 mM in Figure 2c), increase of pressure is observed even at low permeate flux (15 μL/min). As for the low ionic strength, high velocity seems to delay the formation of clogs and deposit on the surface. With the microscopic observation, this effect is associated with frequent formation of clogs but that are often broken by the flow. After clogs are formed, the pressure increases by a value of 700 mbar while the permeate volume collected is about 0.75 mL at 70 μL/min; the corresponding volume for the same pressure increment is about 1.375 mL at 30 μL/min (Figure 2c). A relatively different behavior is observed for the moderate ionic strength (10 mM inFigure 2b). In these conditions, the flow rate is always enhancing the clogs formation, but the time (or the filtered volume) at which they are appearing is significantly delayed: for 30 μL/min, the clogging appears after 3.5 mL permeate volume is collected whereas this volume is 0.5 mL at 0.01 mM ionic strength. The pressure reaches 1 bar after about 5.5 mL permeate flow: the corresponding value for 100 mM ionic strength is about 2.25 mL (reduced by half). These results will be further analyzed and discussed by considering the effect of the coupling of colloidal interaction and hydrodynamic forces on the clogs formation and breakage in theDiscussion
section.
3.3. Microchannel Entrance Geometry Effect. The discrete geometry of the filter surface can have a significant impact on particle deposition, deposit morphology, and the subsequent permeability reduction particularly at the very first steps of deposit formation. The set of experiments presented in this section will investigate the effect of the discrete geometry of the filter surface on the deposition kinetics.
Two different microchannel entrance geometries (entrances with square pillars and entrances with tilted angle pillars at 45°) are designed to study the effect of microchannel opening on the jamming probabilities (Figure 3a,b). These geometry designs represent the two extremes that we can have on surfaces of separation systems, i.e., flat surfaces and sharply grooved surfaces. These entrance geometries can have significant effect on the jamming probability.Figure 3c presents the decrease in flow rate with time for constant pressure experiments realized with two ionic strength suspensions (0.01 and 100 mM) and for microchannels having square (DS10) and tilted angle (DT10) shapes. In these set of experiments, one can note the opposite effect of the increase in ionic strength (from 0.01 to 100 mM) on the permeability decrease. For square shape, increasing ionic strength leads to a lower permeability decline. As shown previously in Figure 2c for constant flow experi-ments, this effect seems to be due to the high fragility of the clogs: it is possible to see frequent expulsion of such clogs through the channels (second image inFigure 3a). Contrary to this, the increase in ionic strength leads to a more rapid clogging of the microchannels for tilted shape (the worst conditions for this set of experiments). The decrease of the permeability is severe, and the microchannels are almost totally clogged after 0.2 mL of permeate volume. These results underline the important role played by the bottleneck shape on the first steps of clogs formation as it was underlined previously21with consequences on the clogging kinetics (discussed insection 4.2). Greater particles deposition on the surfaces of square pillars was observed, and this is due to the larger forward flow stagnation surfaces available with this geometry. Greater capture of particles on the surfaces of the square pillars decreases the funnelling of particles into the constriction resulting in less permeability loss compared to the
Figure 2.Pressure drop vs cumulative permeate volume at different flow rates (15, 30, and 70 μL/min) for different solution ionic strengths: (a) 0.01, (b) 10, and (c) 100 mM.
tilted shape geometry where the funnelling is inevitable. This principle is in agreement with the classical filtration theory.22
Tong et al.23 observed temporal increases in colloid deposition rate (also called filter ripening) by carboxylate-modified polystyrene latex microspheres of sizes ranging from 0.1 to 2.0 μm in packed porous media with spheroidal grains. They reported that the transition from “clean bed” deposition to ripening was triggered by relatively subtle changes in solution chemistry and fluid velocity: slight increase in solution ionic strength and slight decrease in fluid velocity led to ripening for all microsphere sizes. The ripening was formed at
grain-to-grain contacts due to the funnelling of fluid flow into these areas, which shows very close similarities with our case of tilted shape channels.
3.4. Deposit Characteristics. The previous section was analyzing the clogging kinetics. Here, we will focus on the deposit characteristics. Figure 4a shows the evaluations of the additional hydrodynamic resistances with the cumulative permeate volume collected for both constant pressure and constant flow filtration experiments performed with low, moderate, and high ionic strength suspensions. The additional resistances are induced by particle deposition and are calculated for constant pressure and constant flow rate experiments using the equations Ra/R0= (J0/J) − 1 and Ra/R0= (ΔP/ΔP0) − 1,
respectively, which are derived from the filtration equation. Ra
is the total resistance after deposit formation, R0 the clean
system resistance, J the evolving flux with time, J0the flux for
the clean system, ΔP the evolving pressure drop with time, and ΔP0the pressure drop for the clean system.
The additional hydraulic resistance generally increases more rapidly for constant flow rate mode compared to constant pressure. This effect could be linked to the kinetics (constant pressure mode can be considered as self-regulatedthe clogging reduces the flow and then the particle flux coming to the membrane) or to the difference in the specific deposit resistance (because of a difference in the morphological properties). To go further in the analysis, Figure 4b shows the variation of the specific deposit resistance for both constant pressure and constant flow rate experiments at low and high ionic strengths. This specific deposit resistance is calculated from the measurement of the mean deposit thickness from microscopic observations. The specific deposit resistance is then the ratio of the hydraulic resistance (Figure 4a) to the mean deposit thickness. Higher specific deposit resistances are observed for low ionic strength suspensions (Figure 4b). This could be due to the formation of denser deposit because of the repulsive interaction: repulsion interaction leads to a reorganization before contact. This reorganization of particles gives rise to a more compact deposit structure. For similar conditions, the deposit created with a higher ionic strength have lower specific deposit resistance: this can be explained by the more open structure of the deposit formed in attractive conditions, i.e., for adhesion of particles at the first contact. The
Figure 3.Microchannel bottleneck geometry effect on the clogging process during filtration of latex suspensions with demonstration of the typical particle deposition patterns: (a) for microchannels with square pillars entrance geometry, DS10; (b) for microchannels with tilted pillars, DT10; (c) filtration results at constant pressure (200 mbar) for the two geometries with low (0.01 mM) and high (100 mM) ionic strengths. D denotes dead-end flow, S and T denote square and tilted pillars, respectively, and 10 is the channel width.
Figure 4.(a) Comparison of additional hydrodynamic resistances at low (0.01 mM), moderate (10 mM), and high (100 mM) ionic strengths. (b) Specific deposit resistances for low (0.01 mM) and high (100 mM) solution ionic strengths. The experiments are performed at constant pressure (200 mbar) and constant flow rate (70 μL/min).
specific deposit resistance with high ionic strength at constant flow rate exceptionally increases with time. This could be due to the fragility of the deposit (due to its loose structure) and the resulting restructuring as the filtration proceeds (discussed insection 4.1.2).
The specific deposit resistance is higher for experiments performed at constant flow rate allowing internal reorganiza-tion. This effect is more pronounced for low ionic strength suspensions due to the formation of relatively ordered deposit. The lowest specific deposit resistance is obtained with high ionic strength suspensions (loose deposit) formed during constant pressure filtration (low reorganization).
4. DISCUSSION
The experiments have shown the sensitivity of the clogs formation at the pore entrance and of the clogs structure to the hydrodynamics and the surface interactions: a strong coupling exists between hydrodynamics and multibody surface inter-actions. The mechanisms involved in the clogging are different according to the hydrodynamic/interaction balance. The following section highlights original features and clogging scenarios brought by these experiments.
4.1. Interplay between Surface Interaction and Hydrodynamics.The permeability variations induced by the formation of clogs with filtration time can be summarized in
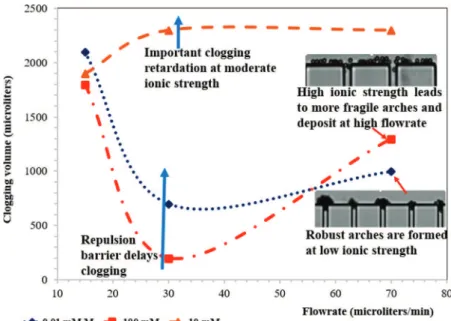
Figure 5by plotting the couple of conditions (filtered volume and flow rate) leading to a significant fouling (through a criteria on the additional hydraulic resistance). The criteria taken for this plot is an additional resistance equal to the initial resistance to the clean system (i.e., Ra/R0= 1). Such criteria correspond to
a filtration volume (called hereafter clogging volume) where the filtration flux is half the clean system flux for pressure driven flow and is then an indicator of a significant clogging. The results obtained for 0.01 and 100 mM show that deposition is lower (or the clogging volume is higher) at very low or at very high velocities. The clogging is then maximized at intermediate flow rate. For example, for 100 mM suspension, about 2100 and 1300 μL permeate volumes are collected before a significant fouling at flow rates of 15 and 70 μL/min, respectively, while the corresponding volume at 30 μL/min is
about 150 μL. These results are in agreement with previous studies of filtration in microchannels24 that often show no clogging zone for extreme flow rates. The results obtained for 10 mM are significantly different and show an important delay in clogging. About 2300 μL permeate volume is collected at 30 μL/min before clogging.
These clogging scenarios can be discussed by considering colloidal interactions whose main characteristics are an important repulsive barrier at 0.01 mM, a significant secondary minimum at 10 mM, and low repulsive barrier at 100 mM (as summarized inTable 1from the DLVO calculations presented
in Supporting Information Figure S4). These results allow distinguishing different behaviors (Figure 5) according to filtration conditions that will be discussed in the next sections: a zone at low flow rate where the repulsive potential barrier prevents the clogging due to the relative importance of particle−particle interactions compared to particle−wall interactions (discussed in section 4.1.1); a zone at high flow rate where the fragility and the re-entrainment of particles are significant when aggregates are formed with high ionic strength (high sweeping out by the shear rate) mainly because of the significant role played by particle−wall interactions (discussed insection 4.1.2); an important delay in clogging at moderate
Figure 5.Filtered volume leading to clogging determined for different filtration flow rates and for different ionic strengths.
Table 1. Values of the Double Layer Thickness (λD),
Secondary Energy Minima (U2,min°/KBT), and the Repulsion
Barrier (Umax/KBT) Calculated from the DLVO Theory at
Low (0.01 mM), Moderate (10 mM), and High Ionic (100 mM) Strengthsa
[KCl] (mM) λD(nm) U2,min°/KBT Umax/KBT
0.01 92.6 −0.084 9620
10 3.04 −22.1 5700
100 0.962 −92.6 3100
aThe modified Hamaker formula and the Sader−Carnie−Chan
equation are used to calculate the van der Waals attractions and the electrostatic interactions, respectively.20 The details of these calculations and the interaction energy potential curves for the different ionic strengths can be found in theSupporting Information, section 4).
ionic strength because of the secondary minima (discussed in
section 4.1.3). These behaviors, summarized in the first lines of
Table 2, are discussed in the next subsections.
4.1.1. Potential Barrier Limited Clogs. For relatively low flow rates (below 30 μL/min), the clogging volume decreased when the ionic strength increased (except for the 10 mM case that will be discussed insection 4.1.3). This result is expected (according to the DLVO theory and its application to slow regime of coagulation) and has been observed for various deposition configurations: a gradual increase in the attachment efficiency on collectors has been observed with increasing KCl concentration in packed column.25 As the electrolyte concentration increases, the repulsive potential barrier (or the stability ratio) is reduced, and as a result, the attachment efficiency is increased. In the same way, the increase in particle−wall collision efficiency should make more probable the formation of arches and clogs: arches being initiated by deposition of particles at microchannel corners. In these conditions, where the drag force is the acting force leading to overcome the potential barrier, increasing the flow rate reduces the clogging volume. Such results are coherent with the theory describing the shear-induced aggregation of colloids as an activated rate process where the potential barrier between colloids is crossed by the shear energy.8
4.1.2. Clogs Limited by Their Shear Fragility.In contrast to intermediate flow rate, high flow rate leads to an increase of the clogging volume (retardation of the clogging). Analysis of the microscopic images shows frequent clogs collapse and sweeping out of the associated fragments through the microchannels. The fragility of the clogs seems then to be the main limiting effect controlling the clogging process dynamics. In these conditions, it is possible to note that the permeability decrease is less severe for 100 mM than for 0.01 mM salt concentration. The clogs
formed at 0.01 mM are more robust and more resistant to the shear: the clogs collapse and sweeping out phenomena are rarely observed. In comparison, the fragility of the clogs formed at 100 mM (low repulsive potential barrier) is more important (see inset images inFigure 5).
To further investigate this vulnerability to fragility, the flow rate was suddenly stopped after forming thick deposit and different patterns of deposit relaxation have been observed depending on the solution chemistry. The images taken 10 s after stopping the flow rate are presented in Figure 6. The deposit relaxation is very different for 100 and 0.01 mM. For 0.01 mM, the relaxation shows either the dispersion of a loose layer close to the upstream part of the deposit (Figure 6b) or the detachment of large bands of the deposit which show rather cohesive aspect (Figure 6a). Contrary to this, relaxation of the deposit formed with 100 mM suspension is characterized by disintegration of the deposit into small aggregates or clusters (Figure 6d). This difference can also be linked to the hydraulic resistance of the deposit that has been estimated inFigure 4a (section 3.4). Such results reinforce the notion of dense and cohesive solid structure (clogs and deposit) with 0.01 mM and loose and fragile structure with 100 mM salt concentrations. Relaxation of the deposit formed with 10 mM salt concentration results in detachment of large bands of deposit with large amount of small fragments (primary particles, duplex, triplex, etc.) of particles (Figure 6c).
These results are qualitatively in agreement with the results usually obtained in aggregation conditions under diffusion and interaction coupling (quiescent conditions). It is known that aggregates formed under diffusion-limited cluster aggregation (DLCA) conditions (higher salinity) have loose structure with low fractal dimension while aggregates formed by reaction-limited cluster aggregation (RLCA) conditions (lower salinity) Table 2. Mechanisms Involved by the Coupling between Hydrodynamic and Surface Interaction Leading to Three Different Clogging Scenarios
ionic strength (mM) 0.01 10 100
interaction outline repulsion attraction/repulsion attraction/contact coupling of
hydrodynamic with potential barrier secondary minimum primary minimum collective effect interaction pushing effect interaction pulling effect
clogging mechanisms clogs formation prevented by potential barrier
clogs formation prevented by gliding phenomena (slippery bond)
clogs limited by the fragility to shear/high collision efficiency
clogging formation few clogs but robust/dense and
cohesive deposit gliding behavior/delay for clog formation a lot of clogs but fragile/loose andnoncohesive deposit main transitions order under constraint competition
for space spontaneous order cooperation for space lowcollision efficiency high collision efficiency scenario the panic the herding instinct the sacrifice
Figure 6.Deposit relaxation observations. The images correspond to deposits formed with (a) 0.01 mM KCl after a constant flux filtration, (b) 0.01 mM KCl after a constant pressure filtration, (c) 10 mM KCl after a constant flux filtration, and (d) 100 mM KCl after a constant flux filtration.
exhibit more compact structure with higher fractal dimension.26 Experiment and simulation show that the breakage rate of the dense aggregates is smaller than that of the open aggregates for the same hydrodynamic stress.27
The role played by the fragility to explain the dynamics (and the flow intermittence) of clogging and jamming in sheared conditions has been discussed in theIntroduction. The fragility of the clog depends on how the system came to be jammed (“construction history”).2Thus, it can be noted here that when the clogs construction is rapid (the case with high ionic strength suspension), the structure of the clog is open and then is more fragile. Theoretical development28 have shown that open aggregates can collapse as soon as the flow induced drift acting on the aggregate structure is in the same order of magnitude with the intermolecular bonding forces: a breakup of few bonds in the aggregate interior by the flow leads to the collapse of the whole aggregate. Clogs formed with conditions of high repulsion (low ionic strength), and hence slower construction history, are more robust. Numerical simulations evidenced the effect of repulsive interaction magnitude on the clog structure and density.10,14The force chains that sustain the clogs are stronger and probably more important (the coordination number in dense aggregate is higher) when aggregates are formed with more repulsive conditions. A change in flow conditions (and in the compression axis) does not allow then to break the clogs: the compatible load of the clog (according to Cates’s2 approach) is higher. Theories28 demonstrate that in conditions of dense aggregates (in the limit of nonfractal aggregates) the collapse mechanism is replaced by a surface erosion mechanism. The robustness of the clogs is further discussed insection 4.2.
4.1.3. Secondary Minimum Leading to Gliding Phenom-ena. A surprising observation has been obtained for micro-particles dispersed in 10 mM KCl solution: the results being uncorrelated to the ones obtained at high ionic strength. An important delay in clogging is observed at moderate ionic strength. At 0.01 mM, a significant clogging is observed after filtering 0.7 mL of permeate volume whereas the corresponding permeate volume for 10 mM to observe such a clogging is 2.2 mL. The propensity to clog is then reduced when the repulsive barrier is partially screened; this trend is opposite to the one expected from DLVO theory for aggregation discussed in the previous section. But microscopic observation of the dynamic behavior of particles at the beginning of the filtration in such conditions can explain this particular behavior. In these conditions, the particles are collected preferentially in the downstream corner of the pillars (Figure 7), and the particle capture in the upstream zone of the pillars is almost nonvisible or, if any, very short-lived.
Such an observation can be linked to the existence of a significant secondary energy minimum at 10 mM in KCl (Table 1). The effect of the secondary minimum on the capture of microparticles on collectors has been investigated.19,25,29 The
explanation advanced in this paper is that the secondary minimum helps particles to translate or roll along the microchannel wall due to fluid drag and shear until they reach the stagnation point in the downstream zone of the pillars. The secondary energy minimum attraction force should result in a faster deposition rate (compared to “slow” deposition in the presence of an energy barrier), but the particle−particle attraction interaction in this region (not in direct contact with the wall) seems to promote the sweeping out (or gliding) of particles under the drag force. These results are in agreement with results obtained from porous media with spherical collectors where at moderate ionic strength particles translate along the collectors surface via secondary energy minimum association (without attachment) in the presence of an energy barrier and accumulate at the flow stagnation zones where there is low flow drag.19,30,31
4.2. Bottleneck Shape: Tilted Wall Shape Increasing Arches Robustness.The results inFigure 3c show that the clogging depends on the microchannel bottleneck shape. In all cases, the results show that an opening angle at microchannel entrance leads to rapid clogging, this effect being more pronounced for the microparticles dispersed in 100 mM KCl (where the repulsion is significantly screened). The arches formed at low ionic strength (0.01 mM) are robust and dense. The opening angle seems to reinforce the robustness of the arches, leading to a more rapid decrease in the permeability. For arches formed at high ionic strength, the clogging transition is controlled by the fragility of the arches that are frequently broken and swept out. In this case, the square corners favor the frequent sweeping out of the arches leading to a delay in clogging. The convergent entrance (Figure 3b) seems to reduce the breakage events. Two explanations could be brought to support this observation. First, the convergent entrance could protect the clog formed at the bottleneck from flow changes. In the convergent zone, the flow is more regular (with less axis fluctuation) and then should reduce the collapse of clogs. Indeed, the fragility of clogs is linked2to changes (even small) in the direction of the flow: the force applied by the flow becomes different than the compression axis at the origin of the arches formation. The convergent entrance could then reduce this destructive change in flow direction. Second, the arches could be more frequent and more robust because of the tilted angle at the bottlenecks. It is easier to support force chains in a “conic” system. The lateral walls could partially help to support the thrust from the drag force on the arches. The inclined wall could then help to form force chains of the clog and to have clogs less sensitive to small lateral changes in the flow. Furthermore, it has been observed from the experiments that the arches with the titled bottlenecks are formed just above the microchannel entrance (Figure 3b) with parallel walls while the arches with the square corners are formed just below the microchannel entrance (Figure 3a) where there is less support from the lateral walls against the drag force. The worst conditions for clogging are reached when combining a high frequency for arches formation (at high ionic strength where the collision efficiency is higher) and durable arches (with an opening angle increasing the arches robustness). This occurs during experiments with tilted angle microchannels using high
Figure 7.Observation of particle capture in the downstream corner of the pillars for 10 mM salt.
ionic strength suspensions (100 mM KCl) as shown inFigure 3c.
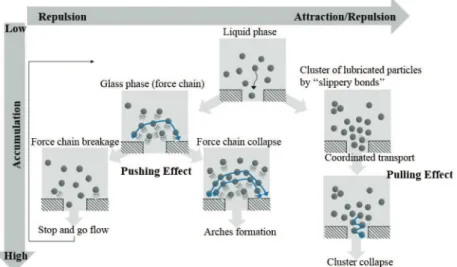
4.3. Clogging Scenarios.Different mechanisms have been discussed to explain flow of particles during clogging.4 In this section, we will use the useful and simple scenario drawn by considering spatiotemporal fluctuations within force networks:2 (i) drag forces (often unidirectional loads) lead to accumu-lation and force chains within some particles in the network (percolation transition); (ii) the flow blocking changes the applied forces and can lead to a progressive redispersion of the clog or to a clog breakage and sweeping out; (iii) new force chains are created with a different orientation to rejam and support a new load.
4.3.1. Pushing or Pulling Interaction Effect. When repulsive particles are flowing near a constriction, because of multibody interaction, the particles can jam and form a network of arrested interacting particles slowing down the flow (a force chain of particles in repulsion blocking the flow). This “interaction pushing effect” has been already simulated.14 In this case, the force chain presents lateral component that make particles pushing on the bottleneck walls (mainly because of the high osmotic pressure exhibited by concentrated repulsive particles). When the force chain is destroyed by the flow, the flow accelerates and the permeability increases. This flow acceleration can lead to the capture of the particles at the bottleneck or to the collapse of successive force chains and then lead to the creation of arches. If this event does not occur, a new force chain can be created leading to a stop and go flow. These phenomena (left part ofFigure 8) have been simulated and lead to permeability fluctuations or arches formation according to the particle/particle or wall/particle repulsion magnitude.14
The unexpected effect shown by these experiments is the delay in clogging observed for 10 mM experiments characterized by a significant secondary minimum. The formation of arches is prevented in these conditions. Because of the secondary minimum, we can deduce that particles will attract each other to form a cluster of attractive interacting particles. Such a cluster can be seen as a network of lubricated particles linked by “slippery” bondsunlike shear rigid bonds at contact. These slippery bonds have been discussed in the aggregation mechanisms of particles having secondary
mini-mum interaction32and could be also responsible for the gliding phenomena of particles at wall (discussed in section 4.1.3). This cluster of attractive interacting particles can then be formed in the center of the flow through the shear-induced diffusion effect. This mechanism could lead to a coordinated transport of particles induced by the attraction between particles (the attraction leading to a pulling effect of particles through the bottleneck). Such an enhanced transport through the pore could delay the clogging. Simulation should be done to check the existence of this pulling effect.
4.3.2. Panic, the Herding Instinct, and the Sacrifice Scenarios. At the end, three well different scenarios for clogging can be drawn according to the particles interaction outline experimented with particles in different ionic strength environment (Table 2). These behaviors can be put in parallel of the general sketch of discrete bodies passing through a bottleneck that can be found in granular materials or in crowd swarming.1
Panic is a particular form of a collective behavior depending on “human” interactions.4 This behavior is similar to the one we observe with repulsive particles where a pushing interaction effect is responsible to stop and go flow or to arches formation. At the opposite of panic, the herding instinct is a cooperative collective behavior which seems to be observed when we proceed with attractive (in secondary minima) particles. In this case, a pulling effect induced by attraction could help the transfer of the cluster of attractive particles through the bottleneck and delay the clog formation. In these last two cases, the collective effects (generated by the long-range interactions and the presence of concentrated dispersions in constrained environment) seem to control the transport of particles through the channels.
In the last case of attractive (in primary minima) particles, the collective effect seems less important. This case is characterized by a high collision efficiency leading to important capture of particles on the walls. The deposit on the walls is then a hydrodynamic (ballistic) limited aggregation. However, even if the deposit quantity is high, this deposit is loose (there is no “ordering” or ‘‘spatial optimization” of the capture position induced by interactions) and lead to a dendritic or loose structure. This structure is then more fragile, and the clog formation is controlled by this fragility.
Figure 8. Collective effect of the interaction on transport of particles through bottlenecks for repulsive particles (left part) and for attractive/ repulsive particles (right part).
5. CONCLUSIONS
The dynamics of the clog formation at microchannel bottlenecks and their impact on the permeability are controlled by colloidal interaction outline (potential barrier, secondary and primary minima) when varying the dispersion ionic strength (0.01, 10, and 100 mM). At low flow rate in the presence of potential barrier, no clogging of the microseparator is observed which is linked to low collision efficiency. Higher flow rate induces pushing effect between particles leading to the creation of robust arches at pore entrances. The coupling of high flow rate and high ionic strength conditions show that the filtration process is dominated by the shear fragility of clogs: frequent sweeping out of the arches can delay the clogging. When a significant secondary energy minimum exists, an important clogging delay is observed. Such delay could be attributed to particle−particle or particle−wall slippery bond that leads to particle gliding on the wall and to a pulling effect between particles flowing through the bottleneck. Moreover, we find that these observations are sensitive to the geometry of the microchannel bottleneck. The results are discussed at the light of the force chains that could be created inside the concentrated dispersion prior to clog formation. This study illustrates then the importance of collective behavior exhibited by interacting particles during jamming or clogging.
■
AUTHOR INFORMATION Corresponding Author*E-mail[email protected](Z.B.S.). Notes
The authors declare no competing financial interest.
■
ACKNOWLEDGMENTSThe authors acknowledge the financial support of the Education, Audio-visual and Culture Executive Agency (EACEA) division of the European Union under the program of EUDIME (European Doctorate in Membrane Engineering) grant in the Erasmus Mundus framework. The authors would like to thank Van Nhat PHAM (PhD student at University of Toulouse) for his help in the fabrication of the microfluidic devices.
■
REFERENCES(1) Zuriguel, I.; Parisi, D. R.; Hidalgo, R. C.; Lozano, C.; Janda, A.; Gago, P. A.; Peralta, J. P.; Ferrer, L. M.; Pugnaloni, L. A.; Clément, E.; Maza, D.; Pagonabarraga, I.; Garcimartín, A. Clogging transition of many-particle systems flowing through bottlenecks. Sci. Rep. 2014, 4, 7324.
(2) Cates, M. E.; Wittmer, J. P.; Bouchaud, J.-P.; Claudin, P. Jamming, Force Chains, and Fragile Matter. Phys. Rev. Lett. 1998, 81, 1841−1844.
(3) Haw, M. D. Jamming, Two-Fluid Behaviour, and “Self-Filtration” in Concentrated Particulate Suspensions. Phys. Rev. Lett. 2004, 92, 185506.
(4) Helbing, D.; Johansson, A.; Mathiesen, J.; Jensen, M.; Hansen, A. Analytical approach to continuous and intermittent bottleneck flows.
Phys. Rev. Lett. 2006, 97, 168001.
(5) Xie, D.; Wu, H.; Zaccone, A.; Braun, L.; Chen, H.; Morbidelli, M. Criticality for shear-induced gelation of charge-stabilized colloids. Soft
Matter 2010, 6, 2692.
(6) Zuriguel, I.; Pugnaloni, L. A.; Garcimartín, A.; Maza, D. Jamming during the discharge of grains from a silo described as a percolating transition. Phys. Rev. E: Stat. Phys., Plasmas, Fluids, Relat. Interdiscip.
Top. 2003, 68, 030301.
(7) Wu, H.; Zaccone, A.; Tsoutsoura, A.; Lattuada, M.; Morbidelli, M. High Shear-Induced Gelation of Charge-Stabilized Colloids in a Microchannel without Adding Electrolytes. Langmuir 2009, 25, 4715− 4723.
(8) Zaccone, A.; Wu, H.; Gentili, D.; Morbidelli, M. Theory of activated-rate processes under shear with application to shear-induced aggregation of colloids. Phys. Rev. E 2009, 80, 051404.
(9) Bacchin, P.; Aimar, P.; Sanchez, V. Model for colloidal fouling of membranes. AIChE J. 1995, 41, 368−376.
(10) Wyss, M.; Blair, L.; Morris, F.; Stone, H.; Weitz, A. Mechanism for clogging of microchannels. Phys. Rev. E 2006, 74, 061402.
(11) Mustin, B.; Stoeber, B. Deposition of particles from polydisperse suspensions in microfluidic systems. Microfluid. Nanofluid. 2010, 9, 905−913.
(12) Gassara, D.; Schmitz, P.; Ayadi, A.; Prat, M. Modelling the Effect of Particle Size in Microfiltration. Sep. Sci. Technol. 2008, 43, 1754− 1770.
(13) Kim, M. M.; Zydney, A. L. Particle−particle interactions during normal flow filtration: Model simulations. Chem. Eng. Sci. 2005, 60, 4073−4082.
(14) Agbangla, G. C.; Bacchin, P.; Climent, E. Collective dynamics of flowing colloids during pore clogging. Soft Matter 2014, 10, 6303− 6315.
(15) Henry, C.; Minier, J.; Lefevre, G. Towards a description of particulate fouling: from single particle deposition to clogging. Adv.
Colloid Interface Sci. 2012, 185−186, 34−76.
(16) Whitesides, G. The origins and the future of microfluidics.
Nature 2006, 442, 368−373.
(17) Bacchin, P.; Marty, A.; Duru, P.; Meireles, M.; Aimar, P. Colloidal surface interactions and membrane fouling: investigations at pore scale. Adv. Colloid Interface Sci. 2011, 164 (1−2), 2−11.
(18) Hartman, R. L. Managing Solids in Microreactors for the Upstream Continuous Processing of Fine Chemicals. Org. Process Res.
Dev. 2012, 16, 870−887.
(19) Kuznar, Z. A.; Elimelech, M. Direct microscopic observation of particle deposition in porous media: Role of the secondary energy minimum. Colloids Surf., A 2007, 294, 156−162.
(20) Zaccone, A.; Wu, H.; Lattuada, M.; Gentili, D.; Morbidelli, M. Charged Molecular Films on Brownian Particles: Structure, Inter-actions, and Relation to Stability. J. Phys. Chem. B 2008, 112, 6793− 6802.
(21) To, K.; Pik-Yin, L.; Pak, H. Jamming of granular flow in a two-dimensional hopper. Phys. Rev. Lett. 2001, 86, 71−74.
(22) Johnson, W. P.; Li, X.; Yal, G. Colloid Retention in Porous Media: Mechanistic Confirmation of Wedging and Retention in Zones of Flow Stagnation. Environ. Sci. Technol. 2007, 41, 1279−1287.
(23) Tong, M.; Ma, H.; Johnson, W. P. Funnelling of Flow into Grain-to-grain Contacts Drives Colloid-Colloid Aggregation in the Presence of an Energy Barrier. Environ. Sci. Technol. 2008, 42 (8), 2826−2832.
(24) Dersoir, B.; de Saint Vincent, M. R.; Abkarian, M.; Tabuteau, H. Clogging of a single pore by colloidal particles. Microfluid. Nanofluid. 2015, 19, 1−9.
(25) Elimelech, M.; O’Melia, C. R. Kinetics of deposition of colloidal particles in porous media. Environ. Sci. Technol. 1990, 24, 1528−1536. (26) Tang, S.; Preece, J. M.; McFarlane, C. M.; Zhang, Z. Fractal Morphology and Breakage of DLCA and RLCA Aggregates. J. Colloid
Interface Sci. 2000, 221, 114−123.
(27) Harshe, Y. M.; Lattuada, M. Breakage Rate of Colloidal Aggregates in Shear Flow through Stokesian Dynamics. Langmuir 2012, 28, 283−292.
(28) Conchuir, B.; Zaccone, A. Mechanism of flow-induced biomolecular and colloidal aggregate breakup. Phys. Rev. E 2013, 87, 032310.
(29) Tufenkji, N.; Elimelech, M. Breakdown of Colloid Filtration Theory: Role of the Secondary Energy Minimum and Surface Charge Heterogeneities. Langmuir 2005, 21, 841−852.
(30) Johnson, W. P.; Hilpert, M. Upscaling Colloid Transport and Retention under Unfavorable Conditions. Water Resour. Res. 2013, 49, 5328−5341.
(31) Ma, H.; Pazmino, E.; Johnson, W. P. Surface Heterogeneity on Hemispheres-in-Cell Model Yields All Experimentally-Observed Non-Straining Colloid Retention Mechanisms in Porous Media in the Presence of Energy Barriers. Langmuir 2011, 27 (24), 14982−14994. (32) Seager, C. R.; Mason, T. G. Slippery diffusion-limited aggregation. Phys. Rev. E 2007, 75 (1), 011406.