O
pen
A
rchive
T
OULOUSE
A
rchive
O
uverte (
OATAO
)
OATAO is an open access repository that collects the work of Toulouse researchers and
makes it freely available over the web where possible.
This is an author-deposited version published in :
http://oatao.univ-toulouse.fr/
Eprints ID : 15860
To link to this article : DOI : 10.1021/acs.iecr.5b02015
URL :
http://pubs.acs.org/doi/abs/10.1021/acs.iecr.5b02015
To cite this version :
You, Xinqiang and Rodriguez-Donis, Ivonne
and Gerbaud, Vincent Investigation of Separation Efficiency
Indicator for the Optimization of the Acetone–Methanol Extractive
Distillation with Water. (2015) Industrial & Engineering Chemistry
Research, vol. 54 (n° 43). pp. 10863-10875. ISSN 0888-5885
Any correspondence concerning this service should be sent to the repository
administrator:
[email protected]
Investigation of Separation Efficiency Indicator for the Optimization
of the Acetone−Methanol Extractive Distillation with Water
Xinqiang You,
†,‡Ivonne Rodriguez-Donis,
†,‡and Vincent Gerbaud
*
,†,‡†
Université de Toulouse, INP, UPS, LGC (Laboratoire de Génie Chimique), 4 allée Emile Monso, F-31432 Toulouse Cedex 04, France
‡
CNRS, LGC (Laboratoire de Génie Chimique), F-31432 Toulouse Cedex 04, France
*
S Supporting InformationABSTRACT: A multiobjective genetic algorithm optimization of the extractive distillation process of acetone−methanol minimum azeotropic mixture with heavy entrainer water is investigated. The process includes the extractive and entrainer regeneration columns, and the optimization minimizes the energy cost objective function (OF) and total annual cost (TAC) and maximizes efficiency indicators Eextand eextthat describe the ability of the extractive section to discriminate the product between
the top and the bottom of that section. Earlier work (You et al. Ind. Eng. Chem. Res. 2015, 54, 491) found that improvement of some designs in the literature led to an increase in those indicators. A two-step optimization strategy for extractive distillation is conducted to find suitable values of the entrainer feed flow rate, entrainer and azeotropic mixture feed locations, total number of trays, two reflux ratios, and two distillates in both the extractive column and the entrainer regeneration column. The first step relies upon the use of a nonsorted genetic algorithm (NSGA) with the four aforementioned criteria. Second, the best design taken from the GA Pareto front is further optimized focusing on decreasing the energy cost by using a sequential quadratic programming (SQP) method. In this way, the most suitable design with optimal efficiency indicators, low energy consumption, and low cost are obtained. Analyzed with respect to thermodynamic insights underlying the extractive section composition profile map, the Pareto front results show that there is maximum Eextat a given reflux ratio, and there is minimum reflux ratio for a given
Eext. There is an optimal efficiency indicator Eext,optwhich corresponds to the minimum TAC taken as the best design. In other
words, Eext,opt can be a criterion for the comparison between different designs for the same separating system. A SQP-based
design is only <1% better in TAC than the best NSGA design, showing that this later method is able to find a consistent design for the extractive process concerning the 1.0-1a class mixture.
1. INTRODUCTION
Extractive distillation is commonly applied in industry for separating azeotropic or low relative volatility liquid mixtures by adding an entrainer and is becoming a more and more important separation method in petrochemical engineering because of the energy and capital cost savings.1,2 A suitable entrainer should interact preferably with one of the components of the original mixture and alters their relative volatilities.3The main distinction between extractive distillation and azeotropic distillation is that the entrainer is fed at a different location than the main mixture, bringing an additional extractive section in the column between the usual stripping and/or the rectifying sections.4
Extractive distillation can be operated in both batch and continuous modes. Batch mode has the advantage in operating flexibility, and continuous mode has the advantage in large-scale production.5−7 In this work, the configuration of continuous
extractive distillation enabling a direct split suitable for the minimum boiling azeotrope mixture separation with a heavy entrainer (class 1.0-1a)4 is used. As shown in Figure 1, the entrainer is fed between the top tray and the main feed, giving rise to rectifying, extractive, and stripping sections in the extractive column. For A−B minimum azeotrope mixture (boiling temperature of A is lower than that of B) with entrainer E, A (B) is the distillate of the extractive distillation column when the univolatility line reaches the AE (BE) side.
The mixture of E with the nonproduct component in extractive distillation B (A) is fed to the entrainer regeneration column
where B (A) is removed as distillate, and E is recovered as bottom product. The entrainer is cooled and recycled to the extractive column with some entrainer makeup due to the entrainer loss in the two distillate streams. The process needs a makeup entrainer to compensate its losses with the products. As the flow rate of makeup entrainer is not known beforehand, we set it equal to the entrainer losses combined after sharp splits by using SEP1 and SEP2 on the two product distillates. Although SEP1 and SEP2 are virtual, the flow sheet can represent the real flow sheet of the extractive distillation in closed mode.
Nowadays, the hot topics in extractive distillation are entrainer selection and process design and optimization. A thorough knowledge of the thermodynamic properties of the mixtures not only is useful for the entrainer selection and process design but also can explain optimization results, as we shall show in this paper. The choice of a suitable entrainer affects the feasibility and efficiency of extractive distillation processes. Residue curve maps have been proven to be a very useful topological tool for the analysis of the thermodynamic behavior of ternary azeotropic mixtures.8,9 Ravagnani et al.10 compared ethylene glycol and tetra-ethylene glycol as entrainer for anhydrous ethanol production and used the residue curve maps tool to analyze the proposed processes in interpreting the mixture behaviors and feasibility of the distillation column. But in the general case, the position of the univolatility line in the residue curve map sets the volatility order region and defines the product to be withdrawn.11−14 Alternatively, inflection
point curves can be used.15 In addition, it also hints at the occurrence of a limiting entrainer-to-feed flow rate ratio value for the separation to be effective. A general feasibility criterion for homogeneous batch extractive distillation under infinite reflux ratio was proposed by Rodriguez-Donis et al.11based on the analysis of the residue curve map and the univolatility line. Process feasibility under finite reflux was also described in these articles. For a continuous process, the feasibility criterion holds but there exists a minimum bound for the entrainer flow rate ratio and minimum and maximum bounds for the reflux ratio for the process to be feasible, as was reported previously.15−17
On the other hand, there are many contributions in the literature focusing on extractive distillation process design and optimization. Compared with a simple conventional distillation, the difficulties of the extractive distillation process design lie in a greater number of degrees of freedom and the recommended recycling of the entrainer with as little impurity as possible. The entrainer choice, entrainer flow rate, and entrainer feed location are the additional degrees of freedom. The optimization of extractive distillation is usually considered as a large size problem because of the solving of a significant number of strongly nonlinear equations. In addition, suitable initial values are needed for solving the nonlinear programming (NLP) subproblems and avoiding nonconvergence of the simula-tions.18 When integer variables like feed locations and tray numbers are considered, the problem becomes a mixed-integer nonlinear programming (MINLP) problem. For the finding of the most suitable design of the extractive distillation, various techniques can be used, such as sensitivity analysis,19,20 sequential iterative optimization,21 and various optimization methods such as sequential quadratic programming (SQP) for NLP problems,22,23 mixed-integer nonlinear programming (MINLP),24,25 genetic algorithm (GA)26,27 for MINL prob-lems, and so on.
In our previous work, we intended to assess the engineering and physical meaning of an optimal extractive distillation design based on the knowledge of thermodynamic insights from the residue curve map and univolatility line for extractive distillation. We ran the optimization of the acetone−methanol minimum azeotropic mixture extractive distillation with water as heavy entrainer by using a two-step optimization procedure.28 The optimization process led to double-digit
savings in energy consumption and total annual cost (TAC) compared to literature values. The lower pressure in the extractive column was deduced from thermodynamic insight analysis and proved to be beneficial. For comparing with the design in literature, we fixed the total number of trays as proposed in Luyben’s design.2,19 We then defined two
indicators, the total extractive efficiency and the extractive efficiency per tray, which describe the ability of the extractive section to discriminate the product between the top and bottom of that section. We then showed with these indicators that the design in the literature could be improved by increasing the efficiency indicators.
In this study, we investigate whether an optimal extractive distillation design corresponds to maximum values of those efficiency indicators and why this is not the case by combining optimization techniques with analysis of thermodynamic insights underlying the extractive section composition profile map. We go a step further than in our previous work by relaxing the constraints on the total number of trays and by considering the efficiency indicators Eextand eextas optimization criterions.
A multiobjective genetic algorithm is connected through Excel with Aspen Simulator to minimize energy cost and TAC and maximize Eextand eext. The minimum boiling azeotropic mixture
acetone−methanol with water as entrainer (class 1.0-1a) is taken as an example of the optimization process. As the most-studied mixture, it allows us to compare the extractive distillation process designs with each other.
2. BACKGROUND, METHOD, AND OBJECTIVE FUNCTION
2.1. Topological Features of Class 1.0-1a Extractive Distillation Process. A feasible design should connect the extractive section with the rectifying section (in batch and continuous modes) and with the stripping section (in continuous mode).16The general feasibility criterion enounced
by Rodriguez-Donis and co-workers4,11,14and originated from former studies1,3,8,12,13strictly holds for infinite reflux operation
for batch process because in continuous process there is always a maximum feasible finite reflux ratio.14−17 Indeed, for finite
reflux, things are more complicated and can only be exhaustively studied from the knowledge of the pinch point trajectories under the assumption of infinite number of trays and more generally of the extractive singular point locations under finite number of trays.15−17,29−31 Graphical,15,16
short-cut,17−30 and numerical29,31 methods were proposed. Those
works showed that the key factor lies in the extractive section ability to intersect the rectifying section and that feasible and unfeasible regions could be found and are related to minimum and maximum values of the reflux ratio and of the entrainer feed flow rate. The general criterion devised for batch operation under infinite reflux ratio11can hold for continuous operation
under finite reflux ratio.14For continuous extractive distillation, minimum entrainer flow rate and minimum energy limit exist and require an infinite number of stages to obtain desired product purities and a very large entrainer flow rate for the
minimum energy case.14,15A maximum reflux ratio limit also
exists to “connect” all three sections’ composition pro-files.16,17,30,31 Shen et al.14 noted that the feasible parameter range for reflux ratio and entrainer-to-feed flow rate ratio is smaller for continuous operation because of the additional requirement of connecting the stripping and the extractive profile.
Figure 2 displays the qualitative topological features of the class 1.0-1a diagram extractive section composition profile map originally analyzed for the batch extractive process because it will be used inResults and Discussion.
Feasible and unfeasible regions for the composition in the extractive section of the column are deduced from the analysis of the extractive composition profile map, similarly to residue curve map (RCM) analysis. The feasible composition regions will encompass the extractive section composition profile in the extractive distillation column obtained as results. Those regions
are bounded by extractive stable and unstable separatrices which connect stable and unstable nodes, respectively, to saddle points and cross at saddle extractive singular points.31,32For the class 1.0-1a, the pinch point of the extractive composition profiles is a stable extractive node SNextissued from the original
minimum boiling azeotrope. Saddle extractive points, Si,ext,
emerge from the RCM saddle points (A and B vertices). An extractive unstable node, UNext, is located near the entrainer
vertex.
At infinite reflux which concerns only the batch extractive process, while FE/F increases (Figure 2c), SNext moves along
αAB= 1, SA,extand SB,extmove along the binary edges (A-E and B-E, respectively), toward the vertex (E), which is the entrainer. Extractive stable separatrices that link SNext−SA,ext−SB,extmove
inside the composition triangle toward E with no effect on feasibility because of infinite reflux ratio.
Figure 2.Topological features of class 1.0-1a with heavy entrainer in extractive distillation process operation (adapted from Rodriguez-Donis et al.11).
Close to a limiting value FE/Fmin,R∝, SNext and SA,ext merge
and the extractive composition profiles are attracted to a new extractive stable node, SNext′, located below the A-E edge. FE/
Fmin,R∝is defined as the value for which the process becomes
feasible: Extractive composition profiles ending at SNext′cross a
rectifying profile that can reach the vicinity of the expected product (A) (seeFigure 2d).
At finite reflux as FE/F increases, the extractive unstable
separatrix UNext−SA,ext−UNext′ near the A-E edge holds (see
Figure 2e) until SNext and SA,ext merge at FE/Fmin,R>0 > FE/
Fmin,R∝, giving rise to SNext′ (Figure 2f). In the meantime
(Figure 2f), SB,extmoves toward the vertex E inside the triangle.
Consequently, the extractive unstable separatrix UNext−SB,ext−
UNext′ remains and now sets unfeasible composition regions
located above it (seeFigure 2f) that prevent the total recovery of component A from the column. Knowledge of this unstable separatrix location will help us in the analysis of the optimization results. In addition, the extractive stable separatrix also remains, joining SB,extto SNext′and SNext″located outside
the ternary composition space through the B-E edge. Notice that there exists a minimum reflux ratio Rmin at a given FE/F.
When R < Rmin, there is no feasible region for the extractive
section profile. The size of the unfeasible region increases as Rmindecreases.
Therefore, finite reflux operation which concerns both the batch and continuous extractive process is feasible if FE/F > FE/
Fmin,R>0and R > Rmin. Now, the more component E is fed to the
column, the closer is SNext′to component E and away from the
distillate that is close to component A (see Figure 2f). For a proper extractive distillation design, it is necessary to enable the extractive section composition at the entrainer feed tray location to reach SNext′. It allows the connection with a
rectifying section that can reach a high-purity distillate near A, following approximately a residue curve shape.
2.2. Product and Limiting Operating Parameter for Class 1.0-1a Extractive Distillation. Figure 3 displays the essential features of the 1.0-1a class, corresponding to the separation of a minimum boiling azeotropic mixture A-B with a heavy entrainer E. The univolatility curve αAB = 1 and the
residue curve map features are also shown.
The Serafimov’s class 1.0-1a occurrence in literature amounts to 21.6%.33 With a heavy entrainer, the light original component A and the heavy original component B are both
residue curve map saddle points and form a minimum boiling azeotrope Tmin azeoAB, which is a RCM unstable node. The
heavy entrainer E is a RCM stable node. The univolatility curve αAB = 1 switches the volatility order of its concerned compounds, and volatility orders are ABE or BAE (seeFigure 3) depending on the side.32 In Figure 3a (3b), the αAB = 1
curve intersects the binary side A-E (B-E) at the so-called point xP. Then, A (B) is the expected product in the distillate because
it is the most volatile in the region where it is connected to E by a residue curve of decreasing temperature from E to A (B). This matches the general feasibility criterion under infinite reflux ratio for extractive distillation.11The point xPwill give us
information about the minimum content of entrainer (FE/(F +
FE)).28 Below this value, the terminal point of the extractive
section profiles, SNext′, lies on the univolatility curve. Above this
value, SNext′leaves the univolatility curve to lie near the [xP; E]
segment.11,14Then the extractive profile can cross a rectifying profile, which is approximated by a residue curve under infinite reflux ratio and which reaches the vicinity of the product, ex. A (respectively B).
2.3. Nonsorted Genetic Algorithm Process Optimiza-tion Technique.Compared with other methods mentioned in theIntroduction, the genetic algorithms are attractive in solving optimization problems with modular process simulators because of the following characteristics. Any simulator may fail to converge if unsuitable initial input values are set. When coupled with stochastic optimization techniques, this issue is less important as the search for optimal solution in genetic algorithm is not limited to one point but rather relies on several points simultaneously which build the population.34Second, in nonsorted genetic algorithm (NSGA), it is not necessary to have explicit information on the mathematical model or its derivatives because the algorithms are based on a direct search method. NSGA has been implemented in Excel with visual basic for applications (VBA) programming by our colleagues;34 the result is the genetic algorithm library MULTIGEN. It can handle multiobjective constrained optimization problems involving mixed variables (boolean, integer, real), and some of these problems can be related to process structural optimization. Constraints as well as Pareto domination principles can be handled by the algorithms. Nonsorted genetic algorithm II (NSGAII) is the method we used. NSGAII is based on a ranking procedure, where the rank of each solution
Figure 3.Thermodynamic features of 1.0-1a mixtures. Separation of a minimum boiling azeotrope with a heavy entrainer (adapted from Shen et al.14).
is defined as the rank of the Pareto front to which it belongs. The diversity of nondominated solutions is guaranteed by using a crowding distance measurement, which is an estimation of the size of the largest cuboids enclosing a given solution without including any other. This crowding sorting avoids the use of the sharing parameter used in the previous version of the NSGA algorithm.34
The stable link between Excel and Aspen Plus was coded in VBA, as was done by Vazquez-Ojeda et al.18 The node of variables such as tray number of column, reflux ratio, and so on are found by Aspen plus tools named variable explorer. The simulation is run by using the MESH model Radf rac in Aspen Plus.
2.4. Advantages of NSGA for the Design of Extractive Distillation Process Compared with SQP.Compared with the SQP optimization solver used in a previous work, NSGA brings several advantages, but may take much longer to perform successfully. First, because we usually choose a large population and may attempt to replace in the initial population nonconverging simulation by other parameters, the choice of the initial parameter values is less an issue. Second, we no longer have to choose two important aspects in extractive distillation: the choice of distillate flow rates, and the choice of open loop or closed-loop flow sheet. (1) Earlier, we chose the two distillate flow rates by sensitivity analysis28,35because their effects on the achievable product purity are strongly nonlinear. (2) The open loop flow sheet does not connect the recycled entrainer and the fresh entrainer feed. However, the closed-loop flow sheet (Figure 1) can be directly used in NSGA, and the effect of impurity in the recycled entrainer on the product purity is readily handled.
2.5. Objective Function. As in our previous study,28we
minimize the total process energy consumption by introducing the objective function, OF. The differences in reboiler and condenser and the product prices are taken into account by using the energy price index (m) and product price index (k).
= + · + + · · + ≥ ≥ Q m Q Q m Q k D D x x min OF subject to: 0.995 0.995 D D r1 c1 r2 c2 1 2 acetone, 1 methanol, 2 (1)
With the use of the OF, the two columns in the extractive distillation process are evaluated simultaneously. Only the two product purities are regarded as constraints, and not the recycling entrainer purity, because of the use of NSGA in the closed-loop flow sheet.
The TAC is used as the second objective function for the comparison of the different designs. TAC includes capital cost per year and operating costs and is computed from the following formula:
= +
TAC capital cost
payback period operating cost (2)
The payback period is considered to be 3 years, and Douglas’s cost formulas36 are used with Marshall and Swift (M&S) inflation 2011 index37equal to 1518.1, for the sake of
comparison with our previous work.28,35 The capital cost includes the column shell cost, tray cost, and heat exchanger cost. The operating cost means the energy cost in the reboiler and condenser. To emphasize the effect of the entrainer flow
rate recycle on the process, the heat exchanger annual cost (heater inFigure 1) is taken into account. Other costs such as pumps, pipes, and valves are neglected at the conceptual design stage that we consider.
The efficiency indicator of extractive section Eext and the
efficiency indicator per tray in extractive section eext are the
third and fourth objective function as Eextand eextdescribe the
ability of the extractive section to discriminate the desired product between the top and the bottom of the extractive section. The definition of the efficiency indicator for the extractive section is
= −
Eext xP,H xP,L (3)
where Eextis the total efficiency of the extractive section, xP,H
the product mole fraction at one end of the extractive section, and xP,L the product mole fraction at another end of the
extractive section. Here, we use the entrainer feed and the main feed tray locations as ends of the extractive section.
The definition of the efficiency indicator per tray in the extractive section is = e E N ext ext ext (4)
where eextis the efficiency indicator per tray and Nextis the tray
number of the extractive section. The efficiency indicator per tray eext is supplementary to Eext for handling the different
designs with different entrainer-to-feed flow rate ratios, different reflux ratios, and different tray numbers in the extractive section.
The vapor−liquid equilibrium (VLE) of the system acetone− methanol with water is described with the UNIQUAC thermodynamic model with the Aspen Plus built-in binary parameters28 while the ideal vapor phase is assumed. The
reliability of the VLE model has been assessed by Botia et al.38 using vapor−liquid equilibrium experimental data under atmospheric and vacuum pressure. Notice that the tray number is counted from top to bottom of the column, and the condenser is considered as the first tray.
3. RESULTS AND DISCUSSION
3.1. Problem Setting.This work uses the extractive section efficiency indicator Eext and eext for the first time as objective
functions for the optimization of extractive distillation process, along with OF and TAC. Notice that energy cost OF and total annual cost are minimized, while the efficiency indicator for extractive section Eextand per tray eextare maximized. Properly
designed extractive distillation processes should have a low energy cost and TAC. These are related but are different in meaning. Typically, TAC depends on the cost method. It can vary depending on the different situations and it is used as a decision factor. Energy cost is connected to the process flow rate and mixture thermodynamics, and for the same thermodynamic model and same process design it will not vary. It is also useful for comparison when considering heat integrated processes. The maximization of both efficiency indicators, total Eextand per tray eext, are duplicate in meaning
but must be considered together for the following reason: removing the indicator per tray may lead to designs with unreasonably large tray numbers in the extractive section. That would correspond to large total efficiency indicator, large TAC, but probably minimum reflux operation and thus low energy cost OF.
For selecting the parameters of the GA, the tuning process is perfomed: several tests are conducted with different values of individual, crossover, and mutation fraction. After tuning, and owing to the fact that parameter ranges were not accurately determined as they could be with methods available in the literature15−18but defined over a wide range that encompassed
values based on published extractive distillation design for the acetone−methanol−water system, we choose a large number of 300 individuals per generation. Other GA parameters were 0.8 for crossover fraction and 0.1 for mutation fraction. The NSGA optimization is stopped when the TAC cannot be reduced for 20 successive generations. The total number of generations are 270 in this study.
The procedure of the NSGA II method works as follows: First, the variables of the initial populations are generated randomly within the given value range in Excel (see ranges below). The variables of each individual are sent one by one to Aspen Plus software to run the simulation that gives back the product purities and other information for calculating objectives to Excel. Generally speaking, no feasible design that satisfies the constraints (product purities) is obtained in the first generation, but improvements come after some generations. For some meaningless designs identified with in-house VBA programming, for example no extractive section exists or the number of feed location is greater than the number of column stage, the product purities are set directly to zero without sending to Aspen. For the case that Aspen simulation is not converged or in error, the individual (design) will be discarded with the help of the Aspen run state parameter. For the extreme situation that all the individuals in the first generation are not converged or in error, NSGA will regenerate the first generation randomly. Second, based on the number of satisfied constraints, the population is divided into subpopula-tions. In our case, the better individuals are those that satisfy the two constraints (two product purities), then those that satisfy only one product purities, and thenthose that satisfy no product purities. The individuals in the subpopulation are ranked according to fitness function. Thanks to the different subpopulation, the GA can optimize the four objective functions and meanwhile minimizes the difference between the required and obtained product purities. Finally, the Pareto front is obtained as the results of the optimization of the extractive distillation process: a set of nondominated, optimal designs that satisfy the specification of the product purities. A design reported in the Pareto front means that it cannot be improved through one objective function without worsening the other objectives.
To compare with Luyben’s work, the main feed flow rate is 540 kmol/h (equimolar acetone versus methanol) at 320 K, although we did find other optimal values in our previous work.28The 10 variables of the processes are tray number of the two column (N1and N2); distillates and reflux ratios of the
two column (D1, D2and R1, R2), the feed locations of entrainer,
main feed, and regeneration column (NFE, NFAB, NFR); and the
entrainer flow rate FE(which reflects FE/F). The value ranges
are [10,100] for N1 and N2; [270.0, 271.3] for D1 and D2
(based on product recovery and purity); [0.1, 10] for R1and
R2; and [10,100] for NFE, NFAB, and NFR (some invalid
situations such as NFE≥ NFAB, NFAB≥N1, and NFR≥ N1are
excluded by VBA programming). Notice that the operating pressures of extractive column and entrainer generation column are set at 0.6 and 1 atm. We showed that a 0.6 atm leads to a lower (FE/F)minand enhances the relative volatility between A
and B in the presence of E.28The pressure drop per tray was assumed to be 0.005 atm, and the tray efficiency is 85%.39
3.2. Pareto Front of the Optimal Design Solution. Although four objectives are used, the optimal design that we select is the one with the minimum TAC. The energy cost OF decreases with the increase of the column tray number, and it is useful for finding the minimum energy cost of each design. Regarding eext, it is used to avoid the situation that only
maximizing Eext will result in too many trays used in the
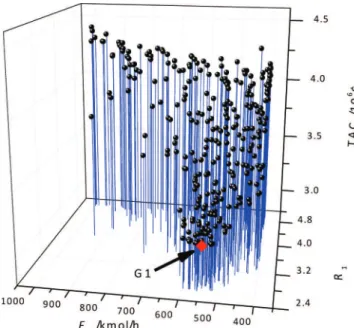
extractive section. Results of the stochastic optimization are displayed as approximate Pareto fronts inFigures 4−6.Figure 4
shows the Pareto front of the acetone−methanol−water system, TAC versus Eext and R1. Figure 5 shows the Pareto
front of TAC versus R1and FE, andFigure 6shows the Pareto
front of TAC versus eext and Eext. The lowest TAC design is
shown as G1 inFigures 4−6. Notice that for all 300 designs in the Pareto front, the target product purities and the recovery are satisfied. The recycling entrainer purity is not a constraint
Figure 4.Approximate Pareto front of extractive distillation design for acetone−methanol−water system, TAC versus Eext and R1. The red
diamond indicates G1.
Figure 5.Approximate Pareto front of extractive distillation design for acetone−methanol−water system, Eext versus R1 and FE. The red
for the optimization process but remains very high, as will be seen later.
From Figure 4, we know the following: (1) The optimal design is not the one with maximum Eext. Along with the
decrease of Eextand R1, TAC decreases. Evidently, a low R1is
related to a low heat duty, and the operating cost and the TAC decreases. (2) For Eext, this is not as straightforward. In other
words, Eextthat we have thought to be maximized cannot be the
unique criterion for optimizing the process. (3) The shape of the front shows that there is a maximum Eextfor a given reflux
ratio, and there is a minimum R1for a given Eext. (4) Following
the decrease of R1, the value of Eextdecreases, and meanwhile,
the value range of Eext gets narrower. We can infer that a
suitable design should correspond to an optimal efficiency Eext,opt, for which the minimum reflux ratio R1exists.
From Figure 5, we know that (1) the highest efficiency indicator is located at highest reflux ratio and lowest entrainer flow rate. (2) The efficiency indicator increases at fixed reflux ratio while following the decrease of FE. Recall fromFigure 2
that R1and FEimpact the unstable separatrix and that the stable
node of extractive section SNext,A′is close to the xpintersection
of αAB= 1 with the AE edge when FE/F decreases. Then, the
content of acetone in SNext,A′ increases, and so does the
efficiency indicator Eext. (3) The efficiency indicator decreases
at fixed FE/F following the decrease of R1. The reason is that as
the reflux ratio decreases, the unstable separatrix moves toward the distillate composition and narrows the feasible region (see
Figure 2). Therefore, Eext is likely to decrease following the
meaning of Eext. From another view, as the reflux ratio decreases
for a fixed distillate, the liquid flow rate from column top to the main feed tray decrease, leading to the acetone content on the main feed tray increasing relatively, so Eextdecreases following
its definition.
FromFigure 6, we know that (1) there are only a few points belonging to the Pareto front in the region of reflux ratio R1
lower than 4 and entrainer flow FEhigher than 700 kmol/h. At
a relatively high entrainer flow rate, the separating cost in the regeneration column increases. Then, TAC increases compared
with the design at a more suitable entrainer flow rate, leading to fewer designs in this region to be ranked in the Pareto front. (2) At low FE(400−500 kmol/h) and reflux ratio (2.4−2.8), no
designs are ranked. For these values, the specification of product purities is difficult to achieve for finite tray numbers. (3) Finally, for the value P1 = 0.6 atm that we chose, an
economically feasible value range of the entrainer flow rate is (450−650 kmol/h), namely, (0.83−1.2) for FE/F.
3.3. Analysis of Ternary Extractive Profiles Map for Selected Designs. To further understand the effect of the efficiency indicator Eexton the process, we extract fromFigure 4
the relation map of Eext and TAC and analyze some designs
from the Pareto front, namely G1−G6, as shown inFigure 7.
G1, G3, G4, and G6 are chosen on the upper border of the Pareto front. G2 has a TAC close to that of G3 but exhibits a lower efficiency indicator Eext. G5 has the same Eextas G4 but a
much higher TAC.Table 1shows the design variables of G1− G6 and Table S1 (in theSupporting Information) provides the sizing parameters and cost data.
We question the reasons for the occurrence of the upper border of the Pareto front, and we display the extractive section profile map of G3 at 0.6 and 1 atm and the simulating composition profile inFigure 8.
Following the physical meaning of Eext, we can infer that the
efficiency indicator will be the highest at low FE/F ratio when
the stable node of the extractive section is more close to xpand
when the extractive section profile nears the unstable extractive separatrix. The second condition is nearly achieved for G3 design, as shown inFigure 8.
The use of the approximate differential extractive profile map derived from mass balance and assuming an infinite number of trays is relevant asFigure 3shows that the approximate profile shape agrees with the simulated one, which is calculated with rigorous MESH equations at given tray number for each section. We observe that at point G3, the first condition for maximizing the efficiency indicator is not achieved. Indeed, the process is feasible as the stable node of the extractive section SNext,A′is close to the AE side but as the FE/F (0.98) is bigger
than the minimum value 0.19 and the reflux ratio 3.00 is bigger than the minimum value 2.00, SNext,A′lies far from xp.Figure 8
Figure 6.Approximate Pareto front of extractive distillation design for acetone−methanol−water system, TAC versus R1 and FE. The red
diamond indicates G1.
Figure 7.Relation map of Eextand TAC for some designs from Pareto
also shows that as the extractive unstable separatrix moves inside the diagram, giving rise to a shrinking unfeasible composition region when the reflux ratio decreases, the composition’s location of main feed stage should be at the lower side of the unstable separatrix; otherwise the process will be unfeasible as the extractive profiles no longer reach SNext,A′
and acetone is no longer the distillate. In addition, when the reflux ratio increases, the separatrix is closer to the BE side, to larger feasible region, leading to a higher value of the efficiency indicator. This point was observed inFigure 5and agrees with the statement about the feasibility of extractive distillation.11,14 However, increasing R1is not always a good way to obtain a
higher Eext as the energy cost and TAC will increase. In our
previous work,28 we found that a better way to improve the
design is to change FE/F and the suitable feed location to
increase the average relative volatility.
In Table 1, the G1 design exhibits the lowest TAC and represents our so-called optimal design from the NSGA optimization. Comparing the designs of G2 and G3 points with the same total number of trays and nearly the same reflux ratio, OF and TAC, we notice that G3 shows an Eext higher
than that of G2 because of a lower FE/F, but G2 has a higher
eext than G3 because the G2 extractive section is shorter than
G3 (16 trays versus 22). We may infer that for the same TAC and OF, lowering the entrainer feed flow rate (G3) can be compensated by a higher efficiency per tray (G2).
Comparing G4 and G5, (1) G5 TAC is much higher than G4’s because the much larger FE/F and a large reflux ratio for
G5 induce larger reboiler and condenser duties and raise the OF and TAC. This indicates that a decrease of the entrainer flow rate and R1due to more suitable feed locations NFABand NFEin the design of G4 greatly reduces the OF and TAC. This
point proves the importance of increasing the tray number in the extractive section to 24 trays for the design of G4 and 13 trays for the design of G5. As discussed in our earlier works28 and Lelkes et al.,40the extractive section should have enough
trays so that the composition at the entrainer feed tray lies near the stable node of the extractive section SNext′that should be as
close as possible to the product−entrainer edge. This point is also in agreement with the sensitivity analysis over the tray number performed by Lang for the same separating system.41 (2) G5 design shows that a high extractive efficiency indicator per tray eextdoes not always mean low OF and TAC. Compared
to G4, the increase of eextin G5 by decreasing the tray number
in the extractive section requires FE/F and R1to be increased in
order to get the same Eextfor both G4 and G5. This leads to the
increase of TAC due to the increase of the energy cost in extractive column and the separation in entrainer recovery column.
When the designs of G3 and G4 are compared, both on the upper frontier of the Pareto front, the higher Eextfor G4 is due
to the decrease of FEthat moves SNext,A′closer to xpand to the
Table 1. Design Parameters for G1−G6 Belonging to the Pareto Front, P1= 0.6 atm, P2= 1 atm
G1 G2 G3 G4 G5 G6 Extractive Column N1 65 65 65 61 64 65 FAB(kmol/h) 540.0 540.0 540.0 540.0 540.0 540.0 W2(kmol/h) 545.3 616.3 525.7 431.4 864.8 400.4 Emakeup(kmol/h) 1.7 1.6 1.9 1.3 1.5 1.3 FE(kmol/h) 547.0 617.9 527.6 432.7 866.3 401.7 NF,E 34 37 33 26 31 25 NF,AB 53 52 54 49 43 55 D1(kmol/h) 271.3 271.3 271.3 271.3 271.3 271.3 R1 2.66 2.98 3.00 3.44 4.64 4.98 QC(MW) 8.38 9.10 9.15 10.17 12.91 13.92 QR(MW) 8.71 9.49 9.47 10.41 13.49 13.69 Regeneration Column N2 35 35 35 35 35 35 D2(kmol/h) 270.4 270.3 270.6 270.0 270.2 270.0 NFR 26 24 28 27 26 25 R2 1.02 1.05 1.05 1.04 1.20 1.03 QC(MW) 5.32 5.41 5.43 5.39 5.82 5.35 QR(MW) 5.70 5.81 5.80 5.72 6.34 5.66 OF (kJ/kmol) 28657.5 30429.8 30368.2 32111.7 39431.6 38964.8 TAC (×106$) 3.140 3.305 3.304 3.438 4.115 4.117 Eext(×10−3) 166 230 284 353 351 517 eext(×10−3) 8.3 14.4 12.9 14.7 27.0 16.7
Figure 8.Extractive section profile map for acetone−methanol−water, case G3.
increase of R1that approaches the unstable separatrix closer to
the BE edge.
Finally, G6 and G1 display the best and the worst value of the efficiency indicator. G6’s very high TAC shows that maximizing the total efficiency, by getting the main feed tray composition near the unstable extractive separatrix and by looking for the lowest entrainer flow rate, does not lead to the lowest OF and TAC design. On the contrary, the best design G1 shows the lowest Eextbut it is still larger than the one for
Luyben’s design,19Eext= 55 × 10−3, and close to that of Knapp
and Doherty’s design,42 Eext = 160 × 10−3, discussed in our
previous work.28
Figure 9displays the extractive section profile map and the simulation composition profile for G1.
The beginning point of the extractive section (at main feed tray) in the design of G1 (seeFigure 9) is not as close to the unstable separatrix as would have been expected from the design of G3 (see Figure 8), and Eext is consequently lower.
The reasonable explanation is that during the optimization procedure of NSGA with maximizing Eext, the reflux ratio (R1)
is a dominant variable to reduce OF and TAC. When Eext is
closer to its optimal value Eext,opt, the effect of R1becomes weak,
and meanwhile the effect of other variables (entrainer flow rate, entrainer and main feed locations) become more obvious, leading to a design with lower TAC and the beginning point away from the unstable separatrix. This phenomenon proves that finding an optimal design cannot rely only upon the sole maximization of Eext, but that further optimization is necessary
for a given R1and FE.
This answers our initial question and tempers our optimizm displayed in our previous work: we cannot use the efficiency indicator alone to optimize the extractive distillation process for the 1.0-1a class, and there likely exists an optimal Eext,optnear
G1’s values that we now verify.
3.4. Further Improvement of GA’s Optimal Design. As stated earlier, the Pareto front displaying the results is merely an approximation obtained by the stochastic optimization; nature cannot guarantee that each point is a true optimum, expected to border the Pareto front. Also, they are obtained through the optimization of the four objective functions, but in practice the design with the lowest TAC is the most favorable
one. So we select the design of G1 which has the lowest TAC as initial design to run a further optimization in order to appreciate the ability of the NSGA to find an optimal solution. The results are shown in Table 2, namely, case SQP. In
addition, in order to compare fairly with our previous design28 (N1 = 57, N2= 26), namely, case 3opt in which a 100% tray
efficiency was assumed and the pressure drop per tray was neglected, we now optimize it as case 3opt′ under 85% tray efficiency and a 0.005 atm pressure drop per tray. The results are shown inTable 2, whileSupporting InformationTable S2 shows the sizing figures and cost data.
The single objective function is energy cost OF and is based on the same column tray number (N1= 57, N2= 26) for case
3opt′ and (N1= 65, N2= 35) for case SQP. The other eight
variables are optimized through minimizing OF by using the two-step optimization procedure stated in previous work.28
TAC and two efficiency indicators are calculated afterward. The design and operating variables are shown inTable 2, referring to the flow sheet notations inFigure 1.Table 3 displays the product purity and recovery values.
Table 3 shows that case 3opt′, G1, and SQP optimized in closed-loop flow sheet achieve the product purities for both distillates. We also notice that the water content in recycled entrainer is very high for all cases but lower than 99.99% in case G1 obtained with the NSGA optimization. In our previous work,28on the basis of a SQP optimization with an open loop
flow sheet assuming a pure entrainer feed to the extractive column, we had to run an additional closed-loop simulation to overcome the effects of the impurities in recycled entrainer on the product purity. This is no longer necessary with the NSGA method optimizing directly the closed-loop flow sheet.
With the same number of trays as Luyben and Knapp and Doherty’s design but with stricter product purity constraints,
Table 2 shows that case 3opt in You’s work28represented a
Figure 9.Extractive section profile map for acetone−methanol−water, case G1.
Table 2. Final Design Results for Acetone−Methanol−Water of Case 3opt′, Case G1, and Case SQP
case 3opt′ case G1 case SQP Extractive Column N1 57 65 65 FAB(kmol/h) 540 540.0 540.0 W2(kmol/h) 636.1 545.3 557.9 Emakeup(kmol/h) 2.1 1.7 2.1 FE(kmol/h) 638.2 547.0 560.0 NF,E 32 34 34 NF,AB 48 53 55 D1(kmol/h) 271.0 271.3 271.1 R1 2.74 2.66 2.59 QC(MW) 8.55 8.38 8.21 QR(MW) 8.93 8.71 8.56 Regeneration Column N2 35 35 35 D2(kmol/h) 271.1 270.4 271.0 NFR 19 26 25 R2 1.18 1.02 1.00 QC(MW) 5.78 5.32 5.30 QR(MW) 6.21 5.70 5.68 OF (kJ/kmol) 30119.8 28657.5 28326.3 TAC (×106$) 3.153 3.140 3.107 Eext(×10−3) 153 166 161 eext(×10−3) 9.0 8.3 7.3
great improvement over Luyben’s design with a double-digit saving in OF and TAC and reached OF = 28318.5 kJ/kmol and TAC = 2.918 × 10⁶ $ per year (see ref 28). By taking into account the tray efficiency and the pressure drop, case 3opt′ OF and TAC increase now to OF = 30119.8 kJ/kmol and TAC = 3.153 × 10⁶$ per year, mostly because of the decrease of the
tray efficiency. The pressure drop slightly affects the relative volatility, which decreases when the pressure increases.28 Therefore, the TAC and OF are slightly larger.
FromTable 2, we also know that (1) the G1 design reduces OF by 4.8% over case 3opt′. A suitable increase of tray number proposed by the NSGA optimization in the columns allows a Table 3. Product Purities and Recoveries for Case 3opt′, Case G1, and SQP Designs
mole fraction D1 D2 W2= water W1= F2 recovery
case 3opt′ acetone 0.99502 0.00129 8.10 × 10⁻¹¹ 0.00039 99.87%
methanol 0.00055 0.99540 0.00009 0.29753 99.95 water 0.00443 0.00331 0.99991 0.70208 case G1 acetone 0.99502 0.00019 1.43 × 10⁻¹² 6.22 × 10⁻⁵ 99.98% methanol 0.00053 0.99799 0.000143 0.33089 99.95% water 0.00445 0.00182 0.999857 0.66905 case SQP acetone 0.99505 0.00090 9.58 × 10⁻¹³ 0.00029 99.91% methanol 0.00023 0.99608 4.36 × 10⁻⁵ 0.32568 99.98% water 0.00472 0.00302 0.999956 0.67403
lower entrainer flow rate to be used and decreases the energy cost in both columns. (2) The G1 design from NSGA with four objective functions is marginally improved through the sensitivity analysis plus ASPEN built-in SQP method that only minimizes OF. At the design step of the process, the improvement is not significant. (3) The ASPEN built-in SQP method runs faster than NSGA. Also, it can be initialized by the NSGA results. (4) Compared with case G1, two more trays are used in the extractive section of case SQP design, resulting in a small decrease of the reflux ratio in extractive column. (5) For the acetone−methanol equimolar mixture separation with water, Eext,opt should be at 0.161 ± 3% for extractive column
operating at 0.6 atm. It is greater than Luyben’s figure and similar to Knapp and Doherty’s estimate (see ref28).
The temperature and composition profiles in the two columns of case SQP are shown inFigures 10and11. When displayed on a ternary diagram, the case SQP composition
profile looks very similar to the one for G1 displayed inFigure 8.
From Figure 10, there is a temperature decrease in the temperature profile map of the extractive column as the main feed temperature was fixed at 320 K during the optimization the same as previous design.28We can also notice inTable 3
that most of the impurity in the distillate (D1) is the
high-boiling temperature water because the rectifying section profile reaches xD1on the acetone−water mixture side where there is a pinch point at the high acetone content side. Its effect is that more than half of the trays (34 out of 65) are used in rectifying section in extractive column for separating the acetone from water. In addition, the content of methanol in the rectifying section is very low (see Figure 11), which proves that the extractive section pinch point (SNext′) was able to come very
close to the AE side.
Figure 11.Temperature and composition profiles of entrainer regeneration column for the extractive distillation of acetone−methanol with water, case SQP.
4. CONCLUSION
The optimization of the extractive distillation process including the extractive and entrainer regeneration columns for the separation of acetone−methanol minimum azeotropic mixture with heavy entrainer water was investigated. It was intended to find out whether efficiency indicators describing the ability of the extractive section to discriminate the product between the top and the bottom of that section could be used to optimize the process design because we had found previously that improvement of some designs in the literature leads to an increase in those indicators, not an unexpected result because they describe the main goal of the extractive distillation process. A multiobjective nonsorted genetic algorithm method coded in Excel was used as optimization method, and it was linked with Aspen plus software through programming in VBA. We run the optimization with four objective functions: extractive efficiency indicator Eext and eext are maximized while TAC (economic
view) and OF (energy cost per unit product) are minimized while 99.5% products purities in the distillates are set as constraints.
Through the analysis of the Pareto front, the effects of the main variables, entrainer-to-feed ratio and reflux ratio, on TAC and efficiency indicator were discussed. They were also analyzed with respect to thermodynamic insights underlying the extractive section composition profile map. The results show that the efficiency indicators cannot be used alone for optimizing the process design, but they help understand designs that are better than others. There is a maximum Eextfor
a given reflux ratio, and there is a minimum R1for a given Eext.
There also exists an optimal efficiency indicator Eext,optwhich
corresponds to the optimal design defined as the one with the lowest TAC, and Eext,optcan be used as a criterion for evaluating
different designs for the same system. For the acetone− methanol with water system, Eext,optequals 0.161 ± 3% at 0.6
atm. Indeed, we have to conclude that although the efficiency indicators cannot be used as an optimization criterion alone, it is worth combining it with usual criteria such as TAC and OF because near its Eext,optvalue the design is still very sensitive to
the entrainer feed flow rate and reflux ratio parameters that have a dominant impact on the OF and TAC. Through the analysis of extractive profile maps, we also explain the reasons why the efficiency indicator increases following the decrease of entrainer flow rate and the increase of reflux ratio.
The ASPEN built-in SQP method is used to further improve the design following the decrease of TAC with the initial values from the NSGA method. A competitive design is found but with only a <1% marginal improvement, showing that NSGA optimization with the four criteria described above is able to find a consistent design for the extractive process concerning the 1.0-1a class mixture.
■
ASSOCIATED CONTENT*
S Supporting InformationThe Supporting Information is available free of charge on the
ACS Publications websiteat DOI:10.1021/acs.iecr.5b02015. Sizing parameters for the columns and cost data of the designs (PDF)
■
AUTHOR INFORMATIONCorresponding Author
*E-mail: [email protected].
Notes
The authors declare no competing financial interest.
■
ACKNOWLEDGMENTSX.Y. thanks the Chinese Scientific Council for its support of this work.
■
REFERENCES(1) Doherty, M. F.; Knapp, J. P. Distillation, Azeotropic, and Extractive. In Kirk-Othmer Encyclopedia of Chemical Technology; Wiley: New York, 1993.
(2) Luyben, W. L. Distillation Design and Control Using Aspen
Simulation. John Wiley &Sons, Inc: New York, 2006.
(3) Hilmen, E. K. Separation of Azeotropic Mixtures: Tools for Analysis
and Studies on Batch Distillation Operation. Ph.D. Thsis, Norwegian
University of Science and Technology, Trondheim, Norway, 2000. (4) Gerbaud, V.; Rodriguez-Donis, I. Extractive distillation. In
Distillation Book; Gorak, A., Olujic, Z., Eds.; Elsevier: Amsterdam,
2014; Vol. 2, Chapter 6, pp 201−247.
(5) Lelkes, Z.; Láng, P.; Benadda, B.; Otterbein, M.; Moszkowicz, P. Batch Extractive Distillation: the Process and the Operational Policies.
Chem. Eng. Sci. 1998, 53, 1331.
(6) Lang, P.; Yatim, H.; Moszkowicz, P.; Otterbein, M. Batch Extractive Distillation Under Constant Reflux Ratio. Comput. Chem.
Eng. 1994, 18 (11), 1057.
(7) Düssel, R.; Stichlmair, J. Separation of Azeotropic Mixtures by Batch Distillation Using an Entrainer. Comput. Chem. Eng. 1995, 19, 113.
(8) Doherty, M. F.; Perkins, J. D. On The Dynamics of Distillation Process III. The Topological Structure of Ternary Residue Curve Maps. Chem. Eng. Sci. 1979, 34, 1401.
(9) Widagdo, S.; Seider, W. D. Journal Review Azeotropic Distillation. AIChE J. 1996, 42, 96−130.
(10) Ravagnani, M.; Reis, M. H. M.; Filho, R. M.; Wolf-Maciel, M. R. Anhydrous Ethanol Production by Extractive Distillation: A Solvent Case Study. Process Saf. Environ. Prot. 2010, 88 (1), 67.
(11) Rodriguez-Donis, I.; Gerbaud, V.; Joulia, X. Thermodynamic Insights on the Feasibility of Homogeneous Batch Extractive Distillation. 1. Azeotropic Mixtures with Heavy Entrainer. Ind. Eng.
Chem. Res. 2009, 48 (7), 3544.
(12) Andersen, H. W.; Laroche, L.; Morari, M. Dynamics of Homogeneous Azeotropic Distillation Columns. Ind. Eng. Chem. Res. 1991, 30 (8), 1846.
(13) Laroche, L.; Bekiaris, N.; Andersen, H. W.; Morari, M. The Curious Behavior of Homogeneous Azeotropic Distillation − Implications for Entrainer Selection. AIChE J. 1992, 38, 1309.
(14) Shen, W.; Benyounes, H.; Gerbaud, V. Extension of Thermodynamic Insights on Batch Extractive Distillation to Continuous Operation. 1. Azeotropic Mixtures with a Heavy Entrainer. Ind. Eng. Chem. Res. 2013, 52 (12), 4606.
(15) Bauer, M. H.; Stichlmair, J. Synthesis and Optimization of Distillation Sequences for the Separation of Azeotropic Mixtures.
Comput. Chem. Eng. 1995, 19, 15.
(16) Wahnschafft, O. M.; Westerberg, A. W. The Product Composition Regions of Azeotropic Distillation Columns. 2. Separability in Two-feed Columns and Entrainer Selection. Ind. Eng.
Chem. Res. 1993, 32 (6), 1108.
(17) Brüggemann, S.; Marquardt, W. Shortcut Methods for Nonideal Multicomponent Distillation: 3. Extractive Distillation Columns.
AIChE J. 2004, 50 (6), 1129.
(18) Vazquez-Ojeda, M.; Segovia-Hernandez, J. G.; Hernandez, S.; Hernandez-Aguirre, A.; Kiss, A. A. Design and Optimization of an Ethanol Dehydration Process Using Stochastic Methods. Sep. Purif.
Technol. 2013, 105, 90.
(19) Luyben, W. L. Comparison of Extractive Distillation and Pressure-swing Distillation for Acetone − Methanol Separation. Ind.
(20) Gil, I. D.; Botia, D. C.; Ortiz, P.; Sánchez, O. F. Extractive Distillation of Acetone/Methanol Mixture Using Water as Entrainer.
Ind. Eng. Chem. Res. 2009, 48, 4858.
(21) Wang, Q.; Yu, B.; Xu, C. Design and Control of Distillation System for Methylal/Methanol Separation. Part 1: Extractive Distillation Using DMF as an Entrainer. Ind. Eng. Chem. Res. 2012,
51 (3), 1281.
(22) de Figueiredo, M. F.; Guedes, B. P.; De Araujo, J. M.; Vasconcelos, L. G. S.; Brito, R. P. Optimal Design of Extractive Distillation Columnsa Systematic Procedure Using a Process Simulator. Chem. Eng. Res. Des. 2011, 89, 341.
(23) Kiss, A. A.; Suszwalak, D. J. Enhanced Bioethanol Dehydration by Extractive and Azeotropic Distillation in Dividing-wall Columns.
Sep. Purif. Technol. 2012, 86, 70.
(24) Kossack, S.; Kraemer, K.; Gani, R.; Marquardt, W. A Systematic Synthesis Framework for Extractive Distillation Processes. Chem. Eng.
Res. Des. 2008, 86, 781.
(25) García-Herreros, P.; Gómez, J. M.; Gil, I. D.; Rodriguez, G. Optimization of the Design and Operation of an Extractive Distillation System for the Production of Fuel Grade Ethanol Using Glycerol as Entrainer. Ind. Eng. Chem. Res. 2011, 50, 3977.
(26) Gutérrez-Antonio, C.; Briones-Ramírez, A.; Jiménez-Gutiérrez, A. Optimization of Petlyuk Sequences Using a Multi Objective Genetic Algorithm with Constraints. Comput. Chem. Eng. 2011, 35 (2), 236.
(27) Xu, W.; Diwekar, U. M. Improved Genetic Algorithms for Deterministic Optimization and Optimization Under Uncertainty. Part II. Solvent Selection Under Uncertainty. Ind. Eng. Chem. Res. 2005, 44, 7138.
(28) You, X.; Rodriguez-Donis, I.; Gerbaud, V. Improved Design and Efficiency of the Extractive Distillation Process for Acetone-Methanol with Water. Ind. Eng. Chem. Res. 2015, 54 (1), 491.
(29) Frits, E. R.; Lelkes, Z.; Fonyo, Z.; Rev, E.; Markot, M. C.; Csendes, T. Finding Limiting Flows of Batch Extractive Distillation with Interval Arithmetics. AIChE J. 2006, 52 (9), 3100.
(30) Petlyuk, F.; Danilov, R.; Burger, J. A Novel Method for the Search and Identification of Feasible Splits of Extractive Distillations in Ternary Mixtures. Chem. Eng. Res. Des. 2015, 99, 132.
(31) Knapp, J. P.; Doherty, M. F. Minimum Entrainer Flow for Extractive Distillation: A Bifurcation Theoretic Approach. AIChE J. 1994, 40, 243.
(32) Kiva, V. N.; Hilmen, E. K.; Skogestad, S. Azeotropic Phase Equilibrium Diagrams: A Survey. Chem. Eng. Sci. 2003, 58, 1903.
(33) Hilmen, E. K.; Kiva, V. N.; Skogestad, S. Topology of Ternary VLE Diagrams: Elementary Cells. AIChE J. 2002, 48 (4), 752.
(34) Gomez, A.; Pibouleau, L.; Azzaro-Pantel, C.; Domenech, S.; Latge, C.; Haubensack, D. Multiobjective Genetic Algorithm Strategies for Electricity Production from Generation IV Nuclear Technology.
Energy Convers. Manage. 2010, 51 (4), 859.
(35) You, X.; Rodriguez-Donis, I.; Gerbaud, V. Extractive Distillation Process Optimisation of the 1.0-1a Class System, Acetone-Methanol with Water. In 24th European Symposium on Computer Aided Process
Engineering; Klemes, J. J., Varbanov, S. V., Liew, P. Y., Eds.; Elsevier:
Amsterdam, 2014.
(36) Douglas, J. M. Conceptual Design of Chemical Processes; McGraw-Hill: New York, 1988.
(37) Marshall & Swift. Average M & S index for year 2011. Chem.
Eng. 2012, 119, 84.
(38) Botia, D. C.; Riveros, D. C.; Ortiz, P.; Gil, I. D.; Sanchez, O. F. Vapor− Liquid Equilibrium in Extractive Distillation of the Acetone/ Methanol System Using Water as Entrainer and Pressure Reduction.
Ind. Eng. Chem. Res. 2010, 49, 6176.
(39) De Figueiredo, M. F.; Brito, K. D.; Ramos, W. B.; Vasconcelos, L. G. S.; Brito, R. P. Effect of Solvent Content on the Separation and the Energy Consumption of Extractive Distillation Columns. Chem.
Eng. Commun. 2015, 202 (9), 1191.
(40) Lelkes, Z.; Lang, P.; Benadda, B.; Moszkowicz, P. Feasibility of Extractive Distillation in a Batch Rectifier. AIChE J. 1998, 44, 810.
(41) Lang, P. Computation of Multicomponent, Multistage Separation Processes. In Studies in Computer-Aided Modelling, Design
and Operation: Unit Operations;Pallai, I., Fonyo, Z., Eds.; Elsevier:
Budapest, 1992; Chapter 7, pp 256.
(42) Knapp, J. P.; Doherty, M. F. Thermal Integration of Homogeneous Azeotropic Distillation Sequences. AIChE J. 1990, 36, 969.