O
pen
A
rchive
T
OULOUSE
A
rchive
O
uverte (
OATAO
)
OATAO is an open access repository that collects the work of Toulouse researchers and
makes it freely available over the web where possible.
This is an author-deposited version published in :
http://oatao.univ-toulouse.fr/
Eprints ID : 15859
To link to this article : DOI : 10.1021/ie503973a
URL :
http://pubs.acs.org/doi/abs/10.1021/ie503973a
To cite this version : You, Xinqiang and Rodriguez-Donis, Ivonne
and Gerbaud, Vincent Improved Design and Efficiency of the
Extractive Distillation Process for Acetone–Methanol with Water.
(2015) Industrial & Engineering Chemistry Research, vol. 54 (n° 1).
pp. 491-501. ISSN 0888-5885
Any correspondence concerning this service should be sent to the repository
administrator:
[email protected]
Improved Design and Efficiency of the Extractive Distillation Process
for Acetone−Methanol with Water
Xinqiang You,
†,‡Ivonne Rodriguez-Donis,
†,‡and Vincent Gerbaud*
,†,‡†
Université de Toulouse, INP, UPS, LGC (Laboratoire de Génie Chimique), 4 allée Emile Monso, F-31432 Toulouse Cedex 04, France
‡
CNRS, LGC (Laboratoire de Génie Chimique), F-31432 Toulouse Cedex 04, France
*
S Supporting InformationABSTRACT: We show how thermodynamic insight can be used to improve the design of a homogeneous extractive distillation process, and we define an extractive efficiency indicator to compare the optimality of different designs. The case study is related to the separation of the acetone−methanol minimum boiling azeotrope with water. The process flow sheet includes both the extractive distillation column and the entrainer regeneration column. Insight from analysis of the ternary residue curve map and isovolatility curves shows that a lower pressure reduces the minimal amount of entrainer needed and increases the relative volatility of acetone−methanol in the extractive column. A 0.6 atm pressure is selected to enable the use of cheap cooling water in the condenser. We optimize the entrainer flow rate, adjusting both column reflux ratios and feed locations, by minimizing the total energy consumption per product unit. The total annualized cost (TAC) is calculated for all processes. Double-digit savings in energy consumption and in TAC are achieved compared to literature values. We then propose a novel efficiency indicator that describes the ability per tray of extractive section to discriminate the desired product between the top and the bottom of the extractive section. Shifting the feed trays’ locations improves the efficiency of the separation, even when less entrainer is used.
1. INTRODUCTION
Several processes may be used for the separation of azeotropic or close-boiling binary mixtures A−B. One is azeotropic distillation, in which a third component E is added to the feed. A or B components become either a stable or unstable node on the residue curve in the relevant distillation region, thus being removable as product by either an indirect or a direct split, respectively.1 Another choice is pressure-swing distillation, which takes advantage of the binary azeotropic composition changing with the pressure.2,3The third common process is extractive distillation, in which the third component is fed at a location other than the main feed, giving rise to an extractive section.4,5 Usually, but not always, the product of extractive distillation is a saddle node on the residue curve in the relevant distillation region. A well-designed extractive distillation process can achieve high product purity with the lowest possible energy consumption.6,7Following the definition of Figueiredo et al.,8a well-designed extractive process means obtaining the lowest specific energy consumption and the least loss of solvent, taking into consideration the constraints imposed on the process.
In the literature, the design of extractive distillation focuses mostly on entrainer selection and process optimal design. The entrainer selection issue is strongly related to the process feasibility. Feasibility rules have been published for batch9−14 and continuous processes15−22for the separation of minimum or maximum boiling azeotropes or low relative volatility mixtures with heavy, light, or intermediate entrainers, giving rise to extractive separation classes.23 Once an extractive separation class is considered, the process optimal design is undertaken by simulation and optimization, based on the calculation of the total annual cost, a trade-off between capital
cost and operating cost. Energy consumption and solvent losses are included in the operating costs. In 1986, Lynn et al.24 carried out the dehydration of ethanol with ethylene glycol as entrainer and stated that extractive distillation was competitive in terms of energy consumption compared with azeotropic distillation.
In this work we consider the extractive distillation of the minimum boiling azeotrope acetone (A)−methanol (B) with a heavy entrainer (E), belonging to the 1.0-1a-m1 extractive separation class.23The acetone−methanol mixture is the main component in the aqueous product obtained from hydrocarbon syntheses by the Fischer−Tropsch process. Several studies have pointed out an interest in extractive distillation for this mixture. Kossack and co-workers25 found that DMSO and chloroben-zene are more efficient for the system, but that water is also a suitable choice since it is environmentally friendly and induces only a moderate economic penalty.
The acetone−methanol azeotrope is also pressure-sensitive and could be broken by pressure-swing distillation. However, Luyben15reported that pressure-swing distillation has a 15% higher total annual cost than extractive distillation for the ternary system of acetone−methanol with water as entrainer.
The first purpose of the present paper is to improve the design of a continuous extractive distillation process proposed in the literature and considered as a good design. This is done by first getting some thermodynamic insight from the residue curve map and isovolatility curves, and then by optimizing the
extractive process sequence, including the entrainer regener-ation column, with regard to the energy consumed per unit product output flow rate. The second purpose is to get some information on the column performance and to define an efficiency criterion for the extractive process that would characterize the optimality of the design. This is related to the ability of the extractive section to segregate the product between the column’s top rectifying section and the bottom stripping section.
2. BACKGROUND, METHODS, AND TOOLS
2.1. Extractive Process Feasibility. The separation of a minimum boiling azeotrope with a heavy entrainer gives rise to a ternary mixture A−B−E that belongs to the 1.0-1a Serafimov’s class, one of the most common among azeotropic mixtures with a reported occurrence of 21.6%.26 Inspired by works of Laroche and co-workers16,27 and others,10,19,28 our team published a general feasibility criterion for extractive distillation under infinite reflux ratio.11 It states that “homogeneous batch extractive distillation of a A−B mixture
with entrainer (E) feeding is feasible if there exists a residue curve connecting E to A or B following a decreasing (a) or increasing (b) temperature direction inside the region where A or B is the most volatile (a) or the heaviest (b) component of the mixture.” The
volatility order is set by the univolatility curves. We found that Serafimov’s classes covering up to 53% of azeotropic mixtures were suited for extractive distillation: 0.0-1 (low relative volatility mixtures),12 1.0-1a, 1.0-1b, 1.0-2 (minimum or maximum boiling azeotropic mixtures with light, intermediate, or heavy entrainers forming no new azeotrope),11,13,14,21,22 2.0-1, 2.0-2a, 2.0-2b, and 2.0-2c (azeotropic mixtures with an entrainer forming one new azeotrope).29For all suitable classes, the general criterion could explain which product can be recovered under infinite reflux ratio, which direct or indirect split configuration is required, and the possible existence of limiting values for the entrainer flow rate. The behavior at finite reflux ratio could be deduced from the infinite value behavior and from the properties of the extractive profile maps. Limits on the reflux ratio were described for the most frequent classes.20−22
In our case, the separation of the minimum boiling azeotropes acetone (A; 56.1 °C)−methanol (B; 64.5 °C; xazeo,A
= 0.78 @55.2 °C) with heavy entrainer water (E; 100.0 °C) belongs to the 1.0-1a-m1 extractive separation class.23 The
univolatility curve αAB =1 intersects the binary side A−E as
shown in Figure 1, displaying also the residue curve map. The vapor−liquid equilibrium of the system acetone−methanol with water is described with the UNIQUAC thermodynamic model with Aspen Plus built-in binary parameters (see Table S1 in the Supporting Information). The reliability of the VLE model used to compute the Figure 1 residue curve has been assessed by Boti ́a et al.17using vapor−liquid equilibrium experimental data under atmospheric and vacuum pressures. That model was also used in Luyben’s work,15to which we intend to compare our improved process design. In this work, we focus on analysis of the residue curve map and univolatility line based on the knowledge of thermodynamics of the process and doing a primary evaluation, aiming at finding possible ways to save energy cost.
For the extractive separation class 1.0-1a-m1, the feasibility criterion is satisfied in the volatility order region A−B−E. Component A acetone is a residue curve map saddle [Srcm] and
cannot be obtained by azeotropic distillation. Thanks to the entrainer feeding FEat a different location than the main feed FAB, an extractive section in the column occurs. Component A
can be obtained as distillate product by a direct split configuration, above a minimum entrainer flow rate value. For this minimum value and for batch operation, the stable node of the extractive section in the distillation column [SNext]
is located at the intersection point xPof the univolatility curve
αAB= 1 and the A−E side.11The xPlocation also describes the minimal amount of entrainer for which the azeotrope azeoABis
no longer effective. Above that amount, the relative volatility αABis always greater than 1. This explains why the feasibility criterion is verified in the A−B−E volatility order region.
The batch minimum entrainer flow rate FE/V depending on
the vapor flow rate V produced at the boiler is defined by the equation10 = − * − ∞ ⎜ ⎟ ⎛ ⎝ ⎞ ⎠ F V x y x x ( ) ( ) E min,R P P E P (1)
where y*P is the entrainer amount in the vapor phase in
equilibrium with xP, and xEis the entrainer composition. It can
be transposed to a minimum entrainer flow rate for continuous operation FE/FABwith the following equation:21−23
Figure 1.Extractive distillation column configuration and acetone−methanol−water 1.0-1a residue curve map at 1 atm with univolatility curves at 0.6 and 1 atm.
= + ⎜ ⎟ ⎛ ⎝ ⎜ ⎞ ⎠ ⎟ ⎛ ⎝ ⎞ ⎠ ⎛ ⎝ ⎜ ⎞ ⎠ ⎟ F F R F V D F ( 1) E AB E AB (2)
The [SNext] point location is critical to the process
understanding because it describes approximately the compo-sition in the column on the entrainer feed tray location, where the extractive section and the rectifying section connect together. By considering the locations of the [SNext] and the
liquid composition at the main feed tray, we show below how the design of an extractive distillation process based on the values published by Luyben15can be further improved.
2.2. Extractive Distillation Process Flow Sheet. The traditional process flow sheet of extractive distillation process is presented in Figure 2a as it is set in Aspen Plus.
The extractive column is fed with entrainer and azeotropic mixture, where the product A (acetone) is recovered from the distillate and the mixture B+E is fed to the entrainer regeneration column. This second column removes product B (methanol) from the distillate and recycles the entrainer (water) from the bottom. The recycled entrainer is cooled before entering the extractive column to a temperature preset at 320 K, matching Luyben’s process value.
The process needs a makeup entrainer to compensate losses with the products. As the flow rate of makeup entrainer is not known beforehand, we set it equal to the entrainer losses combined after sharp splits on the two product distillates.
The open-loop flow sheet in Figure 2b is used during the optimization procedure with a pure entrainer feed because it allows more robust convergence of the simulation. It is systematically checked with the closed-loop flow sheet that corresponds to the industrial plant, where the entrainer is recycled. But then the recycled entrainer contains some impurities that will affect the operation of the extractive column. Finally, the pressure drop is neglected in each column that operates at constant pressure.
2.3. Process Optimization Techniques.Unable to reach a global optimum, but with the advantage of readily providing a feeling of sensitive variables, a sensitivity analysis is often used to optimize the design of various extractive distillation processes by minimizing the reboiler duty of columns.20,30−32 For the separation of acetone−methanol with water as entrainer, Luyben15 designed an extractive distillation and a pressure-swing distillation process. For optimizing the extrac-tive process, he performed a sensitivity analysis of the effect of reflux ratio and solvent flow rate on the acetone purity. He concluded that a solvent−feed flow rate ratio of 2.06 was needed to achieve the desired 99.5 mol% acetone purity.
Mathematical optimization is considered by others. Kiss et al.33used the Aspen built-in sequential quadratic programming (SQP) method to optimize the extractive distillation process for the separation of ethanol−water with ethylene glycol as entrainer in both a two-column classic sequence and an extractive dividing-wall column. Several authors formulated a mixed integer nonlinear programming (MINLP) problem to optimize simultaneously both the continuous variables (reflux, entrainer flow rate) and the discrete variables (total number of tray, feed tray location). Considering the extractive distillation process of acetone−methanol with various entrainers, Kossack et al.34 used a successive relaxed MINLP (SR-MINLP) procedure to reduce the influence of the initial guess on the final result. Garci ́a-Herreros et al.35 looked at the ethanol extractive dehydration with glycerol as entrainer and solved the MINLP problem through a two-level strategy that combines stochastic and deterministic algorithms.
In this work, we keep fixed the total number of trays for each column of the two columns extractive distillation sequence in order to match Luyben’s process design to which we compare. It is also the same values as in a previous design by Knapp and Doherty who ran a sensitivity analysis on the total number of tray.7,19 Hence, the optimization problem is similar to Figueiredo’s work on the ethanol dehydration with ethylene glycol.8 It proceeds in two steps. First, Aspen plus simulator built-in SQP method is used for the optimization of the process over an energy consumption objective function, under purity and recovery constraints and a given column structure, by manipulating the continuous variables, column refluxes R1and R2and the entrainer flow rate FE. Second, a sensitivity analysis
is performed to find optimal values of the feed tray locations
NF,E, NF,AB, and NF,reg, while SQP is ran for each set of discrete
variable values. The final optimization is found through minimizing OF value. Finally, the total annualized cost (TAC) is calculated to compare the separation sequences. We tested this procedure earlier36 to optimize the acetone− methanol extractive distillation with water and to compare it with Luyben’s design, without changing the pressure as in the present work. We obtained a reduction of 12.0% and 14.5% of the total annual cost and energy consumption, respectively. This work also showed that a 1.49 entrainer−feed flow rate ratio was sufficient to obtain 99.5% acetone and methanol, compared to Luyben’s 2.06 value.
2.4. Objective Function. As in all the aforementioned works, we minimize the process energy consumption. For consistency of the process sequence, the entrainer regeneration column energy is included. This is not always the case in literature.8
Based on our previous study before,36we define the objective function (OF) as = + + + + ≥ ≤ ≥ ≥ Q mQ Q mQ kD D x x x x min OF subject to: 0.995 0.001 0.995 0.9999 r1 c1 r2 c2 1 2 acetone,D1 acetone,W1 methanol,D2 water,W2 (3)
where, as shown in Figure 2, Qr1 is the extractive column
reboiler duty, Qc1the extractive column condenser duty, Qr2the
entrainer regeneration column reboiler duty, Qc2the entrainer
regeneration column condenser duty, D1the distillate flow rate
of the extractive column, and D2, the distillate flow rate of the
entrainer regeneration column. Factors k and m respectively describe the price differences between products A and B and between the condenser cooling and reboiler heat duties: k = 5.9 (product price index) and m = 0.036 (energy price index). Compared with previous works where the optimization was done by minimizing only the reboiler duty,15,20or by Q
r/D with
the cost of condenser neglected,8 our OF accounts for both columns’ energy demands, but also reflects the weight coefficient of the two product prices k and the reboiler− condenser cost price m. Then our OF reflects the operation of the entrainer regeneration column, as demonstrated in our previous work.36 The meaning of OF is the energy consumption used per product unit flow rate (kJ/kmol). OF is sensitive to the variables FE/FF, R1, R2, D1, and D2and the
three feed location as well.
The TAC is used for the comparison of the difference separation sequences. TAC was sometimes used directly as an optimization criterion.37TAC includes capital cost per year and operating costs and is computed from the following formula:
= +
TAC capital cost
payback period operating cost (4)
The payback period is considered as 3 years, and Douglas’ cost formulas are used,38 with Marshall and Swift inflation 2011 index (M&S = 1518.1).39The capital cost includes the column shell cost, tray cost and heat exchanger cost (see Supporting Information, Appendix S1). The operating cost means the energy cost in reboiler and condenser. To emphasize the effect of the entrainer flow rate recycle on the process, the heat exchanger annual cost is taken into account. The energy cost of the reboiler is $3.8 per GJ, after consulting a chemical company in Chongqing China. A vacuum pump is needed to produce 0.6 atm (see section 3.1) while the process is under start-up. After that, the operating pressure of the column is controlled by the condenser heat duty. We have neglected its cost and other costs such as the liquid delivery pumps, pipes, valves are neglected at the conceptual design stage that we consider after checking that for a close to 1 atm vacuum pump, there is no significant increase in the purchased cost compared with liquid delivery pump.
3. RESULTS AND DISCUSSIONS
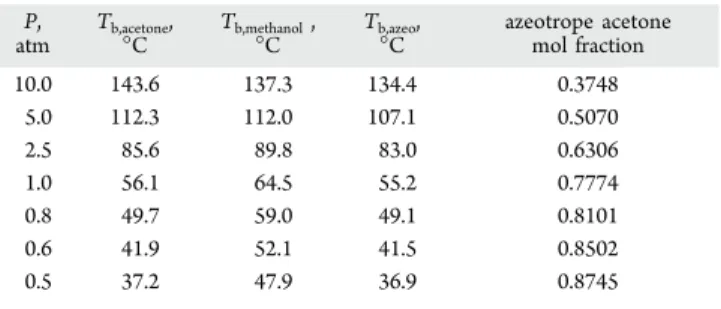
3.1. Pressure Sensitivity of the Azeotropic Composi-tion.With the purpose of changing the operating pressure to improve the extractive distillation sequence, we report in Table
1 the acetone−methanol azeotropic composition change with pressure. We then used the same VLE model to compute Figure 1’s residue curve map.
Table 1 shows that the acetone/methanol azeotrope is sensitive enough to pressure change. Notice that the mixture exhibits a Bancroft point near 5 atm, meaning that their volatility order is reversed. The related temperature near 112 °C is in agreement with the experimental Bancroft point measured at 111.97 °C.40 Pressure-swing distillation (PSD) should be feasible but we do not consider this option here as preliminary results corroborated Luyben’s ones.15 He found that the PSD total annual cost was 15% higher than the extractive distillation process. Table 1 also shows that the content of acetone in the azeotropic mixture increases when the pressure decreases, as seen in Figure 1 for P1= 1 atm and P1=
0.6 atm. As recalled in section 2.1, it means that a lower entrainer amount is needed to break the azeotrope, which could reduce the capital cost. Besides a lower operating pressure implies lower boiling temperatures and possible energy cost savings. If we assume that the extractive column distillate is almost pure acetone and consider a conservative value of 40 °C as the minimum allowed temperature in the condenser to use cheap cooling water, Table 1 shows that we could use an operating pressure greater or equal to 0.6 atm as the acetone boiling point is then computed at 41.93 °C.
3.2. Analysis of Residue Curve Map. The 1.0-1a class residue curve map (RCM) for the acetone−methanol−water ternary system at 1 atm is shown in Figure 1. Figure 1 also displays univolatility curves αAB= 1 and αAB= 2 and αAB= 3 at
1 and 0.6 atm. From αAB= 1 intersection xPwith the A−E edge,
we can use eq 1 to compute the minimum entrainer/feed flow rate ratio under infinite reflux ratio FE/Vmin,R∞ = 0.07 at 0.6
atm; lower than FE/Vmin,R∞= 0.17 at 1 atm. The univolatility
curves indicate that the acetone−methanol relative volatility αAB increases more rapidly for lower pressures when the entrainer content increases. Therefore, for the same amount of entrainer, the entrainer will increase more αABunder vacuum
pressure, making the separation easier and inducing costs saving. We will use P1 = 0.6 atm in the extractive distillation
column from now.
As is well-known, the binary mixture water−acetone equilibrium curve exhibits a pinch near pure acetone. This hints that a significant number of trays is necessary in the rectifying section to reach high-purity acetone.
3.3. Optimization Results. We aim at improving the extractive distillation sequence design proposed by Lyuben,15 referred to as case 1 in the text, by reducing the operating pressure at P1 = 0.6 atm. We keep Luyben’s total number of
trays of the extractive column (Next= 57) and of the entrainer
Table 1. Acetone−Methanol Azeotropic Temperature and Composition at Different Pressures with UNIQUAC Model
P, atm Tb,acetone°C , Tb,methanol, °C Tb,azeo, °C azeotrope acetone mol fraction 10.0 143.6 137.3 134.4 0.3748 5.0 112.3 112.0 107.1 0.5070 2.5 85.6 89.8 83.0 0.6306 1.0 56.1 64.5 55.2 0.7774 0.8 49.7 59.0 49.1 0.8101 0.6 41.9 52.1 41.5 0.8502 0.5 37.2 47.9 36.9 0.8745
regeneration column (Nreg = 26). Those values also match
Knapp and Doherty’s design.7We also keep the same product purity specifications (0.995 molar fraction) for both acetone and methanol, and the same thermodynamic model as Luyben that was also used to draw Figure 1. We also use Luyben’s equimolar feed (FAB= 540 kmol/h) at 320 K and preheat the
entrainer to 320 K as well. Other design parameters are obtained from simulation with the open-loop flow sheet. They are marginally different from Luyben’s article that showed closed-loop results.
The two-step optimization procedure described in section 2.3 is used. Our previous work design parameters under P1= 1
atm36are used as initial point of the optimization under P1=
0.6 atm.
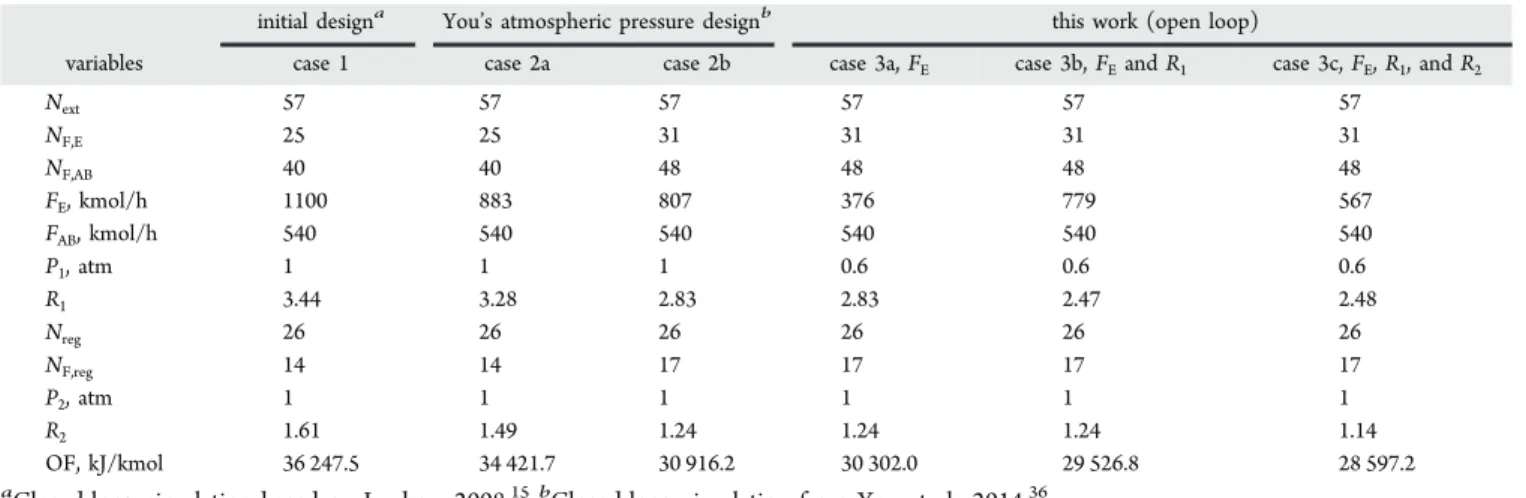
3.3.1. First Step: SQP Optimization of FE, R1, and R2.Table
2 displays the optimized FE, R1, and R2while the other variables
are kept constant. Case 1 is our closed-loop simulation results, obtained by using the design parameters of Luyben at 1 atm.15 Cases 2a and 2b represent results of our previous optimization work, keeping P1= 1 atm.36The difference between cases 2a
and 2b is that the three feed locations of case 2a are the same as case 1, and that of case 2b is taken from our previous work in ref 36. Case 2b is taken as the initial point for the SQP problem. Case 3 is new results with the extractive column operating at 0.6 atm and regeneration column operating at 1 atm. Notice that the tray number is counted from top to bottom of the column, and condenser is considered as the first tray.
The results reported by You et al.36(cases 2a and 2b) already showed that for the same operating pressure the design based on Luyben’s parameters (case 1) could be improved by reducing the entrainer flow rate, even when the feed location was kept unchanged (case 2a). They also showed that changing the feed tray location brought additional savings (case 2b).
Table 2 shows that further reducing the pressure to P1= 0.6
atm (case 3) enables an additional 7.5% reduction of the energy consumption materialized by the objective function OF decrease. This represents a 21% savings over case 1 design. This goes along with our intuition based on the analysis of the ternary map and univolatility curves at different pressures discussed in section 3.2. We also observe the close interrelation between FE, R1, and R2. First the lowest FE is achieved when
only that variable is optimized. But a smaller OF value can be obtained when R1 is optimized simultaneously. Furthermore,
the OF value gets even smaller when the regeneration column reflux R2 is taken into account: R1 increases slightly, FE,
decreases drastically, and R2 gets smaller. This highlights the
importance of optimizing the regeneration column together with the extractive column. We also conclude that if less entrainer is fed to the extractive column, a greater R1is needed
to achieve the same product purity. Meanwhile the concentration of entrainer fed to the regeneration column decreases due to mass balance, and less energy is used to recycle the entrainer, leading to a decrease of R2. The case 3
entrainer−feed flow rate value is almost half of Luyben’s value.
3.3.2. Second Step: Optimization of the Feed Locations.
You et al.36ran a sensitivity analysis on the distillate D1and D2
flow rates and selected D1 = 271 kmol/h (99.86% acetone recovery) and D2= 271.1 kmol/h (99.90% methanol recovery),
close to Luyben’s values. Such very high recovery values are debatable since we are aware that they depend on the thermodynamic model used and should be validated with experimental data. We do not optimize them further and find relevant to postpone their optimization to the availability of pilot plant experimental data.
On the contrary the variables NF,E, NF,AB, and NF,regare worth
optimization at the process design step. The sensitivity analysis over the three feed positions with ranges [25; 50] for NF,E,
[>NF,E; 56] for NF,AB, and [5; 25] for NF,regwas made by using
experimental planning procedure so as to avoid local minimum. For each set of values, FE, R1, and R2are optimized while D1
and D2are fixed. As shown by You’s case 2a and 2b results for P1= 1 atm and recalled in Table 2,36there is a strong incentive
to shift the feed locations and improve the process efficiency. Table 3 shows the results considering now P1= 0.6 atm.
From Table 3, we can infer the following: (1) Decreasing the pressure P1 allows using a lower reflux ratio R1, as seen by
comparing case 2b with all the cases at P1= 0.6 atm. Indeed we
discussed earlier that the univolatility curves shown in Figure 1 were more favorable for the separation process at low pressure. (2) The feed location of entrainer moves down the column from 25 in case 1 to 32 for the lowest OF design exemplifies the well-known fact that increasing the number of trays in the rectifying section allows to use a lower reflux ratio R1. (3) The
minimum value of OF is found with one extra number of trays in the extractive section than Luyben’s parameter-based case 1. This number difference is not significant itself but is related to the efficiency of the extractive section that is discussed in a later Table 2. Optimized Values of FE, R1, and R2for the Extractive Distillation of Acetone−Methanol with Water under Reduced
Pressure
initial designa You’s atmospheric pressure designb this work (open loop)
variables case 1 case 2a case 2b case 3a, FE case 3b, FEand R1 case 3c, FE, R1, and R2
Next 57 57 57 57 57 57 NF,E 25 25 31 31 31 31 NF,AB 40 40 48 48 48 48 FE, kmol/h 1100 883 807 376 779 567 FAB, kmol/h 540 540 540 540 540 540 P1, atm 1 1 1 0.6 0.6 0.6 R1 3.44 3.28 2.83 2.83 2.47 2.48 Nreg 26 26 26 26 26 26 NF,reg 14 14 17 17 17 17 P2, atm 1 1 1 1 1 1 R2 1.61 1.49 1.24 1.24 1.24 1.14 OF, kJ/kmol 36 247.5 34 421.7 30 916.2 30 302.0 29 526.8 28 597.2 a
section. (4) The lowest energy cost for per unit product OF is 28 217.7 kJ/kmol. It represents a decrease of 22% compared to Luyben’s parameter-based case 1; see Table 2. The decrease is only 1.3% compared to step 1 in case 3c, mostly due to a lower entrainer flow rate FE. It hints that case 3c bore already many of
the features that we now observe for a proper design. This will be discussed later.
3.3.3. Effect of Entrainer Purity on the Process. All the
optimization procedure done above for case 3 was run with an open-loop flow sheet (Figure 2b) where FE is pure water.
However, the real process should implement an entrainer recycle stream bearing some impurities. Based on the optimized results NF,E= 32, NF,AB= 48, NF,reg= 18, FE= 507.6 kmol/h, R1
= 2.48, and R2 = 1.09, for which OF = 28 217.7 kJ/kmol, a
simulation is run by using the closed-loop flow sheet displayed
in Figure 2a, with Wegstein tear method used for convergence. It happens that the entrainer purity converges to 0.9998. Although very close to 1, that affects the distillate acetone purity that becomes 0.9949, below the 0.995 specification. Methanol purity in the regeneration column remains above 0.995.
To solve this problem, we adjust R1and R2for the
closed-loop simulation and obtain the final design of the process labeled case 3opt with R1= 2.49 and R2= 1.10, for which OF =
28 318.5 kJ/kmol. We did not chose to adjust the entrainer flow rate because analysis of the rectifying section profile above the entrainer feed tray (Figure 3) shows that the methanol content is very low, a consequence of an extractive stable node that should lie very close to the water−acetone edge as discussed in section 3.2.
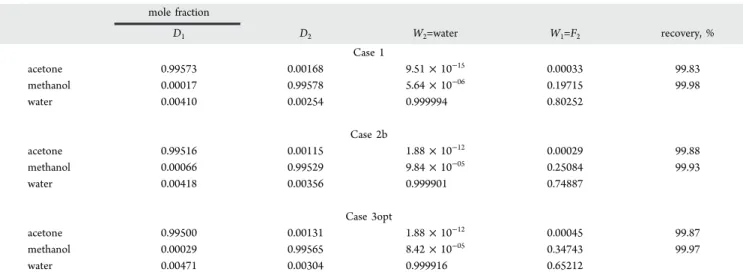
3.3.4. Summary of Optimal Design Parameters, Product Purity, and Recovery. The design and operating variables are shown in Table 4, referring to the flow sheet notations in Figure 2. Table S2 in the Supporting Information provides the cost data. Table 5 displays the product purity and recovery values.
The temperature and composition profiles in the two columns of case 3opt are shown in Figures 3 and 4.
Table 4 shows that Luyben’s parameter-based case 1 initial design could be improved while keeping the same number of trays in the extractive and regeneration columns. In summary: (1) The entrainer flow rate decreased drastically from 1100 kmol/h in case 1 to 807 kmol/h in case 2b, showing that improvement was possible due principally to a combination of a lower reflux ratio and a shift of feed locations. The extra reduction to 508 kmol/h for case 3opt proved the usefulness of decreasing the pressure in the extractive column, as deduced Table 3. Open-Loop Optimal Results of FE, R1, R2, NF,E,
N
F,AB, and NF,regunder Fixed D1and D2for the Extractive
Distillation of Acetone−Methanol with Water
NF,E NF,AB NF,reg FE P1 R1 P2 R2 OF, kJ/kmol
31 48 17 567.0 0.6 2.48 1 1.14 28 597.2 30 49 17 476.3 0.6 2.54 1 1.11 28 507.9 31 47 18 519.4 0.6 2.50 1 1.10 28 372.5 31 48 18 483.7 0.6 2.51 1 1.09 28 269.4 32 47 18 535.3 0.6 2.48 1 1.11 28 363.4 32 48 18 507.6 0.6 2.48 1 1.09 28 217.7 32 48 19 501.8 0.6 2.48 1 1.10 28 262.8 32 49 16 502.7 0.6 2.49 1 1.15 28 567.0 33 47 18 558.8 0.6 2.46 1 1.11 28 327.9 33 48 18 543.5 0.6 2.45 1 1.12 28 275.8 33 49 17 531.8 0.6 2.46 1 1.12 28 341.5
from the pressure dependency of the azeotrope composition and isovolatility curves. (2) Energy consumption underlying the OF value is reduced by 21.9% and 8.4% compared to cases 1 and 2, respectively. It is mostly attributed to the reduction in entrainer flow rate. (3) Meanwhile, TAC savings reach 16% and 3.7% due to the decrease of entrainer flow rate, column diameters and heat exchanger areas in the second column. (4) If we just take the extractive column in case 2 and case 3opt into account, the decrease of the pressure leads to an increase of the column diameter, and an increase of the condenser heat exchanger area due to the decrease of condenser temperature. However, the decrease of the pressure results in the decrease of reboiler duty by 12%, and the benefit of decreasing pressure overcomes the punishment as the annual cost of extractive column is reduced from 1.877 to 1.809 (×106$). Besides, the
increase of the temperature difference (driving force) in the reboiler due to the pressure decrease will lead to lower pressure of steam used. This aspect is not taken into account as we assume the same temperature driving force in all case and the same price for the used steam.
Table 4 also shows the importance of adjusting the feed tray locations to reduce the process energy consumption. Luyben explained that the feed tray locations of the column were found empirically by finding what locations give minimum energy consumption in their study. In our work, the two columns are taken into account and the feed location is optimized by give minimum OF using the two steps optimization method described in this work. This point is evidenced by comparing the total heat duty of case 1 (18.22 MW) and case 2b (15.55 MW): a 14.6% total heat duty is saved. Further decrease of the pressure allows an additional saving of 8.5% in heat duty between case 2b and case 3opt (14.23 MW).
Meanwhile, we notice that more acetone product (0.3kmol/ h) is obtained in cases 2b and 3 despite lower energy consumption than in case 1. This phenomenon is counter-intuitive: normally, the more products at specified purity are obtained, the more energy (reboiler duty) should be used. The reasonable interpretation is that our optimization is conducted following OF, which reflects the energy consumption per unit product. The optimization resulted in balancing the energy consumption more evenly between the extractive column and regeneration column with a reboiler duty ratio of 1.486 in case 1, 1.472 in case 2b, and 1.337 in case 3opt.
Regarding the TAC, we have used Douglas’s method with M&S 2011 index = 1511. The case 1 value ($3.469 × 10⁶) is
close to Luyben’s value ($3.750 × 10⁶), where he used different
k and m factors and energy consumption price. The case 3opt
value ($2.918 × 10⁶), which corresponds to 508 kmol/h of
entrainer, is close to Knapp and Doherty’s TAC ($2.75 × 10⁶),
obtained with 540 kmol/h of entrainer and submitted in January 1990.7If we use the 1989 M&S index = 895.1, the TAC value for our case 3opt design equals $2.414 × 10⁶.
Regarding product recovery, Table 5 shows that the recoveries are high and comparable for all three cases. Also for the temperature profile, the extractive section temperature is above 320 K which was the preset temperature of the entrainer feed, not further considered for optimization because we wanted to compare to Luyben’s design.
Table 4. Optimal Design Parameters and Cost Data from Closed-Loop Simulation for the Extractive Distillation of Acetone−Methanol with Water in Columns C1and C2
case 1 case 2b case 3opt
variables C1 C2 C1 C2 C1 C2 Next 57 57 57 P1, atm 1 1 0.6 FAB, kmol/h 540.0 540.0 540.0 W2, kmol/h 1098.2 804.9 505.9 Emakeup, kmol/h 1.8 2.1 2.1 FE, kmol/h 1100.0 807.0 508.0 D1, kmol/h 270.7 271.0 271.0 NF,E 25 31 32 NF,AB 40 48 48 R1 3.44 2.83 2.49 QC, MW 9.87 8.51 7.98 QR, MW 10.89 9.26 8.14 NR,reg 26 26 26 P2, atm 1 1 1 D2, kmol/h 271.1 271.1 271.1 NF,reg 14 17 18 R2 1.61 1.24 1.10 QC, MW 6.92 5.94 5.57 QR, MW 7.33 6.29 6.09 TAC, ×106$ 3.469 3.030 2.918 OF, kJ/kmol 36 247.5 30 916.2 28 318.5
Table 5. Product Purities and Recoveries for Case 1, 2, and 3op Designs
mole fraction D1 D2 W2=water W1=F2 recovery, % Case 1 acetone 0.99573 0.00168 9.51 × 10⁻¹⁵ 0.00033 99.83 methanol 0.00017 0.99578 5.64 × 10−06 0.19715 99.98 water 0.00410 0.00254 0.999994 0.80252 Case 2b acetone 0.99516 0.00115 1.88 × 10⁻¹² 0.00029 99.88 methanol 0.00066 0.99529 9.84 × 10−05 0.25084 99.93 water 0.00418 0.00356 0.999901 0.74887 Case 3opt acetone 0.99500 0.00131 1.88 × 10⁻¹² 0.00045 99.87 methanol 0.00029 0.99565 8.42 × 10−05 0.34743 99.97 water 0.00471 0.00304 0.999916 0.65212
3.4. Development of an Extractive Distillation Process Efficiency Indicator. 3.4.1. Extractive Section Efficiency. In line with the discussion about the tray location, we have noticed that the composition profiles in the extractive section have similar shapes for all cases 1, 2, and 3opt, but they differ significantly when looking at the composition values on the feed trays. This prompts us to define a novel efficiency indicator for the extractive section by the following equation:
= −
Eext xP,H xP,L (5)
where Eextis the total efficiency indicator of extractive section, xP,H the product mole fraction at one end of the extractive
section, and xP,Lthe product mole fraction at the other end of
extractive section. Here, we use the entrainer feed and the main feed trays’ locations as the ends of the extractive section.
For different designs of extractive distillation, different values of FE/F and number of trays in the extractive section will have
effect on Eext, so an efficiency indicator per tray in the extractive
section is needed: = e E N ext ext ext (6)
where eext is the efficiency indicator per tray and Next is the
number of trays in the extractive section.
Eext and eext describe the ability of the extractive section to
discriminate the desired product between the top and the bottom of the extractive section.
3.4.2. Comparison of Efficiencies for Extractive Process Design. The efficiency indicator per tray and total efficiency indicator of the extractive section are shown in Table 6 for cases 1, 2, and 3opt, along with the acetone composition at the
feed trays. Knapp and Doherty and Gil’s values are discussed afterward. Figure 5 also displays the extractive column composition profiles in a ternary map.
We make several remarks:
(1) A lower entrainer flow rate, as in case 2b and case 3opt, operating at low pressure is beneficial for reducing the energy consumption in both columns. This is why the OF in case 3opt decreases by 8.4% and 21.9% compared withOF in case 2b and case 1, respectively.
(2) For case 3opt, with the lowest entrainer flow rate, SNextis
closer to the product vertex, which may hint at a shorter rectifying section to reach the product purity specification.
(3) As discussed in section 3.2 and in earlier works10,11 the extractive section should have enough tray so that the composition at the entrainer feed tray should be near to the
Figure 4.Temperature and composition profiles of case 3opt regeneration column for the extractive distillation of acetone−methanol with water.
Table 6. Efficiencies of Per Tray and Total Extractive Section for the Extractive Distillation of Acetone−Methanol with Water acetone composition entrainer feed tray (SNext) feed tray Next Eext, ×10−3 eext, ×10−3 case 1c 0.358 0.303 15 55.4 3.69 case 2bd 0.372 0.234 17 138 8.13 case 3opt 0.428 0.272 16 156 9.72
Knapp and Doherty,
1990a 0.52 0.36 13 160 12.3
Gil et al., 2009a 0.525 0.40 16 125 7.8
aEstimated from Figure 9 in their work.7 bEstimated from Figure 22 in
their work.32 cClosed-loop simulation based on Luyben, 2008.15 dClosed-loop simulation from You et al., 2014.36
stable node of the extractive section SNExt. As shown in Figure
5, the SNExt location is near the product−entrainer edge
depends on the reflux and on the entrainer flow rate.11,23This point is also in agreement with the sensitivity analysis performed by Lang for the same separating system.41
(4) Extra trays used in stripping section in case 1 are needed to keep acetone from entering bottom liquid. For case 2b, the better efficiency of the extractive section to discriminate results in less trays needed in the stripping section. Case 3opt operating at another pressure, cannot be rightfully discussed here.
(5) The total efficiency indicator Eext and the efficiency
indicator per tray in extractive section eextincrease by 2.5 and
2.2 times in case 2b compared to case 1. It demonstrates the importance of finding a suitable extractive section position by moving the feed tray locations. For case 3opt, operating at a lower pressure which was shown in section 3.2 to be beneficial thanks to more favorable isovolatility curves and SNextlocation, Eextand eextare even better. Although one less tray than case 2b
is used in the extractive section, Eextincreases further by 13%
compared to case 2b, and boosts eext by 19%. Case 3opt is
therefore regarded as the most efficient design, as shown by the OF value that in case 3opt decreases by 8.4% and 21.9% compared with case 2b and case 1 respectively.
(6) The acetone−methanol relative volatility αAB profile
along the extractive distillation column (Figure 6) confirms the efficiency ranking. αABrises sharply at the entrainer feed tray
and drops at the main feed tray. In the extractive section of case 2b, the increase in αAB is larger than in case 1. This is a
remarkable achievement since the entrainer usage decreases by 26.6%, enabling to reduce the energy consumption as OF decrease by 14.7%. Case 3opt brings additional savings translated into a better efficiency as it operates at a higher level of relative volatility. This is because at lower pressure the volatility is higher as discussed in section 3.2.
We compare our design with the works of Luyben,15Knapp and Doherty,7and Gil et al.32The extractive efficiency for their design is reported in Table 6. Luyben’s design corresponds to our case 1.
Knapp and Doherty’s design has a larger efficiency. We interpret it as a consequence of a smaller reflux ratio. However, when we simulated Knapp and Doherty’s flow sheet we could recover 98.79% of the acetone and 98.74% of the methanol. This is attributed to the Van Laar thermodynamic model used by Knapp and Doherty that overestimated the relative volatility compared to our UNIQUAC model Notice that those authors
separated also an equimolar feed in 99.5 mol% pure acetone and methanol with a reflux ratio equal to 0.55 and 1. They also optimized additional parameters, like the feed quality and temperature, which we set fixed. Relaxing them, as in a future work in preparation could lead us to improve further our design.
Gil and co-workers’ design was done with the same UNIQUAC model. It does not exhibit an extractive efficiency as high as we do. But they used a rather high reflux ratio equal to 5 to separate an azeotropic feed rather than an equimolar feed. They also recovered a 99.0 mol% acetone distillate in a 52-tray column with entrainer and main feed streams entering the column at trays 22 and 48, respectively.
4. CONCLUSION
We have looked at improving the design of a homogeneous extractive distillation process for the separation of the acetone− methanol minimum boiling azeotrope with water. The process flow sheet includes both the extractive distillation column and the entrainer regeneration column. By using insight from the analysis of the ternary residue curve map and isovolatility curves, we have noticed the beneficial effect of lowering the pressure in the extractive distillation column for a 1.0-1a-m1 extractive separation class. A lower pressure reduces the minimal amount of entrainer and increases the relative volatility of acetone−methanol for the composition in the distillation region where the extractive column operates. A 0.6 atm pressure was selected to enable the use of cheap cooling water in the condenser.
We then ran an optimization aimed at minimizing the total energy consumption per product unit as objective function OF. OF includes both products and both columns’ energy demands at boiler and condenser and accounts both for the price difference in heating and cooling energy and for the price difference in product sales. Rigorous simulations in the closed-loop flow sheet were done in all cases. For the sake of comparison, we have kept the total number of trays identical to those used in the literature works of Luyben and of Knapp and Doherty. Other variables have been optimized: entrainer flow rate, reflux ratios, entrainer feed location, and main feed location. The total annualized cost (TAC) was calculated for all processes.
Figure 5.Liquid composition profiles for case 1, 2, and 3 extractive distillation column designs for the extractive distillation of acetone− methanol with water.
Figure 6.Volatility profile of acetone vs methanol along the extractive column for the extractive distillation of acetone−methanol with water.
Double-digit savings in energy consumption and in TAC have been achieved compared to literature values thanks to the optimized scheme based on thermodynamic insight analysis. Two important issues have emerged. First, the reduction of pressure is beneficial to the separation by extractive distillation. Second, we have proposed a novel function expressing the efficiency of the extractive section and found it correlated with the best design. The efficiency of the extractive section describes the ability of the extractive section to discriminate the desired product between the top and the bottom of the extractive section. We have shown that a high Eextis correlated
to a well-designed extractive distillation process. We have noticed that a suitable shift of the feed trays’ locations improves the efficiency of the separation, even when less entrainer is used, and related that to thermodynamic insight gained from the ternary diagram analysis. Comparison with literature design confirms that the total extractive efficiency and the extractive efficiency per tray functions are relevant criteria to assess the performance of an extractive distillation process design.
Further optimization work is in progress to include the efficiency indicator as a secondary objective function to design extractive distillation processes. Additional optimization varia-bles like the total number of trays will also be included.
■
ASSOCIATED CONTENT*
S Supporting InformationBinary interaction parameters for the UNIQUAC model of acetone−methanol−water (Table S1), sizing and economic cost calculations (Appendix S1), and sizing data for case 1, case 2, and case 3opt processes (Table S2). This material is available free of charge via the Internet at http://pubs.acs.org.
■
AUTHOR INFORMATIONCorresponding Author
*E-mail: [email protected]. Notes
The authors declare no competing financial interest.
■
ACKNOWLEDGMENTSX.Y. thanks the Chinese Scientific Council for its support of this work.
■
REFERENCES(1) Widagdo, S.; Seider, W. D. Journal Review Azeotropic Distillation. AIChEJ. 1996, 42, 960.
(2) Knapp, J. P.; Doherty, M. F. A New Pressure-swing-distillation Process for Separating Homogeneous Azeotropic Mixtures. Ind. Eng.
Chem. Res. 1992, 31, 346.
(3) Phimister, J. R.; Seider, W. D. Semicontinuous, Pressure-swing Distillation. Ind. Eng. Chem. Res. 2009, 39, 122.
(4) Pierotti, G. J. Extractive Distillation Process. U.S. Patent 2,455,803, 1948.
(5) Lelkes, Z.; Lang, P.; Moszkowicz, P.; Benadda, B.; Otterbein, M. Batch Extractive Distillation: the Process and the Operational Policies.
Chem. Eng. Sci. 1998, 53, 1331.
(6) Lei, Z.; Li, C.; Chen, B. Extractive Distillation: a Review. Sep.
Purif. Rev. 2003, 32, 121.
(7) Knapp, J. P.; Doherty, M. F. Thermal Integration of Homogeneous Azeotropic Distillation Sequences. AIChE J. 1990, 36, 969.
(8) Figueiredo, M. F.; Guedes, B. P.; De Araujo, J. M.; Vasconcelos, L. G. S.; Romildo, R. P. Optimal Design of Extractive Distillation Columnsa Systematic Procedure Using a Process Simulator. Chem.
Eng. Res. Des. 2011, 89, 341.
(9) Lang, P.; Lelkes, Z.; Otterbein, M.; Benadda, B.; Modla, G. Feasibility Studies for Batch Extractive Distillation with a Light Entrainer. Comput. Chem. Eng. 1999, 23, S93.
(10) Lelkes, Z.; Lang, P.; Benadda, B.; Moszkowicz, P. Feasibility of Extractive Distillation in a Batch Rectifier. AIChE J. 1998, 44, 810.
(11) Rodríguez-Donis, I.; Gerbaud, V.; Joulia, X. Thermodynamic Insights on the Feasibility of Homogeneous Batch Extractive Distillation. 1. Azeotropic Mixtures with Heavy Entrainer. Ind. Chem.
Eng. Res. 2009, 48, 3544.
(12) Rodríguez-Donis, I.; Gerbaud, V.; Joulia, X. Thermodynamic Insights on the Feasibility of Homogeneous Batch Extractive Distillation, 2.Low-Relative-Volatility Binary Mixtures with a Heavy Entrainer. Ind. Chem. Eng. Res. 2009, 48, 3560.
(13) Rodríguez-Donis, I.; Gerbaud, V.; Joulia, X. Thermodynamic Insights on the Feasibility of Homogeneous Batch Extractive Distillation, 3.Azeotropic Mixtures with Light Boiling Entrainer. Ind.
Chem. Eng. Res. 2012, 51, 4643.
(14) Rodríguez-Donis, I.; Gerbaud, V.; Joulia, X. Thermodynamic Insights on the Feasibility of Homogeneous Batch Extractive Distillation, 4.Azeotropic Mixtures with Intermediate Boiling En-trainer. Ind. Chem. Eng. Res. 2012, 51, 6489.
(15) Luyben, W. L. Comparison of Extractive Distillation and Pressure-swing Distillation for Acetone−Methanol Separation. Ind.
Eng. Chem. Res. 2008, 47, 2696.
(16) Laroche, L.; Bekiaris, N.; Andersen, H. W.; Morari, M. Homogeneous Azeotropic Distillation: Comparing Entrainers. Can. J.
Chem. Eng. 1991, 69, 1302.
(17) Botía, D. C.; Riveros, D. C.; Ortiz, P.; Gil, I. D.; Sanchez, O. F. Vapor− Liquid Equilibrium in Extractive Distillation of the Acetone/ Methanol System Using Water as Entrainer and Pressure Reduction.
Ind. Eng. Chem. Res. 2010, 49, 6176.
(18) Petlyuck, F. B. Distillation Theory and Its Application to Optimal
Design of Separation Units; Cambridge University Press: Cambridge,
2004.
(19) Knapp, J. P.; Doherty, M. F. Minimum Entrainer Flow for Extractive Distillation: A Bifurcation Theoretic Approach. AIChE J. 1994, 40, 243.
(20) Li, G.; Bai, P. New Operation Strategy for Separation of Ethanol−Water by Extractive Distillation. Ind. Eng. Chem. Res. 2012,
51, 2723.
(21) Shen, W.; Benyounes, H.; Gerbaud, V. Extension of Thermodynamic Insights on Batch Extractive Distillation to Continuous Operation. 1. Azeotropic Mixtures with a Heavy Entrainer. Ind. Eng. Chem. Res. 2013, 52, 4606.
(22) Shen, W.; Gerbaud, V. Extension of Thermodynamic Insights on Batch Extractive Distillation to Continuous Operation. 2. Azeotropic Mixtures with a Light Entrainer. Ind. Eng. Chem. Res. 2013, 52, 4623.
(23) Gerbaud, V.; Rodriguez-Donis, I. Extractive distillation. In
Distillation Book, Vol. II; Gorak, A., Olujic, Z., Eds.; Elsevier:
Amsterdam, 2014; Chapter 6, p 201 (ISBN 978-0-12-386878-7). (24) Lynn, S.; Hanson, D. N. Multi-effect Extractive Distillation for Separating Aqueous Azeotropes. Ind. Eng. Chem. Process Des. Dev. 1986, 25, 936.
(25) Kossack, S.; Kraemer, K.; Gani, R.; Marquardt, W. A Systematic Synthesis Framework for Extractive Distillation Processes. Chem. Eng.
Res. Des. 2008, 86, 781.
(26) Hilmen, E. K.; Kiva, V. N.; Skogestad, S. Topology of Ternary VLE Diagrams: Elementary Cells. AIChE J. 2002, 48, 752.
(27) Laroche, L.; Bekiaris, N.; Andersen, H. W.; Morari, M. The Curious Behavior of Homogeneous Azeotropic DistillationImplica-tions for Entrainer Selection. AIChE J. 1992, 38, 1309.
(28) Steger, C.; Varga, V.; Horvath, L.; Rev, E.; Fonyo, Z.; Meyer, M.; Lelkes, Z. Feasibility of Extractive Distillation Process Variants in Batch Rectifier Column. Chem. Eng. Process 2005, 44, 1237.
(29) Rodriguez-Donis, I.; Gerbaud, V.; Joulia, X. Thermodynamic Insight on Extractive Distillation with Entrainer Forming New Azeotropes. In Distillation Absorption 2010; Eindhoven, Netherlands, 2010 (ISBN 978-90-386-2215-6).
(30) Hilal, N.; Yousef, G.; Langston, P. The Reduction of Extractive Agent in Extractive Distillation and Auto-extractive Distillation. Chem.
Eng. Proc. Process Intensification 2002, 41, 673.
(31) Langston, P.; Hilal, N.; Shingfield, S.; Webb, S. Simulation and Optimisation of Extractive Distillation with Water as Solvent. Chem.
Eng. Proc. Process Intensification 2005, 44, 345.
(32) Gil, I. D.; Botia, D. C.; Ortiz, P.; Sánchez, O. F. Extractive Distillation of Acetone/Methanol Mixture Using Water as Entrainer.
Ind. Eng. Chem. Res. 2009, 48, 4858.
(33) Kiss, A. A.; Suszwalak, D. J. Enhanced Bioethanol Dehydration by Extractive and Azeotropic Distillation in Dividing-wall Columns.
Sep. Purif. Technol. 2012, 86, 70.
(34) Kossack, S.; Kraemer, K.; Gani, R.; Marquardt, W. A Systematic Synthesis Framework for Extractive Distillation Processes. Chem. Eng.
Res. Des. 2008, 86, 781.
(35) García-Herreros, P.; Gómez, J. M.; Gil, I. D.; Rodriguez, G. Optimization of the Design and Operation of an Extractive Distillation System for the Production of Fuel Grade Ethanol Using Glycerol as Entrainer. Ind. Eng. Chem. Res. 2011, 50, 3977.
(36) You, X.; Rodriguez-Donis, I.; Gerbaud, V. Extractive Distillation Process Optimisation of the 1.0-1a Class System, Acetone-Methanol with Water. In 24th European Symposium on Computer Aided Process
Engineering; Klemes, J. J., Varbanov, S. V., Liew, P. Y., Eds.; Elsevier:
Amsterdam, 2014 (ISBN 978-0-444-63456-6).
(37) Arifin, S.; Chien, I. L. Design and Control of an Isopropyl Alcohol Dehydration Process via Extractive Distillation Using Dimethyl Sulfoxide as an Entrainer. Ind. Eng. Chem. Res. 2008, 47, 790. (38) Douglas, J. M. Conceptual Design of Chemical Processes; McGraw-Hill: New York, 1988.
(39) Marshall; Swift. Average M & S index for year 2011. Chem. Eng. 2012, 119, 84.
(40) Kamath, G.; Georgiev, G.; Potoff, J. J. Molecular Modeling of Phase Behavior and Microstructure of Acetone-Chloroform-Methanol Binary Mixtures. J. Phys. Chem. B 2005, 109, 19463.
(41) Lang, P. Computation of Multicomponent, Multistage Separation Processes. In: Pallai, I.; Fonyo, Z. Studies in
Computer-Aided Modelling, Design and Operation: Unit Operations. Elsevier: