HAL Id: inserm-02613446
https://www.hal.inserm.fr/inserm-02613446
Submitted on 20 May 2020
HAL is a multi-disciplinary open access
archive for the deposit and dissemination of
sci-entific research documents, whether they are
pub-lished or not. The documents may come from
teaching and research institutions in France or
abroad, or from public or private research centers.
L’archive ouverte pluridisciplinaire HAL, est
destinée au dépôt et à la diffusion de documents
scientifiques de niveau recherche, publiés ou non,
émanant des établissements d’enseignement et de
recherche français ou étrangers, des laboratoires
publics ou privés.
transcriptome-wide interplay between 3’-to-5’
exoRNases and RNase Y
Laura Broglia, Anne-Laure Lécrivain, Thibaud Renault, Karin Hahnke, Rina
Ahmed-Begrich, Anaïs Le Rhun, Emmanuelle Charpentier
To cite this version:
Laura Broglia, Anne-Laure Lécrivain, Thibaud Renault, Karin Hahnke, Rina Ahmed-Begrich, et al..
An RNA-seq based comparative approach reveals the transcriptome-wide interplay between 3’-to-5’
exoRNases and RNase Y. Nature Communications, Nature Publishing Group, 2020, 11 (1), pp.1587.
�10.1038/s41467-020-15387-6�. �inserm-02613446�
An RNA-seq based comparative approach reveals
the transcriptome-wide interplay between 3
′-to-5′
exoRNases and RNase Y
Laura Broglia
1,2,3,5
, Anne-Laure Lécrivain
1,2,4,5
, Thibaud T. Renault
1,2,3
, Karin Hahnke
1,2
,
Rina Ahmed-Begrich
1,2
, Anaïs Le Rhun
1,2
✉
& Emmanuelle Charpentier
1,2,3,4
✉
RNA degradation is an essential process that allows bacteria to control gene expression and
adapt to various environmental conditions. It is usually initiated by endoribonucleases
(endoRNases), which produce intermediate fragments that are subsequently degraded by
exoribonucleases (exoRNases). However, global studies of the coordinated action of these
enzymes are lacking. Here, we compare the targetome of endoRNase Y with the targetomes
of 3
′-to-5′ exoRNases from Streptococcus pyogenes, namely, PNPase, YhaM, and RNase R. We
observe that RNase Y preferentially cleaves after guanosine, generating substrate RNAs for
the 3
′-to-5′ exoRNases. We demonstrate that RNase Y processing is followed by trimming of
the newly generated 3
′ ends by PNPase and YhaM. Conversely, the RNA 5′ ends produced by
RNase Y are rarely further trimmed. Our strategy enables the identi
fication of processing
events that are otherwise undetectable. Importantly, this approach allows investigation of the
intricate interplay between endo- and exoRNases on a genome-wide scale.
https://doi.org/10.1038/s41467-020-15387-6
OPEN
1Max Planck Unit for the Science of Pathogens, D-10117 Berlin, Germany.2Max Planck Institute for Infection Biology, Department of Regulation in Infection
Biology, D-10117 Berlin, Germany.3Institute for Biology, Humboldt University, D-10115 Berlin, Germany.4The Laboratory for Molecular Infection Medicine
Sweden (MIMS), Umeå Centre for Microbial Research (UCMR), Department of Molecular Biology, Umeå University, S-90187 Umeå, Sweden.5These authors
contributed equally: Laura Broglia, Anne-Laure Lécrivain. ✉email:[email protected];[email protected]
123456789
T
he ability to modulate gene expression enables bacteria to
rapidly adapt to their environment. Ribonucleases
(RNa-ses) regulate transcript abundance, leading to RNA
maturation (e.g., for tRNAs, rRNAs), stabilization or degradation.
Eventually, all transcripts—even the most stable—are degraded
by RNases, leading to the renewal of the nucleotide pool.
As a general rule, RNA degradation starts with an
endonu-cleolytic processing in the RNA body, leading to the generation of
decay intermediates. Those are further digested by exoRNases and,
finally, by oligoRNase/nanoRNases
1. The main endoRNases that
have been demonstrated to initiate RNA decay are RNase E in
Gram-negative bacteria and its functional orthologue RNase Y in
Gram-positive bacteria
2,3. However, in many Gram-positive
bac-teria, RNA degradation can also be initiated by the complex of
RNases J1/J2, which displays both endo- and 5′-to-3′
exoribonu-cleolytic activities
4–6. The initial processing of a transcript is the
limiting step of the RNA decay and the access of endoRNases to
transcripts is usually restricted. For instance, RNase E favours 5′
monophosphorylated (5′ P) transcripts and cleaves 2 nt upstream
of a uridine (U) in A/U rich regions
7,8. RNase Y also prefers 5′ P
transcripts
9and additional requirements have been described
depending on the orthologue studied. In Staphylococcus aureus,
RNase Y processes transcripts preferably downstream of a
gua-nosine (G)
10. In Streptococcus pyogenes, a G is required for the
in vivo processing of the speB transcript, encoding a major
viru-lence factor
11. In Bacillus subtilis and S. aureus, RNase Y
pro-cessing relies on proximal RNA secondary structures
9,12.
The decay intermediates, once generated by endoRNase(s), are
cleared immediately from the cell by 3′-to-5′ exoRNases
13. In E.
coli, the decay intermediates are mainly degraded by the 3′-to-5′
exoRNases II, R and PNPase
14,15. In B. subtilis and S. pyogenes,
the major 3′-to-5′ exoRNase is PNPase
16,17. In addition, in B.
subtilis, the 3′-to-5′ exoRNases PH and YhaM participate in RNA
decay, albeit with lower efficiency than the main 3′-to-5′
exoR-Nase
16. S. pyogenes YhaM exhibits a very short processivity (3 nt
on average) on a large number of RNA 3′ ends, the impact of
which on mRNA decay is currently unknown
17.
With the emergence of RNA sequencing techniques allowing
the global detection of RNase cleavage sites, several targetomes of
endoRNases have been determined, such as those of RNase Y in
S. aureus and B. subtilis
10,18. To date, the activity and specificity
of 3′-to-5′ exoRNases towards decay intermediates produced by a
given endoRNase have never been studied on a global scale.
Here, we present a comparative RNA-seq based approach that
allows us to dissect the complex landscape of RNA ends in S.
pyogenes. We study the interplay of endoRNase Y with 3′-to-5′
exoRNases in S. pyogenes, a pathogen causing a wide range of
diseases in humans. We determine the
first targetome of RNase Y
in this bacterium and compare it with three 3′-to-5′ exoRNase
targetomes, previously characterized by our laboratory
17. We
show on a global scale that RNase Y mainly acts in concert with
PNPase during RNA degradation. In this regard, we demonstrate
a role of the RNase Y-PNPase interplay in the control of the
differential stability of polycistronic mRNAs and the decay of 5′
regulatory elements. This strategy allows us to elucidate the
interplay and dynamics of endoRNase- and exoRNase-mediated
RNA processing events otherwise not detectable when RNases are
studied separately.
Results
In vivo RNase Y targetome. To identify RNase Y processing
positions, we compared the abundance of RNA ends (5′ and 3′) in
the S. pyogenes wild type (WT), RNase Y deletion mutant (Δrny)
and complemented RNase Y deletion mutant (Δrny::rny) strains,
as described previously for other RNases in this bacterium
17,19(Fig.
1
a and Methods). A total of 320 RNA ends, which were
more abundant in the WT than in the
Δrny strain, were retrieved:
190 RNA 5′ ends and 130 RNA 3′ ends (Fig.
1
b and
Supple-mentary Data 1). Because these ends depended on the presence of
RNase Y, we referred to these positions as
“rny_ends”. We could
not identify 5′ and 3′ rny_ends located at neighbouring
nucleo-tides, indicative of a single processing event (Fig.
1
c). Therefore,
we deduced that the upstream and/or downstream RNA
frag-ments generated by RNase Y processing are degraded by
exoR-Nases. When several ends were identified at consecutive
nucleotides, only one position was kept (see Methods) and named
“stepped” (S). When ends mapped to one nucleotide, they were
referred to as
“unique” (U) positions (Fig.
1
d). The 5′ and 3′
rny_ends harboured distinct features. First, the 3′ ends were
mainly S-RNA ends whereas the identified 5′ ends were mostly
U-RNA ends (Fig.
1
e). Second, the RNA 5′ and 3′ ends differed in
the nature of the sequence found in their proximity. Indeed, we
observed the presence of a G upstream of the RNA 5′ ends (87.4%
of the cases), which we did not observe for the RNA 3′ ends
(Fig.
1
f). This strong preference for G indicates that this
nucleotide might play an important role in RNase Y target
recognition and/or processing (Fig.
1
f). Third, we observed a
decrease in the minimum free energy (MFE) upstream of the 3′
rny_ends, indicative of a putative RNA structure. In contrast, the
MFE in proximity of the 5′ rny_ends increased compared with
the surrounding regions, indicating that these sequences
corre-sponded to single-stranded RNA regions (Fig.
1
f). The
observa-tion that the 3′ rny_ends identified by our analysis harboured a
“stepped” profile and that the G was not conserved suggests that
these ends could result from trimming by 3′-to-5′ exoRNases,
which do not stop precisely at an exact nucleotide
20–22. Because
these 3′ rny_ends depend on the presence of RNase Y, trimming
by 3′-to-5′ exoRNases would be subsequent to RNase Y
processing.
Comparison of the RNase Y and 3′-to-5′ exoRNase targetomes.
To investigate whether the 3′ rny_ends originated from 3′-to-5′
exoribonucleolytic activity, we compared the RNase Y targetome
with the targetomes of three 3′-to-5′ exoRNases (PNPase, YhaM
and RNase R) recently characterized by our laboratory
17(Fig.
2
).
In our previous study, we identified the processing sites of 3′-to-5′
exoRNases by comparing the abundance of the RNA 3′ ends
between the WT and 3′-to-5′ exoRNase mutant (Δexornase)
strains. The RNA 3′ ends more abundant in the Δexornase strain
and the 3′ ends more abundant in the WT strain were annotated
as exoRNase trimming start and stop positions, respectively
(Supplementary Fig. 1)
17. The targetomes were compared using
two different approaches, which are described in the next two
sections, and we found that 58% of the identified 3′ rny_ends
corresponded to 3′-to-5′ exoRNase—mainly PNPase—trimming
start or stop positions (Fig.
2
). We believe that the remaining 42%
of the rny_3′ ends were also further trimmed upon processing by
RNase Y, as we could not detect a preference for a G at these
positions. We did not match these 3′ rny_ends with 3′-to-5′
exoRNase start or stop positions because they were likely targeted
by several 3′-to-5′ exoRNases at once or by unidentified RNases.
Overall, we conclude that PNPase is the main 3′-to-5′ exoRNase
that acts in concert with RNase Y to degrade RNAs in S. pyogenes
(Fig.
2
).
Pairing 3
′ rny_ends and exoRNase trimming stop positions. In
our comparative analysis, we identified 46, 27 and one 3′
rny_ends corresponding to PNPase, YhaM and RNase R
trim-ming stop positions, respectively, suggesting that the trimtrim-ming of
these RNAs was RNase Y dependent (Fig.
2
in red, Fig.
3
a,
Supplementary Data 2). With this comparison, we identified
RNase Y-processed RNAs that were targeted by 3′-to-5′
exoR-Nases and not entirely digested (Fig.
3
a). For a few examples, we
observed that the RNAs were trimmed by YhaM and an
addi-tional 3′-to-5′ exoRNase: one RNA was trimmed by YhaM and
RNase R, and six were trimmed by PNPase and YhaM (Fig.
2
and
Supplementary Data 2).
We further aimed to identify the initial RNase Y processing
position of these targets and we hypothesized that it would
correspond to the position where the exoRNase starts trimming.
Therefore, we searched for 3′-to-5′ exoRNase trimming start
positions that were located downstream of the 3′ rny_ends (Fig.
3
a).
We retrieved 19 and 5 trimming start positions for PNPase and
YhaM, respectively, which could correspond to the RNase Y initial
processing positions (Fig.
3
a and Supplementary Data 3). We
observed enrichment of G at the 19 PNPase trimming start
positions (Fig.
3
b), with 9 mapped to a G and 9 located 1 or 2 nt
upstream of a G (Supplementary Data 3). Considering the
frequency of G around the PNPase start positions, we hypothesize
that the initial RNase Y processing (PNPase trimming start
positions) actually occurs at G (Fig.
3
a and b). The 1 or 2 nt
distance from G is likely due to the known nibbling activity of
YhaM that we observed in S. pyogenes
17. Similarly, 4 trimming
start positions of YhaM were located at a G (Supplementary
Data 3). One other position, located at an adenosine, corresponded
to a predicted PNPase trimming stop position and was identified in
the transcript encoding the putative SPy_0316 protein
(Supple-mentary Data 3). Upon RNase Y processing, the SPy_0316 mRNA
was trimmed
first by PNPase and then by YhaM (Fig.
3
d). We
indeed identified a 3′ rny_end corresponding to PNPase and YhaM
stop positions (Supplementary Data 2, Fig.
3
d). PNPase started
trimming, 34 nt upstream of the stop position (Fig.
3
d and
Supplementary Data 5), at a G corresponding to the initial RNase
Y processing position, followed by YhaM, which stopped at the
base of a stem loop predicted in the middle of the SPy_0316 open
reading frame (ORF) (Fig.
3
e). The YhaM trimming start position
was not detected in the absence of PNPase (Fig.
3
d), which
confirmed that YhaM targeted the RNA 3′ end generated by
PNPase. Similarly, we observed subsequent trimming of PNPase
and YhaM upon RNase Y processing in the intergenic region
between Spy_sRNA73113 and rplO, encoding the 50S ribosomal
200 100 2 1 0 –10 –5 –4 –6 –8 –10 –12 –50 –25
Distance to the processing site (nt)
0 25 50 –50 –25
Distance to the processing site (nt) 0 25 50 –1+1 5 10 –10 –5 –1+1 5 10 % of ends Bits Δ G (kcal mol –1 ) 80 60 40 20 0 U S NNNNNNN rny_end 5′ rny_end 3′ rny_end 3′ rny_ends n = 130 5′ rny_ends n = 190 Δrny Δrny::rny Number of rn y _ends 175 150 125 100 130 upstream RNA fragments 190 downstream RNA fragments 3′ 5′ 5′ 5′ or 3′ end 5′ 3′ 3′ or RNase Y WT WT
a
e
Total End Total End Unique end (U)Stepped end (S) WT 5′ 3′ 75 50 25 0
b
c
d
f
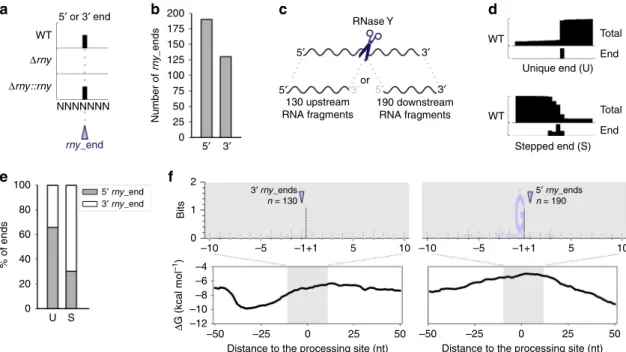
Fig. 1 RNase Y processes RNAs after a guanosine. a Representation of RNA end (5′ or 3′) profiling obtained by RNA sequencing (performed in biological triplicates). The RNA ends that were more abundant in the wild type (WT) and complemented rny deletion strain (Δrny::rny) than in the RNase Y deletion strain (Δrny) are annotated as rny_end. “NNNNNNN” represents a sequence processed by RNase Y. b The bar plot shows the number of 5′ or 3′ ends that were more abundant in the WT than in theΔrny strain (see Methods). c RNase Y cleavage (scissors) generates two processing products. We never retrieved both the RNA fragments upstream and downstream of the cleavage site for the same processing event.d Schematic drawing of total and end (5′ or 3′) coverages from RNA sequencing, illustrating RNA 5′ “unique” (U) and 3′ “stepped” (S) end positions. e Proportion of RNA 5′ and 3′ ends classified as U and S. f Sequence and structure conservation of the identified 5′ and 3′ rny_ends. The logo was created from the alignment of all sequences 10 nt on each side of the identified ends. Error bars are automatically calculated by the WebLogo library and correspond to an approximate Bayesian 95% confidence interval. The minimum free energy (ΔG) was calculated at each nucleotide position using a sliding window of 50 nt over the entire genome. The averageΔG (kcal mol−1) calculated for a window of 100 nt centred on the identified ends is depicted.
150 42% 80 YhaM-RNase R PNPase-YhaM PNPase PNPase YhaM YhaM 60 40 20 10 5 0
3′-to-5′ exoRNase stops 3′-to-5′ exoRNase starts Not identified as 3′-to-5′ exoRNase trimming
0 58% T otal n umber 3′ rn y _ends 125 100 75 50 25 0
Fig. 2 3′-to-5′ exoRNases trim RNAs generated by RNase Y processing. Left bar plot: portion of RNA 3′ ends (3′ rny_ends) corresponding to 3′-to-5′ exoRNase start positions (bottom portion), 3′-to-5′ exoRNase stop positions (middle portion) and not associated with 3′-to-5′ exoRNase (top portion). Right bar plots: number of trimming starts (top) and stops (bottom) that correspond to 3′ rny_ends, which were uniquely produced by PNPase and YhaM or produced by two different 3′-to-5′ exoRNases.
Δrny Δexornase Comparison WT Δrny WT ΔpnpA ΔyhaM WT RNA-seq RNase Y PNPase PNPase –4 Δ G (kcal mol –1 ) –6 –8 –10 –12 –100 –10 2.0 1.0 Bits 0.0 –5 –1+1 5 10 –75
Distance to the processing site (nt) Distance to the processing site (nt)
–50 –25 0 25 50 75 100 YhaM G exoRNase stop 3′ rny_end 3′ end 3′ ends Total SPy_0315 SPy_0316 850 bp 45 bp [0 - 2000] [0 - 300] [0 - 300] exoRNase start Model YhaM start 3′ rny_end 3′ rny_end PNPase start PNPase/YhaM stop YhaM stop PNPase stop (n = 183) PNPase start (n = 19) 5′ 3′
a
c
d
b
e
f
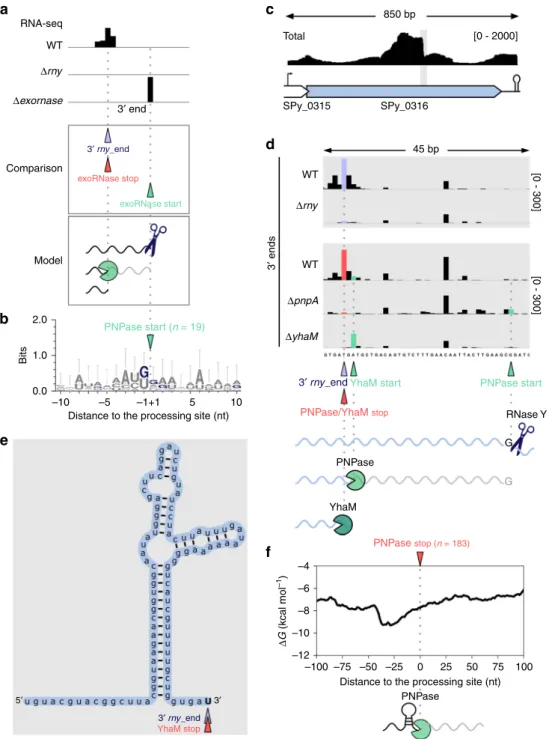
GFig. 3 RNase Y-generated RNAs are degraded by PNPase until secondary structures are encountered. a Upper panel: example of 3′ end coverage profiling from RNA sequencing. Middle panel: the RNA ends that were more abundant in the WT than in the Δrny strain are indicated below the coverage and depicted with purple arrowheads (3′ rny_ends). The RNA ends corresponding to the trimming start and stop positions of exoRNases are depicted with green and red arrowheads, respectively (see Supplementary Fig. 1). The 3′ rny_ends were paired to 3′-to-5′ exoRNase stop positions (Supplementary Data 2 and Fig.2, bottom). Bottom panel: the 3′-to-5′ exoRNases (‘pacman’ symbols) started trimming upon RNase Y (scissors) processing and stopped before the RNA termini. The 3′ rny_ends corresponding to the 3′-to-5′ exoRNase stop positions were compared with the exoRNase trimming start positions located downstream. The 3′-to-5′ exoRNase start position corresponds to the initial RNase Y processing position (Supplementary Data 3). b The logo, displaying the information (bits), was created from the alignment of all sequences surrounding the 19 identified PNPase trimming start positions. c Total coverage of SPy_0316 (encoding a putative transcriptional regulator) in WT obtained by RNA sequencing, and schematic representation of the locus. The grey rectangle indicates the region where the processing sites of RNase Y, PNPase and YhaM were identified. d 3′ end coverage of a portion of SPy_0316 in the WT,Δrny, YhaM deletion mutant (ΔyhaM) and PNPase deletion mutant (ΔpnpA) strains. The coverage scales are indicated between brackets. RNase Y processed the RNA after a G, corresponding to the detected PNPase trimming start position. PNPase trimmed 34 nt of the SPy_0316 RNA 3′ end. This new RNA 3′ end was subsequently nibbled by YhaM. e RNA folding of the region 100 nt upstream of the 3′ rny_ends corresponding to YhaM trimming stop positions. YhaM started trimming after PNPase stopped, at the base of the stem loop structure, and consequently removed 2 nt from the RNA 3′ end. f Structure conservation at the 183 PNPase stop positions previously identified17. The decrease in the minimum free energy (ΔG, kcal mol−1) is indicative of
protein L15 (Supplementary Fig. 2). The concerted action of these
RNases is likely involved in the sRNA 3′ end production
(Supplementary Fig. 2). These examples illustrate that in addition
to targeting RNA 3′ ends after terminator regions and endoRNase
processing
17, YhaM also trims RNA 3′ ends generated by other
3′-to-5′ exoRNases.
In the previous examples, we observed that PNPase stopped
trimming these RNAs until encountering stem loop structures,
suggesting that these structures prevented further degradation. In
our previous publication, we calculated the average MFE (ΔG, in
kcal mol
−1) around PNPase stop positions using 25 nt-long
sequences, which are sufficient for detection of terminator
structures, and we could not predict any structure
17. Here, we
used 50 nt sequences for the calculation, allowing us to detect
variations in
ΔG that are indicative of structures longer and weaker
than the structures of terminator regions. Indeed, we observed a
decrease in the MFE upstream of the PNPase stop positions
(Fig.
3
f). Therefore, we now conclude that PNPase can be blocked
by RNA structures, as previously described in vitro for PNPase
from other bacteria
21,23,24.
Pairing 3′ rny_ends and exoRNase trimming start positions.
Six PNPase and two YhaM trimming start positions
corre-sponded to the RNA 3′ ends produced by RNase Y (Fig.
2
in
green and Fig.
4
a). Therefore, the 3′ ends generated by RNase Y
are targeted by these exoRNases. Their detection in this analysis
suggests that a portion of the RNAs had not yet been subjected to
3′-to-5′ exoRNase degradation.
PNPase trimming start positions were located at a G and
probably corresponded to the RNA 3′ ends generated by RNase Y
(Fig.
4
b and Supplementary Fig. 3). For the rofA, Spy_sRNA482963,
ezrA and htrA transcripts, PNPase trimming starts corresponded to
the 3′ ends of previously identified decay intermediates (Fig.
4
b and
Supplementary Fig. 3), which were degraded by PNPase up to the 5′
end of the decay intermediate
17. The two other targets, namely,
rpsU and the intergenic region between Spy_sRNA1696464 and
Spy_sRNA1696905, were also likely degraded up to the RNA
termini (5′ ends), as the PNPase stop positions were not detected
(Supplementary Fig. 3). Notably, it is known that PNPase usually
releases 2- to 5-nt-long oligoribonucleotides, which are then further
degraded by oligoRNase/nanoRNases
25. For simplicity, in the
following text, we write that PNPase degrades RNAs up to their
termini.
Pairing 5′ rny_ends to exoRNase trimming start positions. We
identified 190 RNA 5′ rny_ends that could not be paired with 3′
rny_ends, meaning that the RNA 3′ ends produced during the
same processing events were not detected in the WT strain
(Fig.
5
a, Supplementary Data 1). In the comparisons described
above, we observed that most of the 3′ rny_ends were targeted by
3′-to-5′ exoRNases. Therefore, 3′-to-5′ exoRNases most likely also
degraded the RNA fragment upstream of the RNase Y processing
positions, which explains why we were not able to detect those
RNAs.
To investigate this hypothesis, we paired the 5′ rny_ends to
3′-to-5′ exoRNase trimming start positions. In particular, we screened
for trimming start positions within 10 nt upstream of the 190 RNA
Δrny WT 40 bp 40 bp [0 - 130] [0 - 130] [0 - 250] [0 - 250] [0 - 160] [0 - 160] [0 - 100] [0 - 100] Spy_sRNA482963 rofA G G Δrny Δexornase Comparison Model exoRNase start PNPase start WT RNA-seq
a
ΔpnpA WT 3′ rny_end 3′ rny_end PNPase start 3′ rny_end 3′ ends Δrny WT ΔpnpA WT 3′ ends 3′ 5′ 5′ 5′ 5′Decay intermediate Decay intermediate 3′
3′ 3′ 3′ end
b
Fig. 4 Initial RNase Y cleavage position validated by PNPase trimming start positions. a Upper panel: example of 3′ end coverage profiling from RNA sequencing. Middle panel: the RNA ends that were more abundant in the WT than in theΔrny strain are indicated below the coverage and depicted with purple arrowheads (3′ rny_ends). The RNA ends corresponding to the trimming start positions of exoRNases are depicted with green arrowheads (see also Supplementary Fig. 1). Bottom panel: The identified 3′ rny_ends were paired to 3′-to-5′ exoRNase start positions (Supplementary Data 4 and Fig.2, top). The 3′-to-5′ exoRNase targeted the RNA fragments generated by RNase Y processing, but the exoRNase start position was nonetheless detectable in WT, indicating that a portion of the RNAs was not degraded. The 3′-to-5′ exoRNase start position corresponds to the initial RNase Y processing position (Supplementary Data 4).b Examples of RNAs identified by matching the 3′ rny_ends (purple arrowheads) with PNPase trimming start positions (green arrowheads) (see also Supplementary Fig. 3). For each RNA, the RNA 3′ end profile obtained from RNA sequencing in the WT, Δrny and ΔpnpA strains is shown and the scales are indicated between brackets. The RNA 3′ ends generated by RNase Y (blue scissors) and eventually targeted by PNPase (‘pacman’ symbol) corresponded to decay intermediates. For rofA mRNA, RNase Y was also responsible for the generation of the 5′ end of the decay intermediate. For Spy_sRNA482963, another endoRNase (grey scissors) produced the 5′ end of the decay intermediate, which was previously identified as an RNA 5′ end that was more abundant in the ΔpnpA strain than in the WT strain17.
5′ ends generated by RNase Y (Fig.
4
a, Supplementary Data 5). We
determined that 12% of the RNA 5′ ends were located in proximity
of PNPase trimming start positions, indicating that the generated
RNA fragment upstream of the processing site was degraded by
this exoRNase (Fig.
5
b; Supplementary Data 5). The observation
that a majority of the PNPase trimming start positions were located
up to 4 nt apart from the 5′ ends generated by RNase Y could be
explained again by the activity of YhaM. The remaining 88% of the
RNA 5′ ends were not associated with 3′-to-5′ exoRNase trimming
start positions (Fig.
5
b); therefore, the fate of the RNA fragment
upstream of RNase Y processing could not be determined with our
comparative analysis.
The identification of RNA 5′ and 3′ ends, the generation of which
was RNase Y dependent, coupled with the comparison of exoRNase
trimming start and stop positions, allowed us to provide an accurate
and precise annotation of the RNase Y targetome. Overall, PNPase
appears to be the major 3′-to-5′ exoRNase that degrades the RNA 3′
ends produced by RNase Y (Figs.
2
and
5
). Interestingly, the
PNPase-RNase Y double-deletion strain (ΔpnpAΔrny) grew slower
than both the
Δrny strain and the YhaM-RNase Y double-deletion
strain (ΔyhaMΔrny) (Supplementary Fig. 4), which indicates that
RNase Y and PNPase genetically interact and play an important
role in bacterial physiology.
RNase Y produces short RNA fragments. To identify fragments
with both ends produced by RNase Y (two cleavages in the same
RNA molecule) (Fig.
6
a), we calculated the distance between the
5′ rny_ends and the 3′ rny_ends (Fig.
6
b). We observed that, by
setting a maximum distance of 1000 nt, in a majority of the cases,
the 5′ rny_ends and the 3′ rny_ends were 50–200 nt apart
(Fig.
6
b, Supplementary Data 6). Examples of these fragments
were indeed detectable in the WT, but not in the
Δrny strain,
when examined by northern blot analyses (Fig.
6
c and
Supple-mentary Fig. 5). We further explored whether the 3′ rny_ends of
these putative fragments were targeted by 3′-to-5′ exoRNases and
noticed that 60% of them were trimmed by PNPase and/or YhaM
(Supplementary Data 6, exemplified in Fig.
6
d). The reason
why these fragments were detectable (not degraded in the WT
strain) remains unknown. We observed a decrease in the MFE at
the fragment 3′ ends, indicating the presence of a stable structure
(Supplementary Fig. 6a and b). Therefore, it is possible that the
fragments were highly resistant to degradation because they were
protected by this structure.
Among the RNA fragment 3′ ends generated by RNase Y, 23%
were trimmed by YhaM. In some cases, we observed that the
fragment present in the WT (Fig.
6
c and Supplementary Fig. 5c–e)
was not detected in the
ΔyhaM strain, by neither northern blot
analyses nor RNA sequencing (Supplementary Fig. 5c–e). We
therefore wondered whether, in the absence of YhaM, these
fragments were digested by PNPase or RNase R. However, in both
the
ΔpnpAΔyhaM and ΔrnrΔyhaM double-deletion strains, we did
not detect the fragments by northern blot analyses
(Supplemen-tary Fig. 5c–e). It is possible that YhaM exerts a protective role by
preventing further degradation of these fragments. Alternatively,
the redundancy between RNase R and PNPase or the involvement
1000 Total
RNase Y
PNPase and/or Yham
RNase Y Distance in nt between 5′ and 3 ′ rn y _ends 800 600 400 200 Fragment 0 3′ end 3′ 3′ nt 100 murC ORF SPy_1551 ORF SPy_0316 ORF 100 100 90 5′ end 5′ 5′ 3′ rny_end 3′ rny_end 5′ rny_end 5′ rny_end ΔrnyWT ΔrnyWT ΔrnyWT Δrny WT exoRNase start exoRNase stop
a
b
c
d
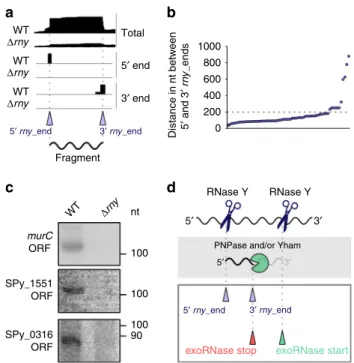
Fig. 6 Characterization of RNase Y-generated RNA fragments in the WT strain. a Representation of total, 5′ and 3′ end coverage profiles in the WT andΔrny strains obtained by RNA sequencing and corresponding to RNA fragments produced by RNase Y. The 5′ and 3′ rny_ends are indicated with purple arrowheads.b The positions of the 5′ and 3′ rny_ends were compared by setting minimum and maximum distances of 40 and 1000 nt, respectively, between the ends. Each dot represents paired 5′ and 3′ rny_ends (Supplementary Data 6).c Northern blot analyses of RNA fragments in the open reading frames (ORFs) of murC, SPy_1551 and SPy_0316, generated by RNase Y and detectable only in the WT strain. The full blots, the loading controls and the RNA sequencing profile for each fragment are shown in Supplementary Fig. 5c–e, and the source data are provided as a Source Datafile. Shown are the results of one representative northern blot analysis (n= 3). d Schematic representation of the generation of the short RNA fragments. RNase Y (blue scissors) is responsible for the production of both 5′ and 3′ fragment ends. The intermediate RNA fragment 3′ ends are, in 60% of the cases (Supplementary Data 6), subsequently trimmed by PNPase and/or YhaM (‘pacman’ symbol) from the start position (green arrowhead) until the stop position (red arrowhead).
Not paired to 3′-to-5′ exoRNase starts Paired to
PNPase trimming starts
200 T o tal n u mber 5′ rn y _end 175 150 125 100 88% 12% 75 50 25 0 5′ end 3′ end Δrny Δexornase Pairing Model WT RNA-seq 5′ rny_end exoRNase start
a
b
Fig. 5 PNPase completely degrades the RNase Y-generated RNAs located upstream of the processing site. a Example of 3′ and 5′ end coverage profiling by RNA sequencing. The RNA ends that were more abundant in the WT strain than in theΔrny strain (purple arrowhead) and the RNA ends corresponding to trimming start positions of exoRNases (green arrowhead) are indicated below the coverage. The 5′ rny_ends were paired to 3′-to-5′ exoRNase start positions that were located at least 10 nt upstream (Supplementary Data 5). Subsequently to RNase Y activity, the 3′-to-5′ exoRNases completely degraded the RNA fragments upstream of the RNase Y processing.b Portion of RNA 5′ ends (5′ rny_ends) paired with 3′-to-5′ exoRNase start positions. All the trimming starts associated with 5′ rny_ends were PNPase trimming start positions.
of another RNase could explain the absence of the fragment in the
ΔpnpAΔyhaM and ΔrnrΔyhaM strains.
RNase Y produces decay intermediates degraded by PNPase. As
recently shown in E. coli, PNPase is actively involved in the
degradation of small RNA fragments derived from transcripts
targeted by sRNAs
26. We previously observed that PNPase
rapidly degraded decay intermediates produced by endoRNases
in S. pyogenes
17. The 5′ ends of these decay intermediates were
identified as RNA ends that were more abundant in the ΔpnpA
strain than in the WT strain (185 5′ ΔpnpA_ends)
17(Fig.
7
a).
Here, we observed a conserved G located upstream of the decay
intermediate 5′ ends that was not observed at the decay
inter-mediate 3′ ends (Fig.
7
b)
17. Based on the RNase Y cleavage
sig-nature inferred from our analysis, we propose that the decay
intermediates harbouring a G at the 5′ end (127 decay
inter-mediates) were generated by RNase Y (Fig.
7
a and b). Indeed, the
decay intermediates, visualized by northern blot analyses, were
detected in the
ΔpnpA strain but not in the ΔpnpAΔrny strain,
indicating that RNase Y was involved in their production (Fig.
7
c
and Supplementary Fig. 6). The decay intermediate 3′ ends could
result from RNase Y processing—followed by exoRNase
trim-ming, explaining the lack of G conservation—or from processing
by another endoRNase (Fig.
7
a and Supplementary Fig. 6).
Role of RNase Y and PNPase in the 5
′ regulatory element
degradation. A portion of the decay intermediates degraded by
PNPase are derived from endoRNase processing of regulatory
RNA 5′ UTRs (e.g., T-boxes and riboswitches)
17. Here, we
observed that some of these decay intermediates were produced
by RNase Y (Fig.
8
and Supplementary Fig. 7). For example,
RNase Y processing generated decay intermediates from the serS
and thrS T-box RNA 5′ UTRs, providing access for PNPase to
digest these RNAs further up to the 5′ end (Fig.
8
a and
Supple-mentary Fig. 7). For all the regulatory elements analysed, the
decay intermediates accumulated in the
ΔpnpA strain and were
not present in the
ΔpnpAΔrny strain, demonstrating that RNase
Y is required for initiation of the decay of the premature
termi-nated transcripts derived from the T-box and riboswitches
(Fig.
8
b and Supplementary Fig. 7).
Regulation of operon expression by RNase Y and PNPase. We
examined the impact of RNase Y and PNPase on operon
expression by studying the rsmC-cdd-bmpA operon, described
below (Fig.
9
), and the tsf-rpsB operon (described in
Supple-mentary Fig. 8), which was strongly upregulated in
Δrny
(Sup-plementary Data 7).
2 5′ ends in ΔpnpA (5′ ΔpnpA_end) n = 185 5′ ΔpnpA_end 3′ ends in ΔpnpA (PNPase starts) n = 185 3′ 5′ Bits 1 0 2 Bits 1 0 –10 –5Distance to the processing site (nt) RNase Y endoRNase
PNPase
Distance to the processing site (nt)
Decay intermediates –1 +1 5 10 –10 –5 –1 +1 5 10 Δrny ΔpnpA Δrny ΔpnpA WT pyrH SPy_2197 nt 140 118 100 118 100 PNPase start rny_5′ end
a
b
c
Fig. 7 RNase Y produces decay intermediates degraded by PNPase. a Schematic representation of decay intermediates generated by RNase Y (blue scissors) and rapidly degraded by PNPase (‘pacman’ symbol). RNase Y produced the decay intermediate 5′ end, which was identified as an RNA 5′ end that was more abundant in theΔpnpA strain than in the WT strain. The decay intermediate 3′ end, corresponding to the PNPase trimming start position, was probably produced by an unidentified endoRNase (grey scissors). b Sequence conservation around the 5′ ends (5′ pnpA_ends) and 3′ ends (PNPase starts) of the decay intermediate from the 185 decay fragments previously identified, present in the ΔpnpA strain and not in the WT strain. c Northern blot analyses of decay intermediates (in pyrH and SPy_2197) in the WT,Δrny, ΔpnpA and ΔpnpAΔrny strains. The RNase Y-generated fragments degraded by PNPase (purple arrows) are indicated. Shown are the results of one representative northern blot analysis (n= 3). The full blots, loading controls, RNA sequencing-based RNA end profile with the detected 5′ and/or 3′ rny_ends, and trimming start positions are shown in Supplementary Fig. 6 and the source data are provided as a Source Datafile.
Δrny ΔpnpA Δrny ΔpnpA WT nt 150 FL FL FL serS Putative regulatory 5′ UTR
a
b
thrS 150 100 100 RNase Y PNPaseFull length transcript from the promoter to the terminator Decay intermediate decay produced by RNase Y FL
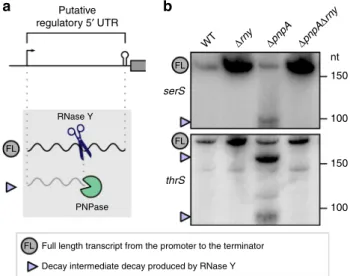
Fig. 8 RNase Y initiates the exoRNase-mediated degradation of putative regulatory 5′ UTRs. a Left, models of decay of putative regulatory elements. RNase Y (blue scissors) processes regulatory 5′ UTR elements, producing decay intermediates that are subsequently degraded by PNPase (‘pacman’ symbol) (see also Supplementary Fig. 7). b Northern blot analyses of putative T-boxes (serS and thrS) in the WT,Δrny, ΔpnpA and ΔpnpAΔrny strains. The full-length (FL) and RNase Y-generated decay intermediates (purple arrowheads) are indicated. Shown are the results of one representative northern blot analysis (n= 3). The full blots, the loading controls, the RNA end profile with the detected 5′ and/or 3′ rny_ends obtained by RNA sequencing, and the trimming start and stop positions are shown in Supplementary Fig. 7 and the source data are provided as a Source Datafile.
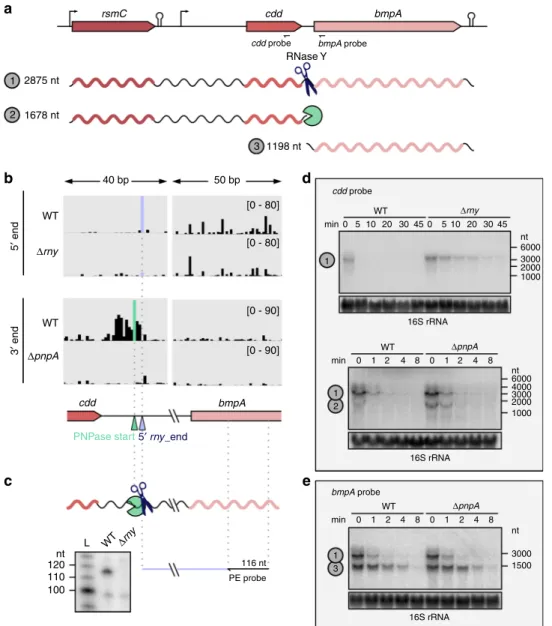
Based on the comparative analysis, we concluded that the
rsmC-cdd-bmpA operon was targeted by both RNase Y and PNPase
(Fig.
9
a). This operon encodes a 16 rRNA methyltransferase
(rsmC), a cytidine deaminase involved in pyrimidine metabolism
(cdd) and a lipoprotein (bmpA) (Fig.
9
a). RNase Y processed the
transcript between cdd and bmpA, and a PNPase trimming start
position was located a few nucleotides upstream of the 5′ rny_end
(Fig.
9
b). This observation indicates that the upstream fragment,
corresponding to the cdd and rsmC ORFs, is subjected to PNPase
degradation (Fig.
9
b, Supplementary Data 5).
To establish the impact of RNase Y and PNPase activity, we
assessed the stability of the different transcript isoforms of the
operon by northern blot analyses (Fig.
9
d). The stability of the
full-length rsmC-cdd-bmpA transcript (~2900 nt) was greatly
increased in the
Δrny strain (Fig.
9
d). The rsmC-cdd RNA
isoform (~1700 nt), which was barely detectable in the WT, was
stabilized in the
ΔpnpA strain (Fig.
9
d). This result suggests that
the rsmC-cdd isoform, arising from RNase Y processing, is
rapidly degraded by PNPase. The bmpA isoform appeared to be
more stable than the rsmC-cdd isoform in the WT strain, and the
stability of this RNA was not affected by PNPase (Fig.
9
e). In
summary, the sequential activity of RNase Y and PNPase in the
cdd-bmpA intergenic region ensures differential stability of the
rsmC-cdd and bmpA RNAs.
2875 nt
rsmC cdd
RNase Y
cdd probe bmpA probe bmpA cdd cdd probe bmpA probe bmpA 1 1 1 2 3 1678 nt 1198 nt 50 bp [0 - 80] WT min 1 1 2 nt 6000 45 30 20 10 5 0 45 30 20 10 5 0 3000 2000 1000 nt 6000 nt 3000 1500 3000 4000 2000 1000 16S rRNA 16S rRNA 16S rRNA [0 - 80] [0 - 90] [0 - 90] 40 bp Δrny Δrny WT min 0 1 2 4 8 0 1 2 4 8 min 0 1 2 4 8 0 1 2 4 8 ΔpnpA WT ΔpnpA WT Δrny WT L nt 120 PE probe 116 nt 110 100 ΔpnpA WT 5′ end 3′ end
PNPase start5′ rny_end
1 3
a
b
d
c
e
Fig. 9 The concerted action of RNase Y and PNPase is responsible for the differential RNA stability of the rsmC-cdd-bmpA operon. a Schematic representation of the rsmC-cdd-bmpA operon; the location of the promoter, terminator and probes used in the northern blot analyses and predicted RNA sizes are shown.b 5′ and 3′ end RNA sequencing coverages in the WT and Δrny strains (for the 5′ end) and in the WT and ΔpnpA strains (for the 3′ end) of a region comprising portions of the cdd and bmpA ORFs and the intergenic region between the two genes. The coverage scale is indicated between brackets. The 5′ rny_end and the PNPase trimming start position identified in the cdd-bmpA intergenic region are depicted with purple and green arrowheads, respectively.c RNA 5′ end in the cdd-bmpA intergenic region in the WT and Δrny strains, generated by RNase Y (scissors) and identified by primer extension analysis. The primer used is depicted with an arrow and binds upstream of the RNase Y processing and PNPase start positions (‘pacman’ symbol). The size of the expected cDNA product is indicated. Shown are the results of one representative primer extension experiment (n= 3). d, e The stability of rsmC-bmpA_cdd, cdd and bmpA RNAs was determined by northern blot analyses up to 45 or 8 min after the addition of rifampicin in the WT and Δrny strains or in the WT and ΔpnpA strains. Shown are the results of one representative northern blot analysis (n = 3). The 16 rRNA was used as a loading control. Source data are provided as a Source Datafile.
Discussion
We have investigated the targetome of RNase Y in the human
bacterial pathogen S. pyogenes, using a method based on
sequencing analysis of RNA 5′ and 3′ ends. We observed that the
identified RNA 5′ and 3′ ends harboured distinct features in
terms of sequence and structure conservation. Therefore, to
fur-ther explore the origin of the RNase Y-dependent RNA ends, we
developed an RNA-seq based comparative approach allowing us
to juxtapose those data with 3′-to-5′ exoRNase targetomes. This
method enabled us to determine that the detected RNA 5′ ends
generated by RNase Y were usually not further trimmed. The 3′
ends, depending on RNase Y, resulted mostly from PNPase
trimming and YhaM nibbling following RNase Y processing.
The analysis of the RNA 5′ ends generated by RNase Y revealed
the presence of a G located just upstream of the processing sites
for 87.4% of the targeted RNAs (Fig.
1
f). The preference of RNase
Y for this nucleotide at the processing site was
first described in S.
aureus, in which 58% of the processing sites were identified to be
located upstream of a G
10. A recent study from our laboratory
demonstrated that RNase Y also requires a G to process speB
mRNA, encoding a major virulence factor in S. pyogenes
11. In
light of the RNase Y cleavage signature identified in this study, it
is likely that the G is required for the processing of substrates
other than speB mRNA. Interestingly, in B. subtilis, a preferred
sequence for RNase Y cleavage was not reported. Instead, this
enzyme was shown to depend on the presence of RNA secondary
structures around the processing site, as exemplified by the
pro-cessing of several riboswitches
9, but this observation was never
validated genome wide
18. Similarly, S. aureus RNase Y processes
the saePQRS transcript only when a secondary structure is located
6 nt downstream of the cleavage site
12. In our study, the analysis
of the MFE did not reveal a secondary structure in proximity of
the 190 RNA 5′ ends (Fig.
1
f). However, we noticed at these
positions an increase in the MFE, which is consistent with the fact
that RNase Y cleaves in single-stranded regions.
Although we showed that RNase Y is involved in RNA decay,
we believe that, due to the limited number of direct targets
identified, RNase Y might not be the major initiator of mRNA
decay in S. pyogenes. We report 320 processing positions
(iden-tified by 5′ and 3′ end sequencing), which is consistent with
previous reports for the S. aureus and B. subtilis RNase Y
pro-teins, describing ~100 processing positions (identified by 5′ end
sequencing)
10,18. In S. aureus, the limited impact of RNase Y on
global transcript stability is consistent with the low number of
detected direct targets
10. In contrast, for RNase E, the major
endoRNase initiating RNA decay in Gram-negative bacteria,
~22,000 processing positions were identified in Salmonella
enterica
8. A possible explanation for the high number of RNase E
processing events detected in this bacterium is the absence of
RNase J1, which is found mainly in Gram-positive bacteria
2,27and performs degradation from the 5′ end of the RNAs. In the
present study, it is likely that we underestimated the number of
RNase Y processing sites. First, because the method used relies on
the detection of at least one RNA end (5′ or 3′), we did not
identify RNase Y processing events when both generated ends
were subsequently degraded by exoRNases (Fig.
10
a). Second, the
parameters used were stringent. However, the small RNase Y
targetome found here is consistent with the fact that RNase Y is
not essential under standard growth conditions (Supplementary
Fig. 4). Comparison of the RNase Y and 3′-to-5′ exoRNase
tar-getomes revealed 127 additional RNase Y processing sites that
could be identified only in the absence of PNPase (due to the
detection of decay intermediates), thereby increasing the total
number of RNase Y processing sites identified in this study to 447
(Fig.
7
and Supplementary Fig. 6). It is possible that additional
RNase Y processing positions were not detected in the
ΔpnpA
strain due to functional redundancy between PNPase and RNase
R
17. Previously, a global RNA stability study in S. pyogenes,
performed under conditions mimicking infection, revealed that
deletion of rny causes the stabilization of 98% of the transcripts
28.
It would be interesting to characterize the RNase Y targetome
under these conditions and to evaluate whether the increase in
transcript stability correlates with RNase Y activity. Overall, RNA
degradation in S. pyogenes must rely on another endoRNase(s) in
addition to RNase Y. For example, the RNase J1/J2 complex could
play an important role in RNA decay in S. pyogenes, as both
enzymes are essential in this bacterium
5.
5′ 5′ 5′ 5′ 3′ 3′ 3′ 3′ 5′ 3′
3′-to-5′ exoRNase 5′-to-3′ exoRNase J1
5′ 3′
5′ 3′
5′ 3′ 5′ 3′ Undetected transcripts Undetected transcripts
Undetected transcripts Undetected transcripts 52% 48% 130 Detected transcripts 190 Detected transcripts 87.4% 12.6% RNase Y
a
b
c
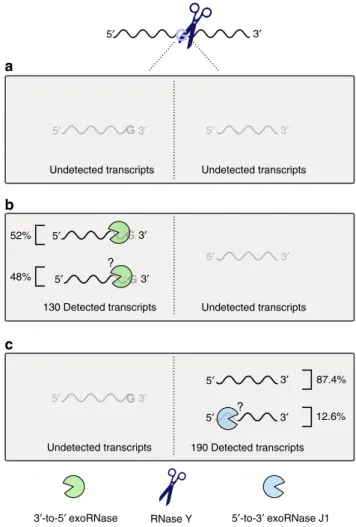
Fig. 10 Fate of the RNAs cleaved by RNase Y in S. pyogenes. RNase Y processing occurs preferentially after a G. The two processing products generated from the same molecule were never detected together. Subsequently to RNase Y activity, three different events are conceivable. a Both generated RNA fragments are degraded by exoRNases and/or endoRNases; hence, this activity would be undetectable in our experimental setting.b The RNA fragments upstream of the RNase Y processing position were detected (i.e., 3′ ends), but not the downstream products (i.e., 5′ ends). Among the 130 RNAs detected, we demonstrated that 52% of the RNA products were trimmed by 3′-to-5′ exoRNases (mainly PNPase and/ or YhaM). The remaining 48% were targeted either by several 3′-to-5′ exoRNases or by unidentified RNases. c The RNAs downstream of the RNase Y processing position were detected (i.e., 5′ ends), but not the upstream products (i.e., 3′ ends). Since 87.4% of the detected 5′ ends were mapped after G, we deduced that these RNAs were not further trimmed. The remaining 12.6% of the detected 5′ ends were not located after a G; therefore, we hypothesized that these ends were likely targeted by the 5 ′-to-3′ exoRNase J1.
We demonstrated that RNase Y acts principally in concert with
PNPase to degrade RNAs (Fig.
2
; Supplementary Data 2 and 4).
These two enzymes were shown to interact with each other in B.
subtilis, although this interaction was not required for the
degradation of all the studied targets
29. When PNPase targeted
the RNA fragments generated by RNase Y processing, we
detected more PNPase trimming stop positions than start
posi-tions (Fig.
2
). This result supports the observation that RNA 3′
ends produced by endoRNases are generally immediately
degra-ded by PNPase and do not accumulate in the WT strain
16,30. In
our analysis, we could not detect RNase Y products entirely
degraded by PNPase. Therefore, we suggest that the interplay
between these two enzymes likely plays a broader role in RNA
decay than that observed. By examining the PNPase targetome,
we observed that some decay intermediates produced by RNase Y
accumulated only in
ΔpnpA (Fig.
7
; Supplementary Fig. 6)
17.
Thus, the comparison of the
ΔpnpA strain in the presence or
absence of RNase Y led to the identification of additional RNase Y
processing positions and a more representative picture of the
interplay between these two enzymes.
Interestingly, we observed that the interplay of RNase Y and
PNPase performs different functions in bacteria, such as decay of
regulatory elements (e.g., riboswitches and T-boxes) and
matura-tion of polycistronic mRNA. A role of RNase Y in the turnover of
regulatory elements was previously observed in both B. subtilis and
S. aureus
9,10,31. Efficient removal of these regulatory elements from
the bacteria might be important for the recycling of the ligand. In
addition, RNase Y was previously shown to play an important role
in the maturation of polycistronic transcripts by uncoupling
the expression of genes encoded in the same operon
18,32. Here, we
show that the coordinated action of RNase Y processing in
inter-genic regions and subsequent degradation of one of the RNA
products by PNPase results in differential decay of genes encoded
within the same polycistronic mRNA, as exemplified for the
rsmC-cdd-bmpA operon (Fig.
9
).
As demonstrated previously, YhaM trims an average of 3 nt
from most of the RNA 3′ ends generated by transcriptional
ter-minators or by endoRNases
17. Therefore, it was expected that
YhaM would nibble the RNA 3′ ends produced by RNase Y. This
activity complicated the identification of the original processing
positions of RNase Y, as the G characterizing RNase Y activity
was removed from the RNA 3′ end by YhaM (Supplementary
Data 2 and 5). The example of SPy_0316 mRNA degradation
illustrates that YhaM also targets RNAs already trimmed by other
3′-to-5′ exoRNases (Fig.
3
d and Supplementary Fig. 2).
A previous study in B. subtilis suggested that YhaM could
shorten the single-stranded RNA tail necessary for the binding of
PNPase and RNase R to their targets, thereby protecting the
RNAs from degradation by these two enzymes
16. The observation
that the three RNA fragments analysed in this study
(Supple-mentary Fig. 5e) were not present in the
ΔyhaM strain suggests
that this hypothesis could also be valid, at least in a few cases, in S.
pyogenes.
The number of RNase R trimming positions detected in S.
pyogenes was limited during exponential growth in rich
med-ium
17; therefore, it was expected that the interplay between
RNase Y and RNase R would also be restricted under these
conditions. It is possible that RNase R and RNase Y might act in
concert in different conditions than the ones tested.
Here, we focused on the fate of the RNA 3′ ends generated by
RNase Y, and highlighted that these ends were in most cases
further trimmed by the 3′-to-5′ exoRNases (Fig.
10
b). In contrast
to the detected RNA 3′ ends, the fate of the corresponding
tran-script 5′ ends is unknown. RNase J1, which degrades the RNAs in
the 5′-to-3′ direction
6, might be a possible candidate enzyme for
the degradation of these RNAs. Alternatively, these undetected
RNAs could be degraded by the 3′-to-5′ exoRNases up to the 5′
end produced by RNase Y, as exemplified by PNPase trimming of
decay intermediates (Fig.
7
and Supplementary Fig. 6). In contrast
to what we observed for the detected 3′ ends, 87.4% of the RNA 5′
ends corresponded to the original RNase Y processing positions
(Fig.
10
c). The remaining 12.6% of the RNA 5′ ends produced by
RNase Y that were not located downstream of a G might
corre-spond to RNase J1 trimming stop positions or might be generated
by an endoRNase affected by RNase Y (Fig.
10
c). The conditions
leading to RNA 5′ end protection (detected 5′ ends) or
degrada-tion (undetected 5′ ends) have yet to be investigated. We believe
that our method might facilitate the investigation of the concerted
action of RNase Y and RNase J1, for instance, in Streptococcus
mutans, in which none of these enzymes are essential.
To conclude, we have developed an RNA-seq based
com-parative approach that allows the genome-wide characterization
of the specific RNase interplay and RNA degradation in vivo. We
anticipate that this methodology will enable to elucidate diverse,
parallel and interconnected, regulatory processes at the RNA
level.
Methods
Bacterial culture. S. pyogenes SF370 (M1GAS) and isogenic gene deletion strains (Supplementary Table 1) were grown in THY medium (Todd Hewitt Broth (THB, Bacto, Becton Dickinson) complemented with 0.2% yeast extract (Servabacter)) at 37 °C with 5% CO2without shaking19. TSA (trypticase soy agar, BD Difco)
sup-plemented with 3% sheep blood was used as a solid medium.
Growth curves. Bacterial cultures were grown overnight (37 °C, 5% CO2), diluted
to an OD620 nmof 0.02 in 5 ml of medium and centrifuged at 3200 × g for 5 min.
The resuspended pellet was used to inoculateflasks containing 25 ml of THY supplemented with 0.2% yeast extract. The growth was monitored by measuring the OD620 nmusing a microplate reader (Biotek PowerWave XS2). Growth curve
experiments were performed in triplicate and the standard error of the mean was calculated.
RNA isolation. The overnight S. pyogenes cultures were diluted 1:200 into 300 ml of fresh THY medium and grown to an OD620 nmof 0.25 corresponding to the
mid-logarithmic growth phase. For the RNA stability assays, 250 µg/ml of rifampicin (Sigma-Aldrich) was added when the bacteria reached the mid-logarithmic phase of growth, and samples were taken either after 0, 5, 10, 20, 30 and 45 min or after 0, 1, 2, 4 and 8 min. The cells were rapidly harvested by mixing the 25 ml of cultures with 25 ml of 1:1 ice-cold acetone/ethanol solution and by centrifugation (3500 × g for 10 min at 4 °C). The pellets were thoroughly resus-pended in 5 ml of TE buffer (50 mM Tris-HCl pH 8.0, 10 mM EDTA, pH 8, 50 mM NaCl, 25% sucrose). The cells were lysed by adding 100 µl of lysis buffer (20 mM Tris-HCl pH 8.0, 50 mM EDTA pH 8.0, 20% sucrose) supplemented with 2.5 mg/ml of lysozyme and 0.5 µg/µl of mutanolysin and incubated for 5 min on ice. The samples were mixed with the lysis executioner buffer (2% sodium dodecyl sulfate (SDS), 1 mg/ml Proteinase K) incubated at 95 °C for 1.5 min. Seven hun-dred andfifty microlitres of TRIzol reagent (Life Technologies) were added to the samples, which were subsequently inverted three times. After incubation for 5 min at room temperature, 200 µl of chloroform were added and the samples were mixed by vortexing. The samples were then incubated at room temperature for 10 min prior centrifugation at 11,300 × g for 10 min at 4 °C. The upper aqueous phase (~700 µl) was gently collected and the RNAs were precipitated with ice-cold 100% isopropanol at a 1:1 ratio at−20 °C for at least 1 h. After centrifugation at 11,300 × g for 10 min at 4 °C, the RNA pellets were washed with 1 ml of 70% ethanol, air dried for 10 min and dissolved in autoclaved Milli-Q H2O. RNA
integrity was assessed on 1% agarose gels.
RNA sequencing and analysis. The RNA sequencing was performed in biological triplicates using the workflow previously published by our laboratory17. After
treatment with TURBO DNase (Ambion), the RNA quality was assessed using a bioanalyzer system (Agilent 2100). Subsequently, 4.5 µg of RNA was depleted of rRNAs (Ribo-Zero rRNA Removal Kit (Bacteria)) and treated with 10 U of RppH (New England Biolabs) at 37 °C for 1 h 30 min to convert the 5′ triphosphate RNAs in 5′ monophosphate RNAs. The RNAs were purified using standard extraction with phenol:chloroform:isoamylalcohol (25:24:1, Roth) and precipitated using ice-cold ethanol. The obtained RNAs were treated with T4 polynucleotide kinase (Thermo Scientific) according to the manufacturer’s instructions to allow the subsequent ligation of the sequencing adaptors. After a purification step using the RNA Clean & Concentrator kit (Zymo Research), the RNAs were fragmented (Covaris M220) in a microTUBE AFA Fiber Pre-Slit Snap-Cap tubes for 140 s.
cDNA libraries were prepared using the NEXTflex® Small RNA Sequencing Kit v3 (Bioo Scientific) according to the manufacturer’s instructions until step G. The purification step was performed using Agencourt AMPure XP beads (Beckman Coulter). The cDNA libraries were sequenced on a HiSeq3000 (paired-end mode, 75 bp) at the Max Planck-Genome-centre Cologne. The data were deposited in the National Center for Biotechnology Information (NCBI) sequence read archive (SRP149896). The numbers of sequencing reads obtained are listed in Supple-mentary Table 2. After qualityfilter (FastQC, v0.11.5) and adapter removal (Cutadapt v1.11), the reads were mapped to the S. pyogenes reference genome (NC_002737.2) and the total and end-specific (5ʹ and 3ʹ) coverage profiles were visualized using the Integrative Genomics Viewer (IGV)33,34. Differentially
expressed (DE) genes were identified using featureCounts (v1.5.2)35and edgeR
(v3.20.6)36,37with absolute log2-fold change (log2 FC)≥ 1 and false discovery rate
(FDR) < 0.05.
RNase Y processing sites. RNase cleavage positions were identified following the previously published procedure17. In brief, the genome coverage data was
pre-filtered with a count per million (cpm) value ≥0.05 and only the RNA ends dis-playing a cpm≥5 were further analysed. We carried out differential expression analysis of normalized 5′ and 3′ read ends by comparing the following datasets (triplicates): WT vs.Δrny and Δrny vs. Δrny::rny. RNase Y ends were identified using edgeR (v3.20.6)36,37with absolute log2 FC≥ 1 and FDR < 0.05, and kept only
if present in both comparisons. These identified RNA ends were named 5′ or 3′ rny_ends (Supplementary Data 1). These results were furtherfiltered with addi-tional parameters (i.e., the“proportion of ends” and the “ratio of WT and Δrny proportion of ends”) that were previously described17. First, the“proportion of end
parameter”, proportions of RNA ends at one position over the total RNA abun-dance, from the WT strain was set as≥2%. Second, the “ratio of WT and Δrny proportion of ends”, the WT proportion of ends over the Δrny proportion of end, was set as≥3%. This parameter allowed that the identification of RNA ends depending of an RNase Y processing event was independent from the RNA abundance in the WT andΔrny strains.
Comparison of the RNase Y and 3′-to-5′ exoRNase targetomes. The RNase Y targetome (i.e., 5′ and 3′ rny_ends) was compared to the PNPase, YhaM and RNase R targetomes (i.e., 3′-to-5′ exoRNase trimming start and stop positions), which were previously identified (SRP149886)17(see Supplementary Fig. 1). Different
approaches were used to perform the comparison. When at least two consecutive positions were identified as 3′ rny_ends in a window of 5 nt, the position with the highest ratio of proportion of ends between the WT strain and theΔrny strain was selected for further analysis17. First, the 3′ rny_ends were compared with the
PNPase, YhaM and RNase R trimming stop positions that were located 5 nt upstream or 5 nt downstream of the 3′ rny_ends (+/−5 nt shift) (Supplementary Data 2). Second, the 3′ rny_ends corresponding to 3′-to-5′ exoRNase trimming stop positions (in Supplementary Data 2) were compared with the trimming start positions located downstream (Supplementary Data 3). The maximum distance between these trimming stop and start positions was set at 200 nt for PNPase and RNase R, and 10 nt for YhaM. For RNase R, by setting a maximum distance of 200 nt, we did not identify any trimming start position downstream of the 3′ rny_ends that matched the RNase R stop positions. Third, the 3′ rny_ends were compared to the PNPase, YhaM and RNase R trimming start positions, allowing a +/−5 nt shift (Supplementary Data 4). Finally, the 5′ rny_ends were paired to the PNPase, YhaM and RNase R trimming start positions located 10 nt upstream (Supplementary Data 5). In addition, the 3′ rny_ends and 5′ rny_ends were compared by setting minimum and maximum distances of 40 and 1000 nt, respectively, between the ends (Supplementary Data 6). This comparison allowed the identification of RNA fragments produced by RNase Y. Python (v3.6.3) was used to perform all the comparisons described.
Sequence logo and folding. RNAfold (v2.4.3)38was used to calculate the MFE
(ΔG in kcal/mol) using a sliding window of 50 nt sequences, with 100 or 200 nt centred on the position of interest. The average MFE at each nucleotide was then calculated. WebLogolib (v3.5.0) was used to generate the sequence logos39, with
sequences of 20 nt centred on the processing site with a GC content of 38.5%. The plots were generated using Python (v3.6.3) and matplotlib (v2.1.0).
Northern blotting assays. For the short RNAs, 10 µg of RNA was separated on 8% or 10% polyacrylamide/8 M urea gels (Figs.5,6and7; Supplementary Figs. 5, 6, and 7) in 1X TBE. The RNAs were transferred onto nylon membranes (HybondTM N+, GE Healthcare) with the Biorad Trans-Blot Cell system during 1 h and 15 min at 50 V in 1X TBE. RNAs were UV-crosslinked to the membranes with a Stratagene Stratalinker 1800 (two times in“Autocrosslink” mode). The oligonucleotide probes (40 pmol), listed in Supplementary Table 1 were32P labelled using T4
Poly-nucleotide Kinase (T4 PNK Fermentas) in presence of 2 µl of T4 PNK buffer (10×) and 2 µl of gamma-32P ATP (0.75 MBq, Hartmann analytic)40. The labelled
oli-gonucleotides probes were subsequently purified over G-25 columns (GE Health-care) following the manufacturer’s instructions. The membranes were
prehybridized in the Rapid-hyb buffer (GE Healthcare) for 1 h at 42 °C. The oli-gonucleotides were denatured and added to the membranes for an overnight
hybridization at 42 °C. The membranes were washedfirst with 5X SSC-0.1% SDS buffer and then with 1X SSC-0.1% SDS buffer for 15 min at 42 °C, respectively. RNA sizes were estimated using the RNA DecadeTM Marker (Ambion) or the ΦX174 DNA/HinfI Marker (Fermentas).
For the long RNAs (Fig.8), 20 µg of RNA was separated on a 1% agarose gel (1X MOPS (20 mM MOPS free acid, 5 mM sodium acetate, 1 mM EDTA, pH 7.0), 6.6% formaldehyde) in 1X MOPS buffer with 0.7% formaldehyde for 2 h at 80 V. The separated RNAs were transferred onto a Nylon Hybond N+ membrane (GE Healthcare) using a capillarity system overnight at room temperature in 20X SSC11.
The RNAs were crosslinked to the membranes using UV (2X autocrosslinking, UV Stratalinker 1800). The membranes were pre-hybridized in Rapid-hyb buffer for 1 h (GE Healthcare) and subsequently incubated with denatured probes, which were32P labelled as described above. The hybridization was conducted overnight at
50 °C. The membranes were rinsed twice with pre-warmed 1X SSC+ 0.1% SDS and subsequently with pre-warmed 0.5X SSC+ 0.1% SDS. All washes were performed for 20 min at 50 °C. Long RNA sizes were estimated using the RiboRuler High Range Ladder (Thermo Scientific). A Typhoon Fla 9500 phosphorimager (Fujifilm) was used to visualize the radioactive signal for all northern blotting assays. As a loading control, 5S or 16S rRNAs were probed on the same membranes. Each northern blot was performed in at least triplicate. The uncropped blots are supplied in the Source Datafile.
Primer extension. Primer extension was conducted on 10 µg of total RNA in biological triplicates19. RNAs were annealed to the radiolabelled primer
(Supple-mentary Table 1) for 30 min at 65 °C and subsequently incubated on ice for 1 min and the RNAs were reverse transcribed using 1U of SuperScript III Reverse Transcriptase (Invitrogen) in the presence of 1Xfirst strand buffer (Invitrogen), 5 mM dithiothreitol (DTT) and 40 U of RNaseOUT Recombinant Ribonuclease Inhibitor (Invitrogen), for 1 h at 55 °C. After inhibition of the SuperScript III enzyme by incubation at 70 °C for 15 min, the cDNAs were precipitated with ice-cold 100% ethanol at–20 °C for 1 h and centrifuged at 20,000 × g for 4 °C for 10 min. The pellet was washed with ice-cold 70% ethanol at 20,000 × g for 4 °C for 10 min and resuspended in 5 µl of 2X RNA loading dye. The cDNA products were resolved on 10% polyacrylamide/8 M urea/TBE gels and the size of the products was estimated using the AFLP 30–300 bp ladder labelled according to the manu-facturer’s instructions.
Reporting summary. Further information on research design is available in the Nature Research Reporting Summary linked to this article.
Data availability
RNA sequencing data have been deposited at the NCBI under the accession number
SRP149896. The data generated and analysed in this study are available from the corresponding authors upon request. All datasets generated in this study are available within the paper. The source data underlying Figs.6c,7c,8b,9c–e, and Supplementary Figs. 4, 5c–e, 6, 7, and 8b–e are provided as Source Data files; the source data underlying Figs. 7b and 3f are published (https://doi.org/10.1073/pnas.1809663115) and are available at NCBI under the accession numberSRP149887.
Received: 13 August 2019; Accepted: 29 February 2020;
References
1. Carpousis, A. J., Luisi, B. F. & McDowall, K. J. Endonucleolytic initiation of mRNA decay in Escherichia coli. Prog. Mol. Biol. Transl. Sci. 85, 91–135 (2009). 2. Durand, S. & Condon, C. RNases and helicases in Gram-positive bacteria.
Microbiol. Spectr. 6, 37–53 (2018).
3. Mohanty, B. K. & Kushner, S. R. Regulation of mRNA decay in bacteria. Annu. Rev. Microbiol. 70, 25–44 (2016).
4. Mäder, U., Zig, L., Kretschmer, J., Homuth, G. & Putzer, H. mRNA processing by RNases J1 and J2 affects Bacillus subtilis gene expression on a global scale. Mol. Microbiol. 70, 183–196 (2008).
5. Bugrysheva, J. V. & Scott, J. R. The ribonucleases J1 and J2 are essential for growth and have independent roles in mRNA decay in Streptococcus pyogenes. Mol. Microbiol. 75, 731–743 (2010).
6. Mathy, N. et al. 5’-to-3’ exoribonuclease activity in bacteria: role of RNase J1 in rRNA maturation and 5’ stability of mRNA. Cell 129, 681–692 (2007). 7. Deutscher, M. P. Twenty years of bacterial RNases and RNA processing: how
we’ve matured. RNA 21, 597–600 (2015).
8. Chao, Y. et al. In vivo cleavage map illuminates the central role of RNase E in coding and non-coding RNA pathways. Mol. Cell 65, 39–51 (2017). 9. Shahbabian, K., Jamalli, A., Zig, L. & Putzer, H. RNase Y, a novel
endoribonuclease, initiates riboswitch turnover in Bacillus subtilis. EMBO J. 28, 3523–3533 (2009).