Supplemental Material 1
Low-energy interband transitions in the infrared
response of Ba(Fe
1-xCo
x)
2As
2Supplemental Material
In the following we describe how the spectra of the optical conductivity have been modeled to obtain the temperature and doping dependence of the spectral weight of the band at 1000 cm-1 that is described in the manuscript.
First we reproduced the spectrum obtain at 300 K. Subsequently, we modeled for temperatures below 300 K the difference spectra with respect to the spectrum at 300 K. We found that this this provides the most reliable and consistent way to determine the temperature and doping-dependence of the spectral weight of the 1000 cm-1 band since it helps to reduce the influence of any artifacts in the spectra
that are independent of temperature. Also for this modeling we focused on the mid-infrared ellipsometry spectra for which the precision and reproducibility was highest allowing us to observe even relatively small features.
For the description of the room temperature spectra we used a three-component model that consists of a narrow Drude term to account for the free carrier response and two broad Lorentz-terms to describe the bands at finite frequency in the mid-infrared and the near-mid-infrared, respectively. Similar models have been previously successfully used to account for the pronounced high energy tail of the Drude-like response in the mid-infrared range and the upturn of the conductivity towards a strong interband transition that is centered at 5400 cm-1. This model can also
reproduce the main temperature dependent changes of the spectra in the normal state above the magnetic and superconducting transition temperatures, respectively, like the decrease of the conductivity in the mid-infrared range, the narrowing of the Drude response and the redistribution of of spectral weight from the mid-infrared range to energies well above the 5400 cm-1 band.
For each sample, the conductivity spectrum at 300 K was first fitted with the 3-component model. Subsequently, for the temperature below 300K we fitted the difference spectra with respect to 300 K. For this we used a function that contains the same three terms as the 300 K model plus additional terms for the 1000 cm-1
and 2300 cm-1 bands from which the modeled 300 K spectrum was subtracted.
The 1000 cm-1 and 2300 cm-1 bands are added to the model as Gaussian terms,
as they a) suffice for the phenomenological description of the data, b) are more localized than Lorentz terms and c) their spectral weight can be directly calculated from the fit parameters (magnitude, position and width).
Supplemental Material 2
Figure S 1. Room temperature data and model (left) and low-temperature differential spectra and models (right) of Ba(Fe0.98Co0.02)2As2.
Figure S1 shows the optical conductivity of the Ba(Fe0.98Co0.02)2As2 sample. In the
left panel, the room temperature conductivity spectrum (symbols) is presented together with the 3-term model for which the three terms are shown with separate lines. On the right hand panel, the difference spectra with respect to 300 K are shown for two representative temperatures above the magnetic transition temperature of TN=106 K. Solid lines show the differential models, the dashed lines show the model for the background without the Gaussian bands.
The left hand panel of fig. S2 shows the modeling of the 300 K spectrum for the Ba(Fe0.95Co0.05)2As2 sample. The right hand panel shows the difference spectra and
the models for two temperatures above 300 K and four lower temperatures (above
Supplemental Material 3
Figure S 2. Room temperature conductivity spectrum and model (left) and temperature dependent difference spectra and models (right) of Ba(Fe0.95Co0.05)2As2.
The figure S3 presents the data for overdoped Ba(Fe0.9Co0.1)2As2 sample with
several difference conductivity spectra above the superconducting transition at
TC=15 K.
Figure S 3. Room temperature conductivity spectrum and model (left) and temperature dependent difference spectra and models (right) of overdoped Ba(Fe0.9Co0.1)2As2.
Supplemental Material 4
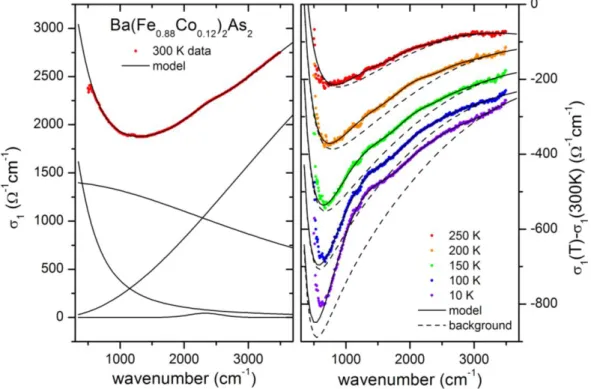
The left hand panel of figure S4 displays the room temperature spectrum of strongly overdoped Ba(Fe0.88Co0.12)2As2. In this case, a 4-term model was used to
describe the 300 K conductivity spectrum. An additional term was required here since the 2300 cm-1 band becomes apparent already at 300 K. It can be seen on
the right hand panel that both the 1000 cm-1 and 2300 cm-1 bands grow with
decreasing temperatures.
Figure S 4. Room temperature conductivity spectrum and model (left) and temperature dependent differential spectra and models (right) of Ba(Fe0.88Co0.12)2As2.
In conclusion, we have shown that the doping and temperature dependence of the conductivity spectra of Ba(Fe1-xCox)2As2 single crystals can be phenomenologically
described with a relatively simple model that contains Drude, Lorentz and Gauss terms. However, we cannot argue that such a parameterization is unique or actually reflects relevant processes. The purpose of the modelling was to obtain reasonable estimates of the spectral weight of the observed bands for relative comparison across the phase diagram, as presented in the manuscript.
The accuracy of the quantitative estimates is mostly limited by the following uncertainties. Firstly, the peak of the 1000 cm-1 band nearly coincides with the
minimum of the modeled background conductivity the shape of which could be slightly different. Secondly, the low energy tail of the absorption band is difficult to distinguish from the strong Drude response. The shape of the low-energy part of the interband transition with a maximum near 1000 cm-1 is therefore not very


