HAL Id: hal-02182974
https://hal.univ-lorraine.fr/hal-02182974
Submitted on 8 Aug 2019
HAL is a multi-disciplinary open access
archive for the deposit and dissemination of
sci-entific research documents, whether they are
pub-lished or not. The documents may come from
teaching and research institutions in France or
abroad, or from public or private research centers.
L’archive ouverte pluridisciplinaire HAL, est
destinée au dépôt et à la diffusion de documents
scientifiques de niveau recherche, publiés ou non,
émanant des établissements d’enseignement et de
recherche français ou étrangers, des laboratoires
publics ou privés.
Distributed under a Creative Commons Attribution - NonCommercial| 4.0 International
Characterization of palladium species after γ-irradiation
of a TBP–alkane–Pd(NO 3 ) 2 system
Bénédicte Simon, Christine Bouyer, Stéphanie de Sio, Claude Berthon,
Nathalie Boubals, Frédéric Miserque, Emmanuelle Brackx, Nicole Raymond,
Alexandre Chagnes, Laurence Berthon
To cite this version:
Bénédicte Simon, Christine Bouyer, Stéphanie de Sio, Claude Berthon, Nathalie Boubals, et al..
Characterization of palladium species after γ-irradiation of a TBP–alkane–Pd(NO 3 ) 2 system. RSC
Advances, Royal Society of Chemistry, 2018, 8 (38), pp.21513-21527. �10.1039/C8RA02695E�.
�hal-02182974�
Characterization of palladium species after
g-irradiation of a TBP–alkane–Pd(NO
3
)
2
system†
B´en´edicte Simon, aChristine Bouyer,*a
St´ephanie De Sio,bClaude Berthon,a
Nathalie Boubals,a
Fr´ed´eric Miserque,cEmmanuelle Brackx,aNicole Raymond,a
Alexandre Chagnes dand Laurence Berthon a
The g-irradiation of a biphasic system composed of tri-n-butylphosphate in tetrapropylene hydrogen (TPH) in contact with palladium(II) nitrate in nitric acid aqueous solution led to the formation of two precipitates. A thorough characterization of these solids was performed by means of various analytical techniques including X-Ray Diffraction (XRD), Thermal Gravimetric Analysis coupled with a Differential Scanning Calorimeter (TGA-DSC), X-ray Photoelectron Spectroscopy (XPS), InfraRed (IR), RAMAN and Nuclear Magnetic Resonance (NMR) Spectroscopy, and ElectroSpray Ionization Mass Spectrometry (ESI-MS). Investigations showed that the two precipitates exhibit quite similar structures. They are composed at least of two compounds: palladium cyanide and palladium species containing ammonium, phosphorous or carbonyl groups. Several mechanisms are proposed to explain the formation of Pd(CN)2.
Introduction
In the PUREX process, 30%vol tri-n-butylphosphate (TBP) diluted in Tetra Propylene Hydrogen (TPH, a hydrocarbon diluent) is used to extract uranium and plutonium from ssion products (ruthenium, molybdenum, cesium, palladium, etc.) and minor actinides contained in spent nuclear fuels.1,2Due to
the biphasic nature of the chemical system and the presence of numerous solutes (nitric acid, uranium, plutonium, ssion products.), the solvent is subject to hydrolytic and radiolytic degradation. The resulting damage can modify the solution composition, alter the physico-chemical properties, modify the extraction kinetics, and modify the redox properties of the metallic ions to be extracted.3Since the 1950s, many studies
have been focused on the investigation of the stability of TBP and diluent under radioactive stress.3,4In particular, the
inu-ence of the irradiation source (a-irradiation vs. g-irradiation5–12),
diluent,5,13–16 nitric acid concentration,17–22and temperature14
have been studied. It appears that irradiation of TBP in alkane diluents in contact with aqueous nitric acid solution produces dibutyl phosphoric acid (HDBP), monobutylphosphoric acid (H2MBP), phosphoric acid (H3PO4), higher molecular weight
dimers, acidic phosphates, hydroxylated and nitro-substituted phosphates, and low-molecular weight acid phosphates.23–28
Among these products, HDBP, H2MBP, H3PO4 and low-molecular weight acid phosphate species are generated by decomposition of the TBP radical cation produced by irradia-tion stresses or by hydrogen atom abstracirradia-tion of TBP or the primary radiolysis products. Likewise, diluent decomposition leads to the formation of nitro-substituted alkanes in presence of nitrates and alkane oxidation products such as ketones and carboxylic acids while high-molecular weight products are formed by radical-addition reactions. Without treatment, accumulation of degradation products in the solvent could lead to (i) change of the physicochemical properties of the solutions (density and viscosity),29 (ii) crud formation,30–35 and (iii)
changes in the extraction properties of the solvent (efficiency, selectivity, etc.).15,19,30,31,36–40
In the literature, a particular interest has been focused on the complexing properties of the degradation products towards U(VI),9,39,41,42Pu(IV),6,9,42–46 Zr(IV),30,32,35,45,47–55Ln(III),56,57 Fe(III)58,59 as well as Ru.37Few studies have reported the effect of
irradia-tion on the palladium behaviour.12,19,36,40,58–60Guedon et al.58,59
reported the formation of a precipitate containing palladium58
under accelerated degradation conditions (higher than 0.2 MGy) of 30%vol TBP diluted in n-dodecane in contact with 3 mol L!1nitric acid. They mentioned that formation of palla-dium precipitate could be related to diluent degradation. Moreover, Nowak et al.19showed that solvent degradation is
more intense in the presence of palladium(II) during irradiation of 30%volTBP diluted in n-dodecane in contact with nitric acid. In this case, palladium might be involved in the degradation mechanisms of the extraction solvent. Furthermore,
aCEA Marcoule, Nuclear Energy Division, Research Department on Mining and Fuel
Recycling Processes (DMRC), BP17171, 30207 Bagnols-sur-C`eze Cedex, France. E-mail: christine.bouyer@cea.fr
bORANO Cycle, 1 Place Jean Millier, 92084 Paris La D´efense, France
cDEN, Service de Corrosion et d’´etude du Comportement des Mat´eriaux dans leur
Environnement (SCCME), CEA, Universit´e Paris-Saclay, 91191, Gif-sur-Yvette, France
dUniversit´e de Lorraine, CNRS, GeoRessources, F-54000 Nancy, France
†Electronic supplementary information (ESI) available. See DOI: 10.1039/c8ra02695e
Cite this: RSC Adv., 2018, 8, 21513
Received 28th March 2018 Accepted 1st June 2018 DOI: 10.1039/c8ra02695e rsc.li/rsc-advances
RSC Advances
PAPER
degradation is accompanied by an increase of the distribution ratio of Pd(II) (DPd).40In order to explain this behaviour, the effect of some degradation products on the distribution ratio of Pd(II) were investigated.40,60The presence of alkenes and butyric aldehyde could be responsible for the increase of DPd. Conversely, no signicant increase in the distribution ratio of palladium(II) was observed when HDBP, H2MBP, methyl-ethyl ketone, 2-butanol, or iodoethane were added to the extraction solvent. Beside the increase of the distribution ratio of palla-dium(II), the formation of a black precipitate was also observed. According to the authors, such a precipitate could result from the reduction of Pd(II) into Pd(0) during the oxidation of alkenes into carbonyl compounds.61
In the ORANO La Hague reprocessing plants, aer two or three decades of industrial operations, it is essential to learn how to cope with aging equipment in order to avoid process dysfunctions. In particular, precipitates containing a high proportion of palladium (>50%w) and carbon (>25%w) were found to be responsible for partial equipment clogging.62
Because of the high radioactivity of these solids, a thorough characterization is difficult to conduct. Therefore, in order to investigate the phenomena responsible for precipitate forma-tion in the presence of Pd(II) in nuclear fuel reprocessing plants, inactive precipitates were synthetized in the laboratory by con-tacting 30%volTBP diluted in TPH with palladium(II) nitrate in 3 mol L!1nitric acid solution under g-irradiation with a60Co source. X-Ray Diffraction (XRD) diagrams and InfraRed (IR) spectra of these inactive precipitates have demonstrated simi-larities between these precipitates and the solids observed in the ORANO plant.62These solids have been thoroughly
charac-terized in this work by X-Ray Diffraction (XRD), Thermal Gravimetric Analysis coupled with a Differential Scanning Calorimeter (TGA-DSC), X-ray Photoelectron Spectroscopy (XPS), InfraRed (IR), RAMAN and Nuclear Magnetic Resonance (NMR) spectroscopy as well as ElectroSpray Ionization Mass Spectrometry (ESI-MS). Finally, mechanisms responsible for precipitate formation have been discussed.
Results
A biphasic system composed of 30%volTBP diluted in TPH in contact with nitric acid solution containing palladium(II) nitrate was irradiated under accelerated degradation conditions of the PUREX process. Such conditions lead to the formation of two solids as illustrated in Fig. 1.
A thorough characterization of the two precipitates FS,1and FS,2 was undertaken using complementary analytical tech-niques such as XRD, TGA, XPS and IR spectroscopy. Additional information has been deduced by dissolving the precipitates in appropriate solvents and by analysing them by NMR, IR and RAMAN spectroscopy as well as ESI-MS spectrometry.
Direct analysis of the precipitates
Samples were analysed by X-Ray Diffraction (XRD) to gain information about their structure. Fig. 2 shows XRD patterns of precipitate FS,1, located at the liquid–liquid interface (green
line) and the precipitate FS,2 located at the bottom of the aqueous phase (blue line).
Both precipitates have the same crystallographic structure as they exhibit four peaks located at 2q ¼ 18.1#, 26.5#, 36.2#, 40.8# as well as 18.1#, 26.2#, 36.1# and 41.2#, respectively. A compar-ison of XRD patterns with the literature data indicates that the crystallographic structure of these precipitates is close to that of Pd(CN)2$0.29H2O.63 Usually in an X-ray powder diffraction pattern, peak intensity and resolution (full-width half maximum) are related to the crystallinity state of the materials (crystallite size and micro-deformation of the crystal lattice). In Fig. 2, the width full-width half maximum of FS,1and FS,2are different: a ner and a higher intensity is observed for FS,2 because the precipitate FS,2is probably better crystallized than the precipitate FS,1.
The lattice structure of FS,1and FS,2is I41/amd and the lattice parameters are a ¼ b ¼ 4.949(29) ˚A and c ¼ 8.486(68) ˚A (RBragg¼ 3.18, Rwp ¼ 0.383) as well as a ¼ b ¼ 4.949(29) ˚A and c ¼ 8.788(85) ˚A (RBragg¼ 3.35, Rwp¼ 0.336), respectively. The lattice parameters a, b and c are the same for both precipitates, but they are smaller than for the commercial compound Pd(CN)2 -$0.29H2O (a ¼ b ¼ 5.119 ˚A and c ¼ 13.600 ˚A). Pd(CN)2$0.29H2O and Pd(CN)2$0.29NH3 contain water and NH3 molecules to terminate the periodic structure of the solid, respectively (see Fig. 3 for the sake of illustration in the case of Pd(CN)2 -$0.29H2O).63 The differences observed between the lattice
Fig. 1 Formation of two precipitates (FS,1and FS,2) after g-irradiation at 500 kGy with60Co source of the biphasic system. Initial composi-tion of the organic phase: 30%volTBP diluted in TPH; initial compo-sition of the aqueous phase: 0.02 mol L!1 palladium(II) nitrate in 3 mol L!1nitric acid; organic : aqueous phase ratio ¼ 1 : 1.
parameter c for FS,1, FS,2 and Pd(CN)2$0.29H2O may be explained by difference in crystal network. For instance, it can be expected that water molecules located at the outer edges in the Pd(CN)2network may be replaced by carboxylates groups in FS,1and FS,2. Furthermore, the difference in lattice parameters may be explained by the presence of at least two compounds in the precipitate since inclusions of a second compound (in minor quantity) could modify the lattice parameter c.
In order to determine the surface elemental composition of the precipitate, X-ray photoelectron spectroscopy (XPS) was used. This technique provides information about surface composition of solids, their chemical environments and their oxidation states. The Pd-3d, C-1s and N-1s XPS spectra of FS,1 and FS,2 were recorded and compared with spectra of
commercial compounds such as palladium acetate, palladium acetylacetonate, palladium pivalate and palladium cyanide. Atoms of Pd, C, O, N and P are present in both precipitates. Fig. 4 shows the Pd-3d core level spectra of the precipitates. It appears that the elemental composition and the nature of the chemical functions in FS,1and FS,2are similar. Table 1 depicts the binding energies of Pd-3d5/2, N-1s and C-1s contributions for both precipitates and the reference samples.
Two different palladium species may be present in the precipitates since XPS spectra exhibit two contributions for Pd-3d5/2. The comparison between reference samples and precipi-tates indicates the presence of Pd(II) bonded to –C^N and O] C–O– groups. The presence of these two functions is conrmed by the C-1s core level spectra (Fig. S1, in ESI†): two contributions are observed at 286.3 eV for C^N group and 289.0 eV for O]C–O group, respectively. In addition, NR4+ compound is likely present in the precipitates (R ¼ hydrocarbon chain). Indeed, the presence of a peak located at a binding energy of 401.9 eV in the N-1s XPS data is consistent with the presence of ammonium type compound in the precipitates.64These results
conrm the presence of cyanide groups in close interaction with palladium but also show the presence of other interactions between palladium and carboxylate and/or ammonium groups. The calculation of the Pd/N atomic ratios by considering Pd and N bounded to cyano functions demonstrates that CN groups coordinate only palladium in FS,1and FS,2, since Pd/N ratio are the same for the precipitates and commercial Pd(CN)2 (Table 2). Finally, by assuming that Pd is only surrounding by two different environments (Pd–CN and Pd–O– C]O), the proportion of Pd in Pd-cyano and Pd–O]C–O can be calculated for FS,1and FS,2(Table 3). The composition of the two precipitates is slightly different, i.e. FS,1contains less Pd linked to CN!than F
S,2.
IR spectroscopy was then used to identify the functional groups involved in the precipitates. The IR spectra of (a) FS,1 and (b) FS,2precipitates were analyzed and compared with the IR spectra of (c) palladium acetylacetonate, (d) palladium cyanide, (e) palladium acetate and (f) palladium pivalate (Fig. 5). The different bands are assigned in Table 4.
FS,1and FS,2exhibit the same vibration bands. The latter are very similar to those observed in the Pd(CN)2 commercial compound. In particular, the vibration bands at 2220 cm!1 (C^N), 551 cm!1(Pd–N or Pd–C), 464 cm!1(Pd–N or Pd–C) and 264 cm!1 (Pd–N) observed for the three compounds seem to conrm that FS,1and FS,2contain Pd(CN)2. The vibration band around 1610 cm!1may indicate the presence of O–C]O func-tions in FS,1 and FS,2 as this band is also observed in the spectrum of commercial palladium acetate, palladium pivalate and palladium acetylacetonate, which contain O–C]O group (Fig. 5). The presence of the O–C]O group is in agreement with the previous XPS results, which showed the presence of carboxylate groups in both precipitates. A comparison of the spectra of the precipitate, palladium acetate, palladium pivalate and palladium acetylacetonate shows a slight shi of the band located at 1610 cm!1. However, IR can only conrm the pres-ence of carboxylate group in the compound without giving its exact composition.
Fig. 3 Chemical structure proposed for Pd(CN)2$xH2O based on Pt(CN)2$0.67H2O proposed by Hibble.63
Fig. 4 XPS core level spectra Pd-3d of (a) FS,1, (b) FS,2 and (c) commercial compounds (in red palladium acetate and in blue palla-dium cyanide).
FS,1, FS,2 and the commercial compound Pd(CN)2 were analysed by thermogravimetric analysis coupled with a differ-ential scanning calorimeter (TGA-DSC) (Fig. 6). The thermal behaviour of FS,1and FS,2 are quite close. Two endothermic peaks observed between 25#C and 110#C, and between 350#C and 650 #C as well as an exothermic peak located between 110#C and 350#C accompanied by weight loss were observed. The reaction between 25#C and 110#C, and between 110#C and 350#C can be attributed to water vaporization63and release of
organic functions,67,68 respectively. The weight loss between
350#C and 650#C may correspond to the release of (CN)2(g).63
TGA analyses are consistent with the previous results: the precipitates may be composed of palladium cyanide and organic compounds.
TGA analyses allow calculating moisture content in the precipitates (% Moisture). Likewise, it is also possible to calculate the weight percentage of palladium in the precipitates (%wPd) by considering a complete degradation of the product when samples are heated at 650#C in nitrogen atmosphere. At this temperature, there is no additional organic matter in the precipitate and the weight of the sample corresponds to the weight of palladium. Moreover, the weight of organic (%w organic) and cyanogen (%w (CN)2) can also be calculated. Finally, the weight percentage of Pd-cyano groups (%wPd(CN)2) and Pd-carboxylate groups (%w Pd(O–C]O)) in FS,1, FS,2 and
Table 1 Binding energies (in eV) of Pd 3d, C-1s and N-1s for FS,1, FS,2, palladium acetate, palladium pivalate, palladium ac´etylac´etonate and palladium cyanide. The environment of each element is given in bracketsa
Compound
Binding energy (eV)
Pd 3d5/2 N-1s C-1s FS,1 338.8 $ 0.3 (Pd(OCO) 399.8 $ 0.3 (Pd(CN)2) 286.4 $ 0.3 (C^N) 339.9 $ 0.3 (Pd(CN)) 401.9 $ 0.3 (*) 289.0 $ 0.3 (C–COO) FS,2 338.9 $ 0.3 (PdOCO) 399.8 $ 0.3 (Pd(CN)2) 286.3 $ 0.3 (C^N) 340.0 $ 0.3 (Pd(CN)) 401.9 $ 0.3 (*) 289.0 $ 0.3 (C–COO) 338.8 $ 0.3 (Pd(OCOCH3)) — 285.6 $ 0.3 (C–COO) 286.5 $ 0.3 (C–O) 338.7 $ 0.3 (Pd(OCOC(CH3)3) — 289.0 $ 0.3 (C–COO) 285.8 $ 0.3 (C–COO) 339.0 $ 0.3 (Pd(OC5H7O)) — 288.7 $ 0.3 (C–COO) 285.8 $ 0.3 (C–CO) 339.8 $ 0.3 (Pd(CN)2) 399.6 $ 0.3 (Pd(CN)2) 286.1 $ 0.3 (C^N) a*Pd–NR
4+: attributionbased on the ref. 64.
Table 2 Pd/N atomic ratio determined by XPS
Ratio
Commercial compound
Pd(CN)2 FS,1 FS,2
Pd/N 0.64 0.38 0.67
Table 3 Palladium/CN and Pd/O–C]O ratios in FS,1 and FS,2 deduced by XPS
Sample Pd–CN Pd–O]C–O
FS,1 41 59
FS,2 80 20
Fig. 5 IR spectra of (a) FS,1(b) FS,2, (c) palladium acetylacetonate, (d) palladium cyanide, (e) palladium acetate and (f) palladium pivalate.
Pd(CN)2can be deduced from TGA experiments by using the calculation method reported in the experimental part (eqn (13) and (14)). Table 5 reports these values.
The moisture contents are similar in the precipitates (2–3% for water). Moreover, total palladium contents are in the same order of magnitude in the solids FS,1and FS,2(around 54–57% for Pd). The major difference in composition between FS,1and FS,2 is the distribution between the CN! group and COO! group. FS,2contains more palladium coordinated to CN!than FS,1(55% vs. 39%). Conversely, more palladium coordinated to carboxylate group is observed in FS,1than FS,2. Although the distribution of Pd species determined by TGA-DSC is slightly different from that calculated from XPS data (see Table 3), both techniques show that more Pd is linked to CN!in F
S,2than in FS,1. This difference could be due to the difficulty by TGA-DSC to quantify precisely the (CN)2(g)release between 350#C and 650#C in FS,1and FS,2. In the commercial compound Pd(CN2), the loss in mass of (CN)2(g)is well dened in TGA-DSC data, whereas a broad signal is observed for the precipitates. More-over, the XPS analysis allows analysing the extreme surface of the powder only. Some errors can come from the choice of the background, the recombination of the spectra and a different depth of analysis from one sample to another.
Analysis of the precipitates aer solubilisation
Direct analyses of the precipitates by IR, Raman and XPS showed that Pd is coordinated to CN!and COO!while NR
4+groups may be present in the precipitates. However, it is impossible to conrm the exact number of palladium and organic complexes
Table 4 Identification of the main vibration bands observed in the IR spectra of FS,1, FS,2, FS,3, palladium cyanide, palladium acetate, palladium acetylacetonate and palladium pivalate and their attribution. w ¼ weak; m ¼ medium; s ¼ strong
Assignment
Wavenumber (cm!1)
FS,1 FS,2 FS,3
Palladium
cyanide63 Palladiumacetate65 Palladiumacetylacetonate66 Palladiumpivalate H2O or amine + CH3, as stretch 3680 to 2999 (m) 3679 to 2991 (m) 3378 to 3015 (w) — 2937 (w) 2921 (w) CH–CHalkane 2960 to 2870 (w) 2956 to 2870 (w) 2975 to 2827 (w) — C^N 2221 (m) 2221 (m) — 2218 (m) H2O or O–C]O 1610 (m) 1610 (m) 1610 (s) 1616 (w) 1593 (s) 1565 (m) 1595 (s) P–O–C or H2O 1028 (s) 1028 (s) 1022 (s) — Pd–N or Pd–C 551 (m) 551 (m) — 547 (s) Pd–N or Pd–C, Pd–O 464 (m) 464 (m) — 462 (s) 462 (s) 466 (s) Pd–N, Pd–O, OPdO 266 (w) 264 (w) — 266 (s) 268 (m) 262 (m)
Fig. 6 TGA thermograms of (a) FS,1(in green), (b) FS,2(in blue) and (c) Pd(CN)2,0.29H2O (in red). Black line: heat flow (mV); measurements performed in nitrogen atmosphere.
Table 5 Quantitative analyses of the precipitates and Pd(CN)2$xH2O by TGA-DSC, i.e. weight percentages of moisture (% Moisture), palladium (%wPd), cyanogen (%w(CN)2), organic compounds (%worganic)in FS,1, FS,2and the commercial palladium cyanide. Calculation of the distribution Pd species in the precipitates: %wPd(CN)2corresponds to palladium coordinated to CN group and %wPd(O–C]O)corresponds to palladium coordinated to carboxylate group
Sample %wMoisture (between 25#C and 110#C) %w Pd (at 650#C) %W(CN)2 (between 350 and 650#C) %WOrganic (between 110 and 350#C) %w Pd(CN)2 %w Pd(O–C]O) FS,1 3 54 10 33 39 61 FS,2 3 57 16 24 55 45 Pd(CN)2$xH2O 2 68 30 — 94 —
present in the precipitates. In order to deeply characterize the precipitates, they were dissolved in several solvents (DMSO (dimethyl sulfoxide), NH3(1 mol L!1), pyridine) and the obtained solutions were analysed. It was expected that NH3would be able to dissolve the precipitates as Pd(CN)2can be dissolved in NH3by forming the soluble complex Pd(CN)2(NH3)2.69Aer 15 minutes of stirring of 20 mg of precipitate in 10 mL of 1 mol L!1NH
3, a ltrate (FF1) and an insoluble fraction (FS,3) were obtained. The insoluble fraction FS,3and the ltrate FF1were then analysed by IR and Raman spectroscopy (Fig. 7).
The corresponding vibration bands are reported in Table 4. These spectra show the presence of vibration bands at 2218 cm!1 (C^N), 551 cm!1, 464 cm!1, and 266 cm!1(Pd–N or Pd–C) in FS,1. These bands have not been observed in FS,3. Therefore, this study conrms that 1 mol.L!1NH
3allows solubilizing Pd(CN)2. Moreover, further XPS analyses performed on the FS,3fraction conrm that NH3totally dissolved Pd(CN)2since the Pd contri-bution located at 339.3 eV has disappeared (Fig. S2, ESI†). This conclusion was also conrmed by Raman spectroscopy on the ltrate FF1, since two vibration bands located at 2149 and 2140 cm!1attributed to cyano groups were observed (Fig. 8).
Furthermore, the presence of an insoluble fraction FS,3 (partial dissolution of FS,1in NH31 mol L!1) seems to show that the precipitate is composed of at least of two different compounds. The second compound contains H2O molecules (vibration bands 3680–3379 cm!1 and 1610 cm!1), CH–CH groups (vibration bands at 2975 and 2827 cm!1assigned to CH– CHalkane vibration), O–C]O functions (vibration band at 1610 cm!1), phosphate groups (vibration bands at 1274 cm!1, 1022 cm!1) or R–NH
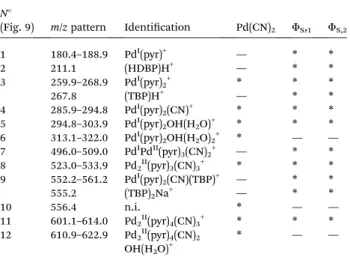
2functions (vibration bands at 1274 cm!1). ESI-MS experiments were undertaken to characterize the precipitates aer dissolution in pyridine. This technique allows the transfer of pre-existing ions from the solution into the gas phase in order to obtain speciation information. Fig. 9 shows ESI-MS spectra obtained aer partial dissolution in pyridine of FS,1, FS,2and the commercial compound Pd(CN)2. The main ions containing Pd were identied by comparison with a calcu-lated isotopic pattern (Table 6).
Most ions contain pyridine indicating a strong solvation of Pd by pyridine during the solubilisation step. Moreover, the presence of ions of m/z ¼ 180.4–188.9, 259.9–268.9, 285.9–294.8, 294.8–303.9, 313.1–322.0, 496.0–509.0 and 552.2–561.2 assigned to Pd(pyr)+(pyr ¼ C
5H5N), Pd(pyr)2+, Pd(pyr)2(CN)+, Pd(pyr)2OH(H2O)+ Pd(pyr)2OH(H2O)2+, Pd2(pyr)3(CN)2+, and PdI(pyr)
2(CN)(TBP)+indicates the partial reduction of Pd(II) into Pd(I). Nevertheless, it is not possible to say if Pd reduction occured during the dissolution step of the solid in pyridine or during the de-solvation/ionization step. The ions of m/z ¼ 259.9–268.9, 285.9–294.8, 294.8–303.9, 523.0–533.9 and 601.1– 614.0 corresponding to Pd(pyr)2+, Pd(pyr)2(CN)+, Pd(pyr)2 -OH(H2O)+, Pd2(pyr)3(CN)3+ and Pd2(pyr)4(CN)3+, respectively, were present in both the commercial compound and the precipitates FS,1and FS,2. The ions of m/z ¼ 313.1–322.0 and 610.9–622.9 assigned to Pd(pyr)2OH(H2O)2+ and
Fig. 8 Raman spectrum of FF1obtained after dissolution of FS,1in NH3 (1 mol L!1) at a solid : liquid ratio of 9 (mass of precipitate in g/volume of solvent in L).
Fig. 9 ESI-MS spectra of (a) FS,1, (b) FS,2and (c) Pd(CN)2after partial dissolution in pyridine (solid : liquid ratio ¼ 2 g L!1) and dilution in acetonitrile ((a) 1/10th, (b) 1/100thand (c) 1/10th). Experiment condi-tions: trap drive setting ¼ 50; skimmer voltage ¼ 30 V.
Fig. 7 IR spectra of (a) FS,3(solid residue after dissolution of the FS,1in 1 mol L!1NH
Pd2(pyr)4(CN)2OH(H2O)+, respectively, were only observed aer dissolution of the Pd(CN)2commercial compound whereas the ions of m/z equal to 259.9–268.9, 267.8, 523.0–533.9, 552.2– 561.2, 555.2 and 601.1–614.0 assigned to Pd(pyr)2+, (TBP)H+, Pd2(pyr)3(CN)2+PdI(pyr)2(CN)(TBP)+, (TBP)2Na+, and Pd2(pyr)4 -(CN)3+, respectively, were observed aer dissolution of the precipitates in the pyridine. Thus, some differences are observed between the solution obtained aer solubilisation of the commercial Pd(CN)2 compound and the precipitates. Moreover, the ion of m/z equal to 556.4 observed in the commercial compound does not contain palladium and may be due to the presence of an organic impurity because of the very high sensitivity of the technique.
In the Pd(CN)2commercial compound, each palladium atom is surrounded by four CN groups. However, some water mole-cules can terminate the periodic structure (see Fig. 3). During the solubilisation step, pyridine molecules solvate the palla-dium and replace some CN group to produce Pd2(pyr)4(CN)3+ and Pd2(pyr)4(CN)2OH(H2O)+. Then, during the transfer from the solution to the gas phase in the mass spectrometer, these ions can be modied by release of a pyridine, CN group or water molecules and Pd(II) could be reduced so that Pd2II(pyr)4(CN)3+; Pd2II(pyr)3(CN)3+. PdI(pyr)2OH(H2O)2+; PdI(pyr)2OH(H2O)+; PdI(pyr)
2CN+and PdI(pyr)2+can be formed.
Aer solubilisation of the precipitates, the ions Pd2(pyr)4(CN)2 -OH(H2O)+and PdI(pyr)2OH(H2O)2+were not observed. However, the ions PdI(pyr)
2(CN)(TBP)+, (TBP)2Na+and (TBP)H+were observed and indicate the presence of the TBP in the solution. The presence of HDBP was also conrmed since an ion of m/z ¼ 211.1 which corresponds to (HDBP)-H+ is observed. Comparing to the commercial compound in which water molecules terminate the periodic structure, it is possible that in the precipitate some TBP molecules terminate the structure. Thus, although not conclusive
in providing structural information for the solid, the ESI-MS results provide evidence that the presence of TBP in the precipitates.
In order to get information about the chemical structure of the precipitates 1D and 2D1H NMR spectra were recorded aer FS,2dissolution in DMSO-D6 (deuterated DMSO). Pyridine was not used for NMR analyses in spite of the high solubilization power of pyridine because of the two following drawbacks: (i) pyridine peak overlap1H signal in the aromatic area (about 7 ppm) and (ii) pyridine can easily dissociate Pd species. The 1D 1H NMR spectrum of F
S,2exhibits the reference peak at 0 ppm (TMS) and a peak located at 2.5 ppm attributed to residual protons of DMSO-D6 (Fig. 10). The triplet and the three multi-plets located at 0.85, 1.31, 1.53 and 3.82 ppm, respectively, correspond to the butyl protons in TBP (for more information ESI – Fig. S3 and S4†). The three symmetric peaks of same intensity centred at 7.05 ppm indicate protons coupling with a nucleus of spin 1 (Fig. 10). Among the nuclei in the sample, only the nitrogen has a spin 1. The corresponding J14N1H
coupling constant of 104 Hz is in the magnitude order of1J NH (i.e.1H one bond apart from14N) and consequently could be due to the presence of an amine function.
In order to conrm the presence of amine functions in the precipitate FS,2, a biphasic system composed of 30%volTBP diluted in TPH contacted with 3 mol L!1 nitric acid solution containing palladium nitrate (5 g L!1Pd) and NaNO
3(66 g L!1) enriched with 98% atomic15N was irradiated and the aqueous phase was analyzed. The15N NMR spectrum shows a triplet centred on !360 ppm (15N scale is referenced to CH
3–NO2) that is characteristic of NH2functions (Fig. S5, ESI†). The 2D15N–1H spectrum displayed in Fig. S7 (ESI†) shows a correlation spot (1J
15N1H¼ 72 Hz) between the triplet at !360 ppm observed in
the 15N NMR spectrum (Fig. S7†) and the peak located at 6.1 ppm observed in the1H NMR spectrum (Fig. S6 in ESI†). Therefore, protons observed at 6.1 ppm corresponds to NH2 functions. Likewise, the peaks centred at 7.05 ppm in the1H NMR spectrum of FS,2can be assigned to an amine function.
To complete1H NMR peak assignments for F
S,2, gHSQCAD and gHMBCAD pulse sequences were performed. These 2D
Fig. 10 1D1H NMR spectrum of F
S,2partially dissolved in DMSO-D6 m(FS,2) ¼ 9.8 mg in 650 mL of DMSO-D6, i.e. S/L ¼ 15.07 g of precipitate/L of solvent.
Table 6 m/z ratios and Pd species assignments in ESI-MS (positive ionization mode) for FS,1, FS,2and Pd(CN)2in pyridine. pyr ¼ pyridine ¼ C5H5N; TBP ¼ tri-n-butylphosphate ¼ C12H27O4P. Peak numbers (N#) are reported in Fig. 9a
N#
(Fig. 9) m/z pattern Identication Pd(CN)2 FS,1 FS,2 1 180.4–188.9 PdI(pyr)+ — * * 2 211.1 (HDBP)H+ — * * 3 259.9–268.9 PdI(pyr) 2+ * * * 267.8 (TBP)H+ — * * 4 285.9–294.8 PdI(pyr) 2(CN)+ * * * 5 294.8–303.9 PdI(pyr) 2OH(H2O)+ * * * 6 313.1–322.0 PdI(pyr) 2OH(H2O)2+ * — — 7 496.0–509.0 PdIPdII(pyr) 3(CN)2+ — * * 8 523.0–533.9 Pd2II(pyr)3(CN)3+ * * * 9 552.2–561.2 PdI(pyr) 2(CN)(TBP)+ — * * 555.2 (TBP)2Na+ — * * 10 556.4 n.i. * — — 11 601.1–614.0 Pd2II(pyr)4(CN)3+ * * * 12 610.9–622.9 Pd2II(pyr)4(CN)2 OH(H2O)+ * — — a
*, observed species; —, non detected species; n.i.: non identied species.
pulse sequences allow13C assignments through1H detections and the corresponding coupling constants: (1J
CHfor gHSQCAD) and (nJ
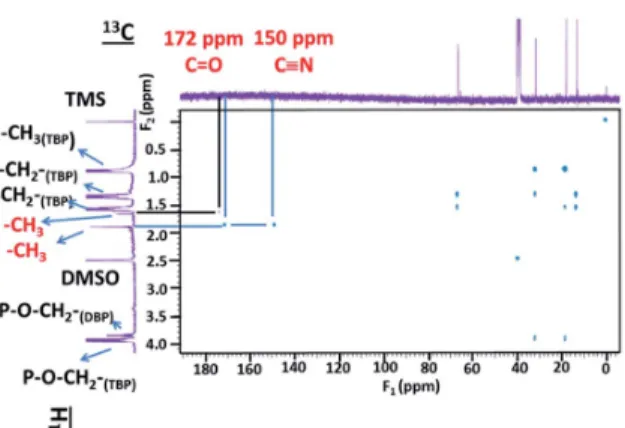
CHwith n ¼ 2 or 3 for gHMBCAD) (Fig. 11 and 12). In Fig. 11, positive red crosspeaks belong to CH– and –CH3groups whereas negative blue peaks belong to –CH2–groups. The two red cross-peaks at (1.6 ppm; 13.8 ppm) (1H scale;13C scale) and (1.9 ppm; 13.8 ppm) are two unshielded –CH3groups. At 0.85, 1.31, 1.53 and 3.82 ppm (1H scale), the set of large and small cross peaks are assigned to the CH3–, two –CH2–and –CH2–O–P groups at 13.8, 18.6, 32.2 and 67.0 ppm (13C scale) of the butyl chains bearing on TBP (main compound) and HDBP peaks arising from TBP degradation. The presence of TBP or HDBP in the precipitate is consistent with IR and ESI-MS data. On the 1H–13C gHMBCAD (Fig. 12), the –CH
3chemical shi located at 1.9 ppm on the 1H scale is correlated to carbon peaks two or three bonds apart at 172 and 150 ppm which are assigned to carbonyl and cyano groups respectively. Such information allows to suggest the presence of methyl-oxo-cyanide in FS,2 (CH3–CO–CN). NMR analyses for FS,1 have not been under-taken. However, the same results could be expected.
Discussion
In this work, g-irradiation of a biphasic system containing 30%vol TBP diluted in TPH (organic phase) in contact with palladium(II) nitrate dissolved in 3 mol L!1nitric acid (aqueous phase) led to the formation of a precipitate located at the liquid–liquid interface (FS,1) and a precipitate that settled spontaneously (FS,2) (Fig. 1). Elemental analyses showed that both precipitates contain palladium. Solubilisation tests demonstrated that the precipitates do not contain only one compound but a mixture of at least two compounds. XRD, XPS, TGA-DSC, IR, ESI-MS and NMR analyses allowed for the iden-tication of palladium cyanide in the precipitates. Other compounds such as palladium carboxylates, phosphates (i.e. TBP or HDBP), compounds with ammonium and/or amine functions may also be present to a lesser extent. In the
following, the presence of the different compounds in the precipitate is discussed.
The irradiation of a biphasic system leads to both radiolysis of nitric acid and water molecules in the aqueous phase, and radiolysis of the molecules present in the organic phase (TBP and TPH). Radiolysis of nitric acid primarily leads to the formation of HNO2(ref. 23 and 70) and H2O2(ref. 70) whereas radiolysis of TBP and TPH can generate many different degra-dation products such as alkenes, carbonyl compounds (R–CO– R0, R–CO–H), carboxylic acids (R–COOH), alcohols (R–OH), nitro compounds (R–NO2)23and phosphorus compounds such as HBDP, H2MBP, H3PO4, etc.26 In addition, several authors mentioned the formation of secondary products, such as oximes (R–C]N–OH), even though this molecule has never been formally identied.23,71 These oxime compounds have
a great affinity for Pd.72
NMR and ESI-MS analyses showed the presence of TBP and HDBP in FS,1and FS,2but these molecules may not be directly bonded to the Pd since XPS analyses showed only two different environments around Pd that are not characteristic of phos-phorous compounds but rather C^N and O–C]O groups. However, the presence of TBP and HDBP in the precipitate may also explained by the inclusion of TBP/HDBP molecule in the solid since the precipitate are obtained in the biphasic system containing both TBP and HDBP (due to the radiolytic degra-dation of the TBP).
Besides, NMR analyses showed the presence of carboxylate and CN group. XPS indicated that these two groups are directly bonded to palladium. The formation of Pd-carboxylate compounds could be easily explained by the reaction of carboxylic acid (radiolytic degradation products of the TBP– alkane solution73–76) with the palladium leading to a precipitate.
Regarding the palladium cyanide formation, an assumption would be the reaction of HCN with the palladium present in the organic/aqueous solutions. Ketones and oximes seem to be a valuable precursor to the formation of HCN among the degradation products formed during g-irradiation.77,78 In
particular, it is interesting to highlight that heating of alde-hydes, ketones or alcohols in the presence of hydroxylamine
Fig. 12 2D NMR spectrum of1H and13C (pulse sequence gHMBCAD) of FS,2partially dissolved in DMSO-D6 with m(FS,2) ¼ 9.8 mg in 650 mL of DMSO-D6 (S/L ¼ 15.07 g of precipitate/L of solvent).
Fig. 11 2D NMR spectrum of1H and13C (pulse sequence gHSQCAD) of FS,2partially dissolved in DMSO-D6 with m(FS,2) ¼ 9.8 mg in 650 mL of DMSO-D6 (S/L ¼ 15.07 g of precipitate/L of solvent).
(NH2OH) or nitrous acid (HNO2) in acidic media can be responsible for HCN formation.77An oxo-oxime can be formed
by the addition of HNO2or NH2–OH to the carbon in a position of the carbonyl group (eqn (1)). This species becomes dehy-drated and leads to the formation of an a-keto-cyanide (eqn (2)), which can be hydrolyzed into carboxylic acid (R–CO–OH) with the departure of HCN (eqn (3)).77
(1)
(2)
(3)
Other ways to produce oxime that are consistent with the experimental conditions of the PUREX process were also re-ported in the literature.77In presence of HNO
2, alcohols can and form nitrous acid ester by esterication (eqn (4)). A rearrange-ment can occur to produce a compound containing both an hydroxyl (–OH) and a nitroso (–N]O) groups, i.e. an oxime (eqn (5)). The oxime can be aerward hydrolysed into a ketone (eqn (6)). Finally, the ketone can form HCN by reacting with HNO2or NH2OH according to eqn (1) to (3).
(4)
(5)
(6)
Another alternative pathway for oxime formation could be the reaction of CH3c radical with NO (eqn (7)) since NO radicals can be formed by irradiation of TBP or alkanes.79
CH3c + NO / H3C–N]O%H2C]N–OH (7)
In this particular case, CH2]N–OH can lead to the forma-tion of HCN in the presence of Pd(0) according to Scheme 1. The presence of Pd(0) is likely and has already been reported by Vialard and Germain12aer radiolysis of TBP in alkane solution
in contact with aqueous phase.
Finally, HCN can react with Pd2+to form Pd(CN)
2as shown in eqn (8) since the stability constant is quite high (K ¼ 10+41.8).80
Pd2+ 2HCN
¼ Pd(CN)2+ 2H+ (8) Several formation pathways for Pd(CN)2have been proposed. An organic degradation product, such as alcohol, carbonyl compound or methyl radical, in the presence of HNO2 or NH2OH allows the formation of HCN. Then, in presence of Pd2+ in solution and HCN, Pd(CN)2can be formed with a thermody-namic constant of 10+41.8(Scheme 2).
Conclusion
XRD, XPS, TGA, IR, ESI-MS and NMR have been used to char-acterize the two precipitates (FS,1 and FS,2) produced by g-irradiation at 500 kGy of 30%voltri-n-butylphosphate diluted in TPH in contact with nitric acid containing palladium(II) nitrate. FS,1and FS,2exhibit similar structures and contain a mixture of Pd(CN)2and other compounds (Pd-carboxylate, ammonium or amine functions and phosphorous compounds). The degrada-tion products formed during irradiadegrada-tion of the two-phase biphasic system may be responsible for precipitates formation of palladium. Among the degradation products formed by irradiation, ketones and oximes could be responsible for precipitate formation.
Future studies designed to validate the proposed Pd(CN)2 formation mechanism and to identify the other Pd compounds are currently under progress. Nitrate group arising from nitric acid or palladium nitrate may be responsible for the presence of CN!in the precipitates since only these two products contain nitrogen atoms in the biphasic system. Therefore, g-irradiation in the presence of15HNO
3may be very helpful to identify the different intermediates involved in HCN formation. Specically,
Scheme 1 Proposition of catalytic mechanism for HCN formation in the presence of Pd0and formaldehyde oxime.
analyses of the organic and the aqueous phases could provide information on the nitrogen species formed by g-irradiation and allow for the conrmation or invalidation of the proposed mechanism for palladium cyanide formation. Biphasic systems containing an organic phase either of pure TBP or pure dodecane in contact with a nitric acid aqueous solution con-taining palladium(II) nitrate will be irradiated under the same conditions as the biphasic system {TBP–TPH–HNO3–Pd} described in this study in order to determine which organic molecule is responsible for the precipitate formation.
Experimental
Reagent
Palladium nitrate (purity ¼ 99.9%, Sigma Aldrich), 68.5%wt nitric acid (purity ¼ 99.8%, VWR), TBP (purity $ 99.9%, VWR) and tetrapropylene hydrogen (TPH, petroleum fraction, Nova-sep) were used without further purication. The extraction
solvent was prepared by mixing appropriate amounts of TBP and TPH (30%volTBP diluted in TPH). Palladium(II) nitrate was weighted in order to obtain a concentration of 0.02 mol L!1(or 2 g L!1) of Pd in 3 mol L!1nitric acid aqueous solution prepared by dilution of 68.5%wtnitric acid in Milli-Q deionized water. The solution was ltered to remove traces of metallic palladium. Palladium(II) cyanide (purity ¼ 99.9%), palladium(II) acetate (purity $ 99.9%) palladium(II) pivalate (purity ¼ 97%), palla-dium(II) acetylacetonate (purity ¼ 99%) were purchased from Sigma Aldrich and used without further purication.
Dimethyl sulfoxide (DMSO, purity ¼ 99.5%, VWR), pyridine (pyr, purity ¼ 99.7%, VWR), ammonia (purity ¼ 99.8%, VWR), dichloromethane (purity ¼ 99.9%, Sigma Aldrich), tetrahydro-furan (THF, purity $ 99.9%, Acros Organic), methanol (purity ¼ 99.8%, VWR), acetone (purity ¼ 99.9%, VWR) were used without further purication.
An aqueous solution of 1 mol L!1 sodium hydroxide was purchased from VWR and used for potentiometric titrations.
A palladium solution of 1000 mg mL!1in 10%
wtHCl provided by Fischer Scientic was used to prepare the standard solutions for ICP-AES measurement.
Synthesis of the palladium precipitates
A 3 mol L!1nitric acid aqueous phase containing 0.02 mol L!1 palladium(II) nitrate (2 g L!1 of Pd) was contacted with an organic phase containing 30%vol TBP diluted in TPH with a volume ratio organic to aqueous phase of 1. The organic phase was not pre-equilibrated before extraction of Pd(II). The biphasic system was shaken for 5 minutes at ambient temper-ature before g-irradiation to 500 kGy by using a60Co source at the Synergy Health company (Marseille, France) with a dose rate of about 5 kGy h!1. The integrated dose was chosen to accel-erate the degradation process and to simulate long term behaviour of the solvent under irradiation stress. Aer g-irra-diation of the biphasic system, four phases were observed: an organic phase (Forg), an aqueous phase (Faq), a light precipitate at the liquid–liquid interface (FS,1) and a heavy precipitate (FS,2) at the bottom of the ask as illustrated in Fig. 1. Precipitates were recovered and ltered under vacuum. Aerwards, they were washed twice with 2 mol L!1nitric acid and dried at 40#C for 24 hours. The palladium concentration and the acidity of the liquid phases, before and aer irradiation are reported Table 7. The acidity of the organic and the aqueous phases scarcely decreased while the palladium concentration in the aqueous phase decreased drastically.
Table 7 Palladium and proton concentrations before and after g-irradiation at 500 kGy of the biphasic system. Initial composition: 30%volTBP in TPH in contact with 0.02 mol L!1palladium(II) nitrate in 3 mol L!1nitric acid aqueous phase with an organic:aqueous phase ratio of 1 : 1 (g-irradiation performed with60Co)
[Pd]aq(mmol L!1) [H+]aq(mol L!1) [H+]orga(mol L!1)
Before irradiation Aer irradiation Before irradiation Aer irradiation Before irradiation Aer irradiation 18 $ 10!3 4 $ 10!3 2.63 $ 0.07 2.45 $ 0.07 0.62 $ 0.07 0.60 $ 0.07
Scheme 2 Proposition of a formation pathway for Pd(CN)2 after irradiation of a biphasic system composed of TBP in alkane in presence of nitric acid solution containing palladium(II) nitrate.
The volumes of the aqueous and organic phases before g-irradiation and the weight of the precipitates fS,1 and fS,2 recovered aer irradiation are reported in Table 8.
In order to characterize the composition of the precipitates, dissolution tests were performed by using DMSO, CH2Cl2, THF, methanol, acetone, NH3(1 mol L!1) and pyridine. No complete dissolution of FS,1and FS,2with a S/L of 2 (solid/liquid: mass of precipitate (g)/volume of the solvent (L)) for 15 minutes at room temperature was achieved with these solvents. DMSO, pyridine and 1 mol L!1NH
3lead to the best dissolution of the precipi-tates. Table 9 shows the experimental conditions requested to dissolve partially the precipitates in DMSO, pyridine or 1 mol L!1NH
3and the weight of the insoluble part (aer the partial dissolution, a liquid phase (FF1) and a solid (FS,3) were obtained).
Table 10 gathers palladium concentration in these solvents aer partial dissolution of the precipitates FS,1and FS,2. The accuracy on the palladium concentration and the weight percent of palladium solubilized was 5%.
%wPd solubilized¼
mPdsolubilized
mPdð0Þ
100 (9)
The calculation of mPd(0)is described in the TGA-DSC anal-ysis, it corresponds to the mass remaining at 650#C.
Equipment and analysis
ThermoGravimetric analysis coupled with a differential scanning calorimeter (TGA-DSC). Thermogravimetric analyses coupled with a differential scanning calorimeter (TGA-DSC) were performed with a LABSYS EVO model from SETARAM under nitrogen at a ow rate of 20 mL min!1between 25#C and 650#C with a ramp of temperature of 5#C min!1. An alumina
crucible (90 mL) was used as reference crucible for TGA measurements. Experiments were conducted under inert nitrogen atmosphere in order to avoid side reactions between palladium salts and dioxygen responsible for PdO formation as reported by Gallager et al.67
The weight loss observed around 80#C attributed to the H 2O vaporization allows calculating the moisture content in the precipitates according to eqn (10)
% Moisture¼ minitialm ! m1 initial
100 (10) where minitialdenotes the initial mass of the precipitate used for TGA analysis and m1corresponds to the remaining mass at 110#C.
By considering that a complete degradation is achieved when the samples are heated at 650#C, the weight percent of palla-dium in the precipitates can thus be calculated as follows eqn (11).
%wPd¼ mPdð0Þ minitial
100 (11) where mPd(0)corresponds to the weight of sample at 650#C.
The weight loss observed between 25#C and 110#C, from 110#C to 350#C, and between 350#C and 650#C are attributed to H2O vaporization, organic compounds, and (CN)2 respec-tively. The weight percent calculations are detailed below. Based on the TGA analyses, a quantication of each loss in mass can be deduced.
Table 10 Palladium concentrations and weight percent of Pd solu-bilized in the filtrates after partial dissolution for 15 minutes stirring of FS,1and FS,2in DMSO, pyridine and 1 mol L!1NH3with a solid/liquid (S/ L) ratio of 2 (mass of precipitate used for the dissolution (g)/volume of the solvent (L))
Solvents used for the dissolution
%wPd
solubilizeda [Pd]solubilized (mol L!1) FS,1 FS,2 FS,1 FS,2 DMSO 10 9 9.2 ' 10!4 1.3 ' 10!3 Pyridine 80 81 6.8 ' 10!3 1.0 ' 10!2 NH3 99 83 9.1 ' 10!3 9.6 ' 10!3 aThe weight percent of palladium solubilized in each solvent DMSO, pyridine and NH3is calculated as shown in eqn (9).
Table 9 Volume (V) of solvent (DMSO, pyridine or 1 mol L!1NH
3) used to dissolve partially m (mg) of precipitates fS,1or fS,2and weight of insoluble fraction of solid (m0). Experimental conditions: room temperature; stirring time ¼ 15 minutes
Sample
Solvent
DMSO Pyridine 1 mol L!1NH3
m (mg) V (mL)
m0
(mg) m (mg) V (mL) m0(mg) m (mg) V (mL) m0(mg) FS,1 11.2 5.6 6.3 10.7 5.35 —a 11.3 5.65 0.3
FS,2 11.8 5.9 9.5 11.4 5.7 0.5 12.8 6.4 0.2
am0could not be determined since no enough insoluble fraction was obtained.
Table 8 Volumes of irradiated aqueous phase (Vaq) and organic phase (Vorg), and weights of precipitates fS,1and fS,1before and after g-irradiation (mfS,1and mfS,1, respectively)
Volume of the solutions before irradiation
Weights of precipitates aer irradiation
Vaq(mL) Vorga(mL) mfS,1(mg) mfS,2(mg)
By measuring the loss in mass of (CN)2produced between 300#C and 650#C, TGA analysis allows the determination of the mass associated to gaseous (CN)2thanks to eqn (12).
m(CN)2¼ m2! mPd(0) (12)
where m(CN)2denotes the mass of (CN)2in the sample, m2the
remaining mass of the sample at 350 #C and m Pd(0) the remaining mass at 650#C.
By assuming all the (CN)2is in palladium cyanide form, it is possible to calculate the fraction of Pd linked to cyano functions present in the total amount of the Pd in the precipitate as shown in eqn (13). %wPdðCNÞ2¼ mðCNÞ2 MðCNÞ2MPd 1 mPdð0Þ 100 (13)
where M(CN)2corresponds to the molecular weight of (CN)2and
MPddenotes the molecular weight of palladium.
The weight percent of palladium linked to carboxylate present in the total amount of the Pd in the precipitate can be deduced as follows by considering that only carboxylate and CN functions are linked to palladium in the precipitates (eqn (14)).
%wPd(O!C]O)¼ 100 ! %wPd(CN)2 (14)
At 350 #C, the loss in mass is attributed to organic compounds. The weight percent of organic compound can be deduced thanks to eqn (15).
%wOrganic¼
minitial! mPdð0Þ! mðCNÞ2! mH2O
minitial
100 (15) where minitialcorresponds to the initial mass of the precipitate used for TGA analysis, mPd(0), m(CN)2and mH2Orepresent weight
of palladium in the sample, weight of (CN)2 released, and weight of water present in the sample (mH2O¼ minitial! m1),
respectively.
In general, it may be considered that the TGA measurement uncertainties lead to an error of approximatively 10% for the difference weight percent calculations.
ATR-FTIR spectroscopy. IR spectra were recorded with a Fourier Transform Infrared Spectrometer Vertex 70 from BRUKER equipped with a wide range beam splitter (scan number ¼ 32; resolution ¼ 4 cm!1) and the DTGS wide range (diamond) allowing scanning between 80 and 4000 cm!1. Samples were deposited on an ATR diamond crystal.
Raman. Raman spectra were recorded with a labRAM HR evolution from HORIBA equipped with a laser with a wave-length of 633 nm. The acquisition time and the number of accumulations were of 100 seconds and 3, respectively. A quartz cell placed in the macro lens UV-Vis NIR was used. Raman spectroscopy was used to analyse the ltrate (fF1) obtained aer a partial dissolution of the precipitate fS,1in NH31 mol.L!1for 15 minutes of stirring at ambient temperature.
X-ray photoelectron spectroscopy. X-ray Photoelectron Spectroscopy (XPS) analyses were carried out with a Thermo-Fisher Escalab 250 XI spectrometer using a monochromatic Al Ka X-ray source (1486.6 eV). A dual beam charge compensation ood gun was used when important charge effects occurred and
the C-1s signal for adventitious carbon was used to correct the charge effect. The C–C/C–H component of C-1s spectra was xed at 285.0 eV. The spectrometer was calibrated to the silver Fermi level (0 eV) and to the 3d5/2core level of metallic silver (368.3 eV). The following core levels were recorded with a 20 eV pass energy: Pd-3d, C-1s and N-1s. Data processing was performed using the commercial Avantage® soware (ThermoFisher Scientic Inc.). Shirley background subtraction method was used for tting procedure. With our results, the Pd/N ratio was calculated. The Pd/C ratio could not be calculated due to the possible presence of contaminants. An intensity ratio of the peak can be calculated supposing the atoms considered for the calculation are not pollution. This ratio is then corrected by sensitivity factors (Scoeld factors have been used for quanti-cation) and spectroscopic factors (ability of the spectrometer to detect an electron of a dened energy). Moreover, the palla-dium proportion of the two contributions Pd–CN and Pd–O]C– O for FS,1and FS,2can be calculated based on XPS analysis. By calculating the maximum intensity ratio of Pd linked to CN function and Pd linked to carboxylate function and by consid-ering only two kinds of palladium are present in the precipi-tates, it is possible to obtain the palladium proportion of the two kinds of palladium. For XPS analysis, there are several sources of error in the weight percent calculated by this tech-nique. First of all, the XPS analysis only gives information to relative quantications. The errors can come from the choice of the background, the recombination of the spectra and a different depth of analysis from one sample to another. Finally, this technique allows analysing the extreme surface of the powder only and does not allow going deep into the sample. All this errors can explain the large uncertainty error in the value obtain by calculated of the proportions of Pd linked to cyano functions (C^N) and Pd linked to carboxylate functions (O–C]O).
X-ray powder diffraction analysis. X-ray powder diffraction analyses (XRD) were performed by means of a D8 Advance BRUKER diffractometer equipped with a LynxEyes™ detector. A copper cathode tube was used at a voltage of 40 kV and a current of 40 mA. XRD patterns were recorded between 2q ¼ 5#and 2q ¼ 140# with a step of 0.01# and an acquisition time of 0.5 s per step. Powders were deposited onto a mirror sample holder (monocrystal of silicon) wetted with ethanol to paste the powders. The Diffrac soware, Evaluation V2.1 and database ICDD PDF 2016 were used for indexing XRD patterns.
The precipitates were analyzed by Rietveld renement, using TOPAS 4.2 soware and Le Bail pattern matching.81The prole
parameters (cell dimension, peak shape, background, sample displacement correction and asymmetry) were dened. The peak shape was described by pseudo-Voigt function with the formulation of Caglioti.82
The Rietveld method83was used to determine the
crystallo-graphic structure of solid samples. The renement program minimizes the residual between experimental and calculated XRD patterns by the method of least squares. The quality of a renement was determined by comparing the experimental XRD pattern and the calculated one by means of the following parameters, which must be as low as possible:
- The RBraggfactor associated with a given structure is based on the integrated intensities and is calculated by eqn (16). The structural model is assumed to be correct when the ratio RBragg value is lower than about 5.
RBragg¼ P i jI iðobsÞ ! IiðcalcÞ j P i IiðobsÞ (16)
where Ii(obs) and Ii(calc) denote the intensities of the peak i in the experimental and calculated XRD-pattern, respectively.
- The factor Rwpweighted prole is associated with the whole pattern and is calculated as follows in eqn (17):
Rwp¼
ffiffiffiffiffiffiffiffiffiffiffiffiffiffiffiffiffiffiffiffiffiffiffiffiffiffiffiffiffiffiffiffiffiffiffiffiffiffiffiffiffiffiffiffiffiffiffiffiffiffiffiffi P
i
wi½yiðobsÞ ! YiðcalcÞ)2 P i wiyi2ðobsÞ v u u u t (17)
where yi(obs) denotes the intensity observed to the angle 2qI, yi(calc) corresponds to the calculated angle 2qi, and widenotes the statistical weight.
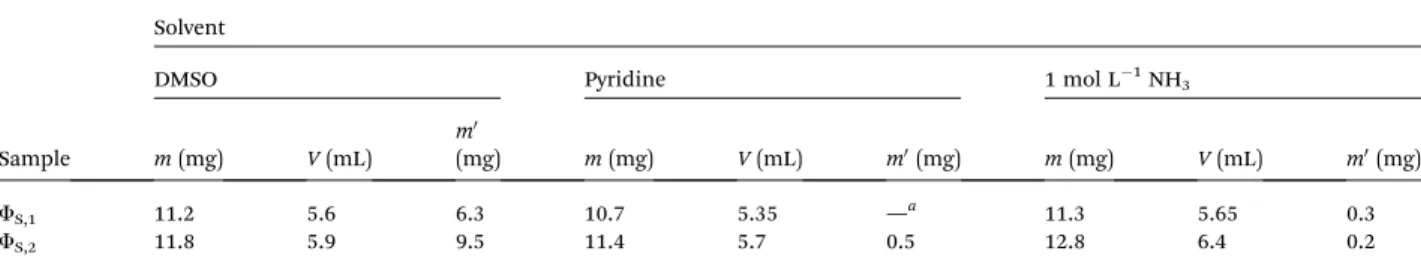
ionization mass spectroscopy. Electrospray-ionization mass spectrometry spectra (ESI-MS) were recorded in the positive ionization mode using a BRUKER Esquire-LC quadrupole ion trap equipped with an electrospray interface. A syringe infusion pump (Cole Palmer) delivered the sample at a rate of 180 mL h!1to the electrospray source. The capillary voltage was set to !4000 V. Nitrogen was employed as the drying and nebulizing gas. The drying gas ow rate was set to 4.0 L min!1and the nebulizing gas pressure was set to 5.0 psi. The source temperature was set to 250#C. Spectra were acquired over a mass/charge (m/z) range of 45–2200 with a trap drive setting of 50. All samples were diluted by a factor of 10 or 100 in acetonitrile prior to any injection into the ESI-MS. Species containing Pd atom(s) were identied by comparison with an isotopic pattern calculated using the soware DataAnalysis 4.0 (seen Fig. 13 as an example).
Nuclear magnetic resonance spectroscopy. Nuclear magnetic resonance spectra (1H NMR) were recorded on a 400 MHz Agi-lent DD2 spectrometer equipped with a OneNMR probe. Solu-tions were diluted using deuterated dimethylsulfoxide (DMSO-D6, Aldrich) containing traces of tetramethylsilane (0.03%). The measurements were performed in a 5 mm-diameter tube. Solutions were analysed by using 1D hydrogen spectra and 2D gHSQBC and gHMBC methods.
Inductively coupled plasma – atomic emission spectroscopy. Analyses by Inductively Coupled Plasma – Atomic Emission Spectroscopy (ICP-AES) were carried out with an Ultima 2 from HORIBA. The pressure of argon and nitrogen were 6 bar and 0.5 bar, respectively. The ux of plasma-forming and sheathing gas were 12 L min!1and 0.2 L min!1, respectively. ICP-AES was used to measure palladium concentrations in the aqueous phases. The calibration curve was determined by using 8 stan-dard solutions containing palladium at concentrations ranging from 0 to 20 mg L!1prepared from 1 g L!1commercial standard solution. The samples were diluted in 2%wnitric acid (prepared from 68.5%wnitric acid). The uncertainty obtained by ICP-MS is approximately 5%.
Potentiometric titration. The acidity of the organic phases was measured by 0.04 or 0.1 mol L!1NaOH standard solution (purity > 99.9% certied grade, provided by VWR) using a 785 DMP Titrino autotitrator from Metrohm. Aqueous samples were diluted in 80 mL of water (deionized water, 18.2 U). For organic samples analysis, samples were diluted in 80 mL of aqueous phase and 1 mL of acetone was added before titration to obtain a homogenous solution. The accuracy obtained by this method is approximately 3%.
Conflicts of interest
There are no conicts to declare.
Acknowledgements
This research was nancially supported by ORANO Cycle and Commissariat `a l’´Energie Atomique et aux ´Energies Alternatives (CEA). The authors would like to thanks Ashleigh Kimberlin for helpful comments and editing assistance.
References
1 H. A. C. Mc Kay, in Science and Technology of Tributyl Phosphate, ed. W.W. Schulz and James D. Navratil, CRC Press, Boca Raton, Florida, 1984, vol. 1, pp. 1–12.
2 R. Ruhela, A. K. Singh, B. S. Tomar and R. C. Hubli, RSC Adv., 2014, 4, 24344.
3 M. C. Charbonnel and L. Berthon, in Ion Exchange and Solvent Extraction, ed. B. Moyer, CRC Press Taylor & Francis Group, Boca Raton, London, New York, 2010, vol. 19, pp. 429–513.
4 J. W. Davis, in Science and Technology of Tributyl Phosphate, ed. W.W. Schulz and James D. Navratil James, CRC Press, Boca Raton, Florida, 1984, vol. 1, pp. 221–266.
Fig. 13 Experimental (at the top) and simulated (at the bottom) isotopic pattern of [Pd(pyr)2(CN)]+.
5 G. S. Barney and D. G. Bouse, Alpha radiolysis of tributyl phosphate – Effect of diluents, Atlantic Richeld Hanford Company, ARH-ST-153, Washington, 1977.
6 I. A. Kulikov, N. V. Kermanova, O. A. Sosnovskii, N. N. Shesterikov and M. V. Vladimirova, Sov. Radiochem., 1981, 23, 664–669.
7 Y. Gao, W. Zheng, X. Cao and S. Chen, Nukleonika, 2014, 59, 123–128.
8 J. Pearson and M. Nilsson, Solvent Extr. Ion Exch., 2014, 32, 584–600.
9 I. A. Kulikov, N. V. Kermanova and M. V. Vladimirova, Sov. Radiochem., 1983, 25, 310–316.
10 V. M. Adamov and V. I. Andrew, Kerntechnik, 1990, 55, 133– 136.
11 Z. Nowak, Nukleonika, 1977, 22, 155–172.
12 E. Vialard and M. Germain, in Extraction 84: Symposium on Liquid-Liquid Extraction, ed. Yong Zhou, Pergamon Press, Dounreay (UK), 1984, vol. 88, pp. 19–30.
13 E. S. Lane, Nucl. Sci. Eng., 1963, 17, 620–625.
14 O. K. Tallent, J. C. Mailen and K. D. Pannel, Nucl. Technol., 1985, 2, 417–425.
15 G. F. Egorov and O. P. Afanas’ev, At. Energy, 1983, 54, 347– 355.
16 S. C. Tripathi, P. Bindu and A. Ramanujam, Sep. Sci. Technol., 2001, 36, 1463–1478.
17 B. J. Mincher, S. P. Mezyk and L. R. Martin, J. Phys. Chem., 2008, 112, 6275–6280.
18 S. Mishra, C. Mallika, N. K. Pandey, U. Kamachi Mudali and R. Natarajan, Sep. Sci. Technol., 2015, 50, 1671–1676. 19 Z. Nowak, M. Nowak and A. Seydel, Radiochem. Radioanal.
Lett., 1979, 38(5–6), 343–354.
20 V. M. Adamov, V. I. Andreev, B. N. Belyaev, G. S. Markov, M. S. Polyakov, A. E. Ritori and A. Y. Yu Shil’nikov, Sov. Radiochem., 1991, 24, 153–158.
21 M. V. Krishnamurthy and R. Sampathkumar, J. Radioanal. Nucl. Chem. Lett., 1992, 166(5), 421–429.
22 Z. Nowak and M. Nowak, Radiochem. Radioanal. Lett., 1973, 14(3), 161–168.
23 D. Lesage, PhD th`ese, Universit´e de Paris VI, 1995. 24 D. Lesage, H. Virelizier, C. K. Jankowski and J. C. Tabet, J.
Spectrosc., 1997, 13, 275–290.
25 D. Lesage, H. Virelizier, C. K. Jankowski and J. C. Tabet, Eur. Mass Spectrom., 1998, 4, 47–54.
26 M.-C. Charbonnel and L. Berthon, Ion Exch. Solvent Extr., 2009, 19, 17–24.
27 B. J. Mincher, G. Modolo and S. P. Mezyk, Solvent Extr. Ion Exch., 2009, 27, 1–25.
28 V. Huss, PhD thesis, University of Aix-Marseille, 1991. 29 S. C. Tripathi and A. Ramanujam, Sep. Sci. Technol., 2003, 38,
2307–2326.
30 C. J. Hardy and D. Scargill, J. Inorg. Nucl. Chem., 1961, 17, 337–349.
31 J. C. Neace, Sep. Sci. Technol., 1983, 18, 1581–1594. 32 C. Miyake, M. Hirose, T. Yoshimura, M. Ikeda, S. Imoto and
M. Sano, J. Nucl. Sci. Technol., 1990, 27, 157–166.
33 D. N. Smith, H. G. M. Edwards, M. A. Hughes and B. Courtney, Sep. Sci. Technol., 1997, 32, 2821–2849.
34 E. Zimmer and J. Bochardt, Nucl. Technol., 1986, 75, 332–337. 35 C. Miyake, M. Hirose, T. Yoshimura, M. Ikeda, S. Imoto and
M. Sano, J. Nucl. Sci. Technol., 1990, 27, 256–261.
36 K. P. Lunichkina, E. V. Renard and V. B. Shevchenko, Russ. J. Inorg. Chem., 1974, 19, 110–113.
37 H. X. Huang, G. H. Zhu and S. B. Hou, Radiochim. Acta, 1989, 46, 159–162.
38 S. Tachimori, H. Nakamura and A. Sato, J. Radioanal. Nucl. Chem., 1979, 50, 143–151.
39 B. A. Powell, J. D. Navratil and M. C. Thompson, Solvent Extr. Ion Exch., 2003, 21, 347–368.
40 P. A. Zagorets, Sov. Radiochem., 1982, 24, 43–48.
41 L. L. Burger, in Progress in Nuclear Energy, ed. F. R. Bruce, J. M. Fletcher and H. H. Hyman, Pergamon Press, New York, 1958, vol. 2, p. 307.
42 M. V. Vladimirova, D. A. Fedoseev, I. A. Kulikov, I. A. Boikova, A. S. Milovanova and N. V. Kermanova, Sov. Radiochem., 1984, 26, 84–89.
43 M. V. Vladimirova, D. A. Fedoseev, I. A. Kulikov, A. S. Milovanova, I. A. Boikova, O. A. Sosnovskii, N. V. Kermanova and B. I. Bulkin, Sov. Radiochem., 1981, 24, 33–38.
44 M. V. Vladimirova, D. A. Fedoseev, I. A. Boikova and A. S. Milovanova, Sov. Radiochem., 1984, 26, 29–36. 45 L. P. Sokina, A. S. Solovkin, E. G. Teterin, F. A. Bogdanov and
N. N. Shesterikov, Sov. Radiochem., 1978, 20, 19–24. 46 P. Zhang, C. L. Song, J. F. Liang and R. X. Xin, Solvent Extr.
Ion Exch., 2001, 19, 79–89.
47 C. A. Blake Jr, W. Davis Jr and J. M. Schmitt, Nucl. Sci. Eng., 1963, 17, 626–637.
48 A. M. Rochon, Z. Nowak and Z. P. Zagorski, Radiochem. Radioanal. Lett., 1976, 27, 1–8.
49 C. Lamouroux, C. Moulin, J. C. Tabet and C. K. Jankowki, Rapid Commun. Mass Spectrom., 2000, 14, 1869–1877. 50 E. V. Barelko, I. P. Solyanina and G. S. Babakina, Sov.
Radiochem., 1976, 18, 573–577.
51 E. G. Teterin, N. N. Shesterikov, P. G. Krutikov and A. S. Solovkin, Russ. J. Inorg. Chem., 1971, 16, 77–80. 52 N. Uetake, J. Nucl. Sci. Technol., 1989, 26, 329–338.
53 J. H. Mesisenhelder and A. A. Siczek, Radiochim. Acta, 1980, 27, 223–227.
54 H. G. M. Edwards, M. A. Hughes, D. N. Smith and B. Courtney, J. Mol. Struct., 1995, 351, 65–76.
55 H. Sugai and K. Munakata, Nucl. Technol., 1992, 99, 235–241. 56 G. Modolo and S. Seekamp, Solvent Extr. Ion Exch., 2002, 20,
195–210.
57 B. Weaver and F. A. Kappelmann, J. Inorg. Nucl. Chem., 1968, 30, 263–272.
58 V. Guedon, PhD th`ese, Universit´e de Grenoble I, 1993. 59 V. Guedon, J. C. Thieblemont, Y. Revel and A. Vandrot, J.
Nucl. Sci. Technol., 1994, 31, 48–61.
60 J. Ly, PhD th`ese, Universit´e de Paris VI, 1984. 61 E. V. Renard, Sov. Radiochem., 1976, 18, 560–571.
62 S. De Sio, I. Klur, E. Tison, C. Bouyer, D. Lebeau, F. Goutelard, L. S´ejourn´e, C. Eysseric and N. Vigier, Procedia Chem., 2016, 21, 17–23.
63 S. J. Hibble, A. M. Chippindale, E. J. Bilb´e, E. Marelli, P. J. F. Harris and A. C. Hannon, Inorg. Chem., 2011, 50, 104–113.
64 G. Beamson and D. Briggs, High Resolution XPS of Organic Polymers: the Scienta Esca 300 Database, John Wiley and Sons Ltd, UK, 1992.
65 L. Soptrajanova and B. Soptrajanov, Spectrosc. Lett., 1992, 25, 1131–1139.
66 B. Bulkin and R. Rose, Appl. Spectrosc., 1978, 32, 151–157. 67 P. K. Gallagher and M. E. Gross, J. Therm. Anal., 1986, 31,
1231–1241.
68 L. Huang, Y. Wang, Z. Wang and F. Chen, Physical Chemistry, 2012, 2, 27–34.
69 A. G. Sharpe, in The Chemistry of Cyano Complexes of the Transition Metals, Academic Press, London, New York, 1976, vol. 11, pp. 243–248.
70 F. P. Miner, A. R. Kajanjian, A. K. Brown, P. G. Hagan and J. W. Berry, Radiation chemistry of nitric acid solutions – Technical Report RFP–1299, 1969.
71 A. J. Huggard and B. F. Warner, Nucl. Sci. Eng., 1963, 17, 638– 650.
72 A. Dakshinamoorthy, P. S. Dhami, P. W. Naik, N. L. Dudwadkar, S. K. Munshi, P. K. Dey and V. Venugopal, Desalination, 2008, 232, 26–36.
73 N. Getoff, Radiat. Phys. Chem., 2006, 75, 514–523. 74 V. M. Adamov, Radiokhimia, 1987, 29, 822–829.
75 Y. Tashiro, R. Kodama, H. Sugai, K. Suzuki and S. Matsuoka, Nucl. Technol., 2000, 129, 93–100.
76 J. Kuruc, A. Petr˚u, R. ˇCech and P. Rajec, J. Radioanal. Nucl. Chem., 1996, 208, 351–368.
77 H. Modler and M. Nonomura, Toxicol. Environ. Chem., 1995, 48, 155–175.
78 A. Costagliola, L. Venault, A. Deroche, G. Garaix, J. Vermeulen, R. Omnee, F. Duval, G. Blain, J. Vandenborre, M. Fattahi-Vanani and N. Vigier, Radiat. Phys. Chem., 2016, 119, 186–193.
79 B. Braithwate, Chem. Commun., 1969, 22, 1329.
80 J. M. Harrington, S. B. Jones and R. D. Hancock, Inorg. Chim. Acta, 2005, 358, 4473–4480.
81 AXS BRUKER, Soware TOPAS – version 4.2, 2009.
82 G. Caglioti, A. Paelotti and F. P. Ricci, Nucl. Instrum., 1958, 3, 223–228.


![Fig. 13 Experimental (at the top) and simulated (at the bottom) isotopic pattern of [Pd(pyr) 2 (CN)] + .](https://thumb-eu.123doks.com/thumbv2/123doknet/13122840.387588/14.892.464.793.154.414/fig-experimental-simulated-isotopic-pattern-pd-pyr-cn.webp)
