HAL Id: hal-02918668
https://hal.archives-ouvertes.fr/hal-02918668
Submitted on 21 Aug 2020
HAL is a multi-disciplinary open access
archive for the deposit and dissemination of
sci-entific research documents, whether they are
pub-lished or not. The documents may come from
teaching and research institutions in France or
abroad, or from public or private research centers.
L’archive ouverte pluridisciplinaire HAL, est
destinée au dépôt et à la diffusion de documents
scientifiques de niveau recherche, publiés ou non,
émanant des établissements d’enseignement et de
recherche français ou étrangers, des laboratoires
publics ou privés.
The inner two degrees of the Milky Way
M. Schultheis, R. Michael Rich, L. Origlia, N. Ryde, G. Nandakumar, B.
Thorsbro, N. Neumayer
To cite this version:
M. Schultheis, R. Michael Rich, L. Origlia, N. Ryde, G. Nandakumar, et al.. The inner two degrees
of the Milky Way: Evidence of a chemical difference between the Galactic Center and the
surround-ing inner bulge stellar populations. Astronomy and Astrophysics - A&A, EDP Sciences, 2019, 627,
pp.A152. �10.1051/0004-6361/201935772�. �hal-02918668�
https://doi.org/10.1051/0004-6361/201935772 c M. Schultheis et al. 2019
Astronomy
&
Astrophysics
The inner two degrees of the Milky Way
Evidence of a chemical difference between the Galactic Center and the
surrounding inner bulge stellar populations
M. Schultheis
1, R. M. Rich
2, L. Origlia
3, N. Ryde
4, G. Nandakumar
5,6, B. Thorsbro
4, and N. Neumayer
71 Université Côte d’Azur, Observatoire de la Côte d’Azur, CNRS, Laboratoire Lagrange, Blvd de l’Observatoire, 06304 Nice, France
e-mail: mathias.schultheis@oca.eu
2 Department of Physics and Astronomy, UCLA, 430 Portola Plaza, Box 951547 Los Angeles, CA 90095-1547, USA
e-mail: rmr@astro.ucla.edu
3 INAF-Osservatorio di Astrofisica e Scienza dello Spazio, Via Gobetti 93/3, 40129 Bologna, Italy
4 Lund Observatory, Department of Astronomy and Theoretical Physics, Lund University, Box 43, 221 00 Lund, Sweden 5 Research School of Astronomy & Astrophysics, Australian National University, ACT 2611, Australia
6 ARC Centre of Excellence for All Sky Astrophysics in Three Dimensions (ASTRO-3D), Australia 7 Max-Planck-Institut für Astronomie, Königstuhl 17, 69117 Heidelberg, Germany
Received 25 April 2019/ Accepted 18 June 2019
ABSTRACT
Context. Although there have been numerous studies of chemical abundances in the Galactic bulge, the central two degrees have been relatively unexplored due to the heavy and variable interstellar extinction, extreme stellar crowding, and the presence of complex foreground disk stellar populations.
Aims. In this paper we discuss the metallicity distribution function, vertical and radial gradients, and chemical abundances of α-elements in the inner two degrees of the Milky Way, as obtained by recent IR spectroscopic surveys.
Methods. We used a compilation of recent measurements of metallicities and α-element abundances derived from medium-high res-olution spectroscopy. We compare these metallicities with low-resres-olution studies.
Results. Defining “metal-rich” as stars with [Fe/H] > 0, and “metal-poor” as stars with [Fe/H] < 0, we find compelling evidence for a higher fraction (∼80%) of metal-rich stars in the Galactic Center (GC) compared to the values (50–60%) measured in the low latitude fields within the innermost 600 pc. The high fraction of metal-rich stars in the GC region implies a very high mean metallic-ity of+0.2 dex, while in the inner 600 pc of the bulge the mean metallicity is rather homogenous around the solar value. A vertical metallicity gradient of −0.27 dex kpc−1in the inner 600 pc is only measured if the GC is included, otherwise the distribution is about
flat and consistent with no vertical gradient.
Conclusions. In addition to its high stellar density, the Galactic center/nuclear star cluster is also extreme in hosting high stellar abun-dances, compared to the surrounding inner bulge stellar populations; this has implications for formation scenarios and strengthens the case for the nuclear star cluster being a distinct stellar system.
Key words. Galaxy: bulge – Galaxy: center – Galaxy: stellar content – stars: fundamental parameters – stars: abundances – infrared: stars
1. Introduction
The era of large spectroscopic surveys has strengthened the case that the central regions of the galaxy are dominated by an old metal-rich bulge/bar stellar population that is distinct in forma-tion history from the thin disk (see e.g., the reviews of Rich 2013;Origlia 2014, andBarbuy et al. 2018). The vast majority of these studies have been done at optical wavelengths (<1 µm) and in regions of relatively low interstellar extinction at b < −2◦,
such as the well-known Baade’s window (BW), although recent efforts have probed the bulge closer to the plane (Zoccali et al. 2017; Trapp et al. 2018). In these regions, due to the large-and high-variable interstellar extinction (see e.g.,Gonzalez et al. 2012;Schultheis et al. 2014;Nogueras-Lara et al. 2018a), obser-vations are limited to the near-infrared and longer wavelengths. With the recent development of high-resolution IR spectro-graphs, it is now possible to get detailed chemical abun-dances of giant stars in the inner Galactic bulge, although cool giants (with substantial molecular lines) remain a challenge
for abundance analysis. We define here the inner Galactic bulge with |l| < 10◦, |b| ≤ 3◦ assuming a distance to the
Galac-tic Center (GC) of 8.2 kpc (Karim & Mamajek 2017)1. Early high-resolution IR spectroscopy commenced with the Near Infrared Spectrometer (NIRSPEC) on Keck II (Rich et al. 2007,
2012), and then on larger samples with the Apache Point Observatory Galaxy Evolution Experiment (APOGEE) survey (Majewski et al. 2017). As was the case in the earlier studies with NIRSPEC, APOGEE works in the H-band where extinc-tion can still be significant (AV/AH∼ 6), especially in the inner
degree where it reaches extreme values (see e.g.,Schultheis et al. 2009; Fritz et al. 2011; Nogueras-Lara et al. 2018a). K-band spectroscopy (AV/AK ∼ 10) of M giants is thus the most efficient
way to measure detailed chemical signatures in the innermost regions (see e.g., Cunha et al. 2007; Ryde & Schultheis 2015;
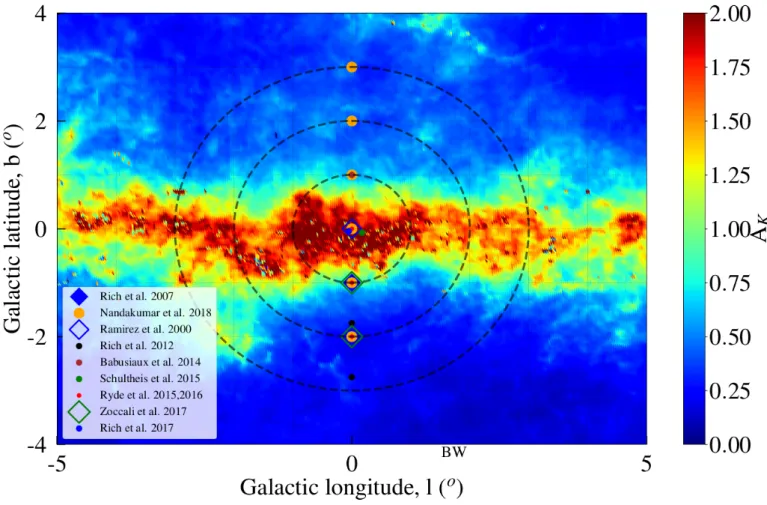
Nandakumar et al. 2018). Figure1shows a view of the different
1 1 degree corresponds to 145 pc.
Open Access article,published by EDP Sciences, under the terms of the Creative Commons Attribution License (http://creativecommons.org/licenses/by/4.0),
A&A 627, A152 (2019)
Fig. 1. Location of target fields from spectroscopic studies in inner bulge. The data is superimposed on the interstellar extinction map of
Gonzalez et al.(2012). The dashed lines denote an angular radius of 1, 2, and 3 degrees from the Galactic Center, respectively.
studies obtained in the inner Galactic bulge superimposed to the extinction map ofGonzalez et al.(2012).
In the central 5 pc, the stellar population is dominated by the nuclear star cluster, which hosts a wide range of stellar ages and metallicities, even including young massive stars (Genzel et al. 2010). Nuclear star clusters (NSCs) are in general the most dense stellar systems in the universe, with masses of 107M
and typical sizes of ∼5 pc (see Neumayer 2017). The NSC of the Milky Way has an estimated half-light radius of 4.2 ± 0.4 pc (Schödel et al. 2014) and a mass of 2 × 10⁷M
(Fritz et al.
2016; Feldmeier et al. 2014), and it also hosts the supermas-sive black hole, SgrA∗. Its formation mechanism is still under debate. Two main scenarios have been proposed: (i) stars have formed in situ in the center of the Milky Way (e.g., Seth et al. 2008;Milosavljevi´c 2004;Pflamm-Altenburg & Kroupa 2009); and (ii) star clusters have migrated from a larger distance (e.g.,
Tremaine et al. 1975; Capuzzo-Dolcetta 1993; Antonini 2013,
Gnedin et al. 2014). The metallicity distribution function, as well as detailed chemical abundances, are important constraints on the formation history of the NSC and inner bulge close to the Galactic plane. In the NSC, the cool stars amenable to abun-dance determination can run the gamut from red supergiants sev-eral Myr old, to red giants t ≥ 10 Gyr old.Carr et al.(2000) and
Ramírez et al. (2000a) carried out detailed abundance analysis using high-resolution IR spectra (R ∼ 40 000) and estimated a mean metallicity of +0.12 ± 0.22 dex for ten cool luminous supergiant stars in the GC. The same stars were remeasured by Cunha et al. (2007) with a slightly higher resolution (R ∼ 50 000) and they estimated a similar mean metallicity. However,
red supergiant stars have complex stellar atmospheres that are challenging to model and the analysis of such spectra is there-fore nontrivial (see e.g., Cunha & Smith 2006).Ramírez et al.
(2000a) determined, for the first time, metallicities of M giant stars in bulge fields along the minor axis using low-resolution (R ∼ 1300−4800) spectra. They determined metallicities based on the equivalent widths of three strong features in their K-band spectra, namely NaI, CaI, and the first overtone band of CO. They did not find any evidence for a metallicity gradient along the minor or major axes in the inner bulge (RGC. 560 pc).
Rich et al. (2007) did one of the first detailed abundance determination from high-resolution IR spectroscopy with NIR-SPEC (McLean 2005) at Keck II, by analysing 17 M giants located at (l, b) = (0◦, −1◦). They found a mean iron abun-dance of [Fe/H]= −0.22 with a 1σ dispersion of 0.14 dex. Later on,Rich et al.(2012) carried out a consistent analysis of 30 M giants at (l, b) = (0, −1◦.75) and (1◦, −2◦.75) that were observed
with the same instrument and estimated mean iron abundances of −0.16 ± 0.12 dex and −0.21 ± 0.08 dex, respectively. These authors also combined their analysis of 14 M giants in BW (l= 1◦.02, b = −3◦.93) using the same instrument andRich & Origlia
(2005) found no gradient in abundance nor [α/Fe] in the inner-most 150 pc to 600 pc region. Babusiaux et al. (2014) deter-mined metallicities for ∼100 red clump (RC) stars at (l, b) = (0◦, +1◦) using low-resolution optical spectra (R ∼ 6500) and found a mean metallicity very similar to that ofRamírez et al.
(2000b) and Rich et al. (2007) at (l, b) = (0◦, −1◦), sug-gesting symmetry between northern and southern inner bulge fields.
Schultheis et al.(2015) analysed APOGEE spectra of cool M giants in the inner degree, finding a significant presence of a metal-poor population enhanced in α-elements. However, inter-stellar extinction limited APOGEE observations near the GC, and only some red supergiants and luminous asymptotic giant branch stars (seeSchultheis et al. 2015) could be measured.
Do et al.(2015) derived metallicities for about 80 M giants in the NSC observed at low resolution (R ' 5000) with Gemini-North’s Near-Infrared Integral Field Spectrometer (NIFS). Their Bayesian analysis reported a wide range in derived metallici-ties, extending to+0.96 dex, and with 6% of their sample having [Fe/H] < −0.5. However, their abundances can be considered to be only estimates, as they also reported log g > 3 for most of their sample.
Feldmeier-Krause et al. (2017) used a method similar to
Do et al. (2015), reporting approximate metallicities for 700 M giants in the vicintiy of the NSC, using VLT-KMOS spec-troscopy at R = 4000. They also reported a suprasolar metallic-ity and a metal poor fraction similar to that ofDo et al.(2015).
Nogueras-Lara et al. (2018b) used a purely photometric result and fitted luminosity functions to their deep photometric data in the inner bulge with α − enhanced BASTI isochrones and found that an old stellar population with Z = 0.04 giving a [Fe/H]= 0.18 dex provides the best fit.
One of the first detailed abundance analyses in the GC using K-band, high-resolution the CRyogenic high-resolution InfraRed Echelle Spectrograph (CRIRES) at the ESO Very Large Telescope (VLT) spectra were obtained by Ryde & Schultheis
(2015). They analyzed spectra of nine field giants in the vicin-ity of the NSC, finding a narrow metallicvicin-ity distribution with [Fe/H]= +0.11 ± 0.15 dex, in good agreement withCunha et al.
(2007). Their α-element abundances are found to be low, follow-ing the trends from studies in the outer bulge, and resemblfollow-ing a bar-like population. A refined analysis (Nandakumar et al. 2018) gives a slighter higher mean metallicity of [Fe/H] = +0.3 ± 0.10 dex and confirms the very narrow distribution.
Ryde et al.(2016a) presented an abundance study of 28 M giants in fields located within a few degrees south of the GC using high-resolution (R ∼ 50 000) spectra. They found a wide range of metallicities that narrows towards the center and con-firmed the Rich et al. (2012) study that found alpha enhance-ment throughout the inner bulge. This would be consistent with a homogeneous enrichment history in the inner bulge.
Very recently, new and more massive samples of chemi-cal abundances from the APOGEE and GIRAFFE Inner Bulge Survey (GIBS) surveys, as well as from high-resolution spec-troscopy at Keck and VLT became available. In Sect. 2 we describe this new data set of chemical abundances and in the Sects. 3–5 we will used this dataset to constrain the chemical enrichment of the inner bulge and GC region.
2. Recent spectroscopy in the inner bulge and in the Galactic Center region 2.1. Samples
Rich et al.(2017) measured metallicities for 17 M giants in the NSC. Membership of those stars is based on detailed extinc-tion measurements as well as on kinematics, meaning proper motions, radial velocities, and orbit calculations. Below, we refer to this sample as R17.
Feldmeier-Krause et al. (2017) used full spectral fitting to derive effective temperatures and metallicities for more than 700 M giant stars. They found a significant fraction of metal-poor
Table 1. Spectroscopic samples used in this analysis.
Dataset (l, b) N R ∆λ (µm) Type R17 (0, 0) 17 24 000 2.11–2.40 M giants N18 (0, 0) 9 50 000 2.08–2.14 M giants – (0, ±1) 23 – – – – (0, ±2) 24 – – – – (0, 3) 15 – – – Za19 (±0.2, ±1) 13 22 500 1.50–1.70 M giants – (±0.2, ±2) 58 – – – – (±0.2, ±3) 35 – – – Zo17 (0, –1) 432 6500 0.82–0.94 RC stars – (0, –2) 432 – – – FK17 (0, 0) 706 4000 1.93–2.46 M giants Notes. The first column gives the reference, the second column the cen-tral coordinates in galactic longitudes and latitudes, the third column the number of used stars, the fourth column the spectral resolution, the fifth column the corresponding wavelength range in µm, and the last column the tracer of the stellar population used.
stars and found also a significant amount of super metal-rich stars with [Fe/H] > 0.5, somewhat ruling out the scenario that the NSC could be entirely formed from the infalling of globular clusters. However, as they mentioned, these extremely metal-rich stars should be regarded with caution. We refer to this sample as FK17.
In the APOGEE DR12 bulge sample García Pérez et al.
(2018) identified more than two components in the metallicity distribution by arranging the red giant stars according to their projected Galactocentric distance and distance from the Galactic mid-plane.Fragkoudi et al.(2018) used the metallicities derived from the APOGEE DR13 to compare the observed metallicity distribution function (MDF) with that obtained from N-body simulations of a composite (thin+thick) stellar disk.
Zasowski et al.(2019) presented chemical abundances of M giant stars from the latest APOGEE DR14, in the inner three degrees. We selected stars along the minor axis (l= ±0.2◦) and
at galactic latitudes (±1◦, ±2◦, and ±3◦). Henceforth, we refer to this sample as Za19.
Zoccali et al. (2017) derived metallicities for 432 stars at b = −2◦ and b = −1◦ from the GIBS survey, using the
opti-cal Ca IR triplet method. They found evidence for a bimodal MDF. Using a similar definition of metal rich being suprasolar, and metal poor being subsolar, they argue that the metal rich population is flattened and concentrated toward the plane, while the metal poor component is spheroidal. Henceforth, we refer to this sample as Zo17.
Nandakumar et al. (2018) measured chemical abundances for 71 giant stars in the inner two degrees. We want to emphasize that the stars in the GC field are stars surrounding the NSC and are not members of the NSC. These chemical abundances were obtained by an homogeneous reanalysis of the high-resolution K-band spectra ofRyde et al. (2015, 2016a). Surface gravities have been obtained in an iterative way (with respect to Teff and
[Fe/H]) by placing them on stellar isochrones. The new K-band line list (Thorsbro et al. 2018) was also used. Henceforth, we refer to this sample as N18. Table1shows the summary of the spectroscopic data set we used in our analysis together with the information about the central coordinates of the samples, the number of stars, the spectral resolution, the wavelength range, as well as the main tracer of the population (e.g., M giants, RC stars).
A&A 627, A152 (2019) Table 2. Derived temperature, gravity, and metallicity for a test giant
star common to different studies.
Do et al.(2015) FK17 This work
Teff 3558 ± 414 K 3479 ± 229 K 3200 ± 200 K
log g 3.0 ± 0.91 0.1 ± 1.0 0.3 ± 0.3 [Fe/H] 0.80 ± 0.32 0.3 ± 0.33 0.2 ± 0.2
2.2. Caveats about chemical abundances from high- and low-resolution spectra
There is a general debate on whether and eventually how chem-ical abundances from low-resolution spectra (R ≤ 5000) can be compared with those from medium (R ∼ 10 000) and high-resolution (R ≥ 20 000). In the inner two degrees of the Milky Way that issue is even more critical, given that we are often deal-ing with metal-rich, cool giants suffering from substantial molec-ular lines in their spectra, with temperatures well below 4500 K and log g < 2. Appearance of molecular lines and consequent line blending and blanketing, saturation, inaccurate line lists, uncertainties in stellar parameters, etc. can severely affect the derived chemical abundances of M giants (see e.g., Ryde et al. 2016a;Nandakumar et al. 2018). In addition to all of these prob-lems, some lines are strongly temperature-sensitive due to ion-ization issues and hyperfine splitting (Thorsbro et al. 2018).
In order to provide a first check of the possible mismatch among stellar parameters obtained form spectra at different res-olutions, on 30 July 2017 at Keck II, we obtained a high-resolution (R ∼ 23 000) K-band spectrum of the star Nr. 44 from FK17, that is also studied inDo et al.(2015). The star is at (RA, Dec)= (266.42050◦, −29.006775◦) using epoch J2000 and
it has Ks= 10.4 mag. We use the Spectroscopy Made Easy code
for spectral synthesis (Valenti & Piskunov 1996; Valenti 2012) and the MARCS model atmospheres (Gustafsson et al. 2008) in spherical geometry.
Table2 shows our best-fit stellar parameters and metallic-ity together with the corresponding values found by Do et al.
(2015) and FK17. Our values of the stellar parameters and metal-licity for this star are in reasonable agreement with those of FK17 within the uncertainties, while both gravity and [Fe/H] by
Do et al.(2015) seem improbably large. For this reason, as well as the previously mentioned issue with unphysical gravities and extreme metallicities, we choose to exclude the R= 5000 sample ofDo et al.(2015) from our analysis.
3. Metallicity distribution function
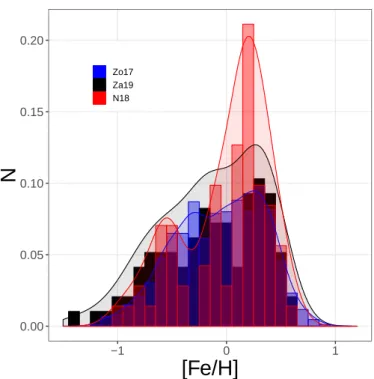
By using the state-of-the-art metallicity samples described in Sect. 2, we computed the MDF in the inner two degrees of the Milky Way bulge. Figure2 shows the individual MDFs of Zo17, Za19, and N18, respectively. Their median metallicity is −0.04, −0.06, and 0.04 dex, respectively with a typical rms of 0.4 dex, showing that individual MDFs are comparable. In order to maximize the statistical significance of each distribution, we merged the Zo17, N18, and Za19 samples in the inner bulge fields, which is shown in Fig.3. We refer to this as the “merged sample”.
Figure 3 shows also the normalized MDFs for the inner bulge fields at b = ±2◦ and b = ±1◦ (upper panel), for the GC (middle panel), and for the NSC (bottom panel). The MDF of the inner bulge fields (that is Zo17, N18, and Za19) is very broad, with some evidence of bimodality as is the
0.00 0.05 0.10 0.15 0.20 −1 0 1
[Fe/H]
N
Zo17 Za19 N18Fig. 2. Normalized Metallicity Distribution Function of M giants between individual samples of Za19 (black), Zo17 (blue), and N18 (red). A kernel density estimation for each of the three samples with a bin size of 0.1 dex is overplotted as a solid line.
case for bulge fields at higher galactic latitudes (e.g., BW). However the two peaks at super-solar and sub-solar metallic-ity are less pronounced in the inner bulge merged sample. The MDF in the GC is narrow with a single peak at super-solar metallicity and no metal-poor stars. We want to stress that the GC sample consists of only nine stars and a larger sample is clearly needed before ruling out the presence of metal-poor stars. Future large surveys in the IR such as MOONS at the ESO/VLT (Cirasuolo & MOONS Consortium 2016) will defi-nitely increase the sample by at least one order of magnitude. The MDF in the NSC is comparable to the GC but broader, with a tail toward subsolar metallicities. In R17 the metal-poor tail is less extended than in FK17 but the sample size of R17 is too small to do a more detailed quantitative analysis. In order to merge the R17 and the FK17 samples, we performed Monte-Carlo simulations where from the FK17 sample we randomly extracted 17 stars (which is the sample size of R17) 10 000 times. The resulting mean and standard deviation of the extracted samples are within 0.05 dex in [Fe/H] of the full R17 sample. In the following we refer to the GC and the NSC as the GC region.
The most striking difference between the MDF in the inner bulge and in the GC region is the larger population of metal-poor stars in the former. This difference is significant. Indeed, a statistical KS-test gives a p-value of 0.02, indicating that these two distributions do not belong to the same popula-tion. Such a difference would favor a scenario of an in-situ formation of the NSC. However, infall of complex stellar systems such as Terzan 5 (Origlia et al. 2013, 2019) with major age and metallicity spreads or genuine globular clus-ters (Capuzzo-Dolcetta & Miocchi 2008;Tsatsi et al. 2017) can-not be fully ruled out as possible contributors. In the latter case, chemical footprints of dispersion in light elements (Schiavon et al. 2017) should be detected, and chemical abun-dances for these metals are urgently needed.
|b|=1, |b|=2 0.00 0.05 0.10 0.15 −1 0 1 [Fe/H] N |b|=1, N18+Za19+Zo17 |b|=2, N18+Za19+Zo17 GC 0.0 0.1 0.2 0.3 0.4 −1 0 1 [Fe/H] N GC, N18 NSC 0.00 0.05 0.10 0.15 0.20 −1 0 1 [Fe/H] N R17 FK17
Fig. 3. Normalized Metallicity Distribution Function of M giants in inner two degrees. Upper panel: distributions at |b| = 1 deg and |b| = 2 deg from Zo17, N18, and Za19. Middle panel: same for the GC field from N18, and lower panel: for the NSC from FK17 and R17. A ker-nel density estimation with a bin size of 0.1 dex is also overplotted as a solid line.
4. Metallicity gradients
In order to consistently trace possible vertical and radial gra-dients in the Galactic bulge, it is important to quantify the rela-tive contribution of the supersolar, metal-rich (hereafter MR) and the subsolar, metal-poor (hearafter MP) stars. Indeed, when the MDFs are complex as in the Galactic bulge, a straightforward average value is not always appropriate to describe the metal content of the sampled stellar population at a given distance from the GC.
We thus divided each sample described in Sect. 2 into two components: the MR with [Fe/H] > 0 and the MP with [Fe/H] < 0, followingZoccali et al.(2017). Then we computed the number ratio of MR to MP stars and their average metal-licities. We verified that slightly different (by ±0.2 dex from [Fe/H]= 0.0) assumptions to separate MR and MP stars do not significantly affect the results. In this respect,Nandakumar et al.
(2017) already demonstrated that the effect of the selection func-tion plays a minor role in MDF studies.
4.1. The vertical metallicity gradient
By using the same state-of-the-art metallicity samples as for the MDFs, we derived number ratios of MR to MP stars and their average metallicities, and we investigate their behavior as a func-tion of the distance (z) from the Galactic plane. Here for the merged sample at z = 0 we used the data set of R17, FK17, and the stars at the GC from N18. For the merged sample of |b| = 1◦, |b|= 2◦, and |b|= 3◦, we used the corresponding data
sets of N18, Za18, and Zo17 as described in Sect. 3. Figure4
shows the fraction of MR to MP stars with varying z. For com-parison we also included the corresponding values at b= ±3 deg fromNandakumar et al.(2018) andZasowski et al.(2019), and
Fig. 4.Fraction of MR ([Fe/H] > 0) to MP stars ([Fe/H < 0) as a function of vertical distance for considered samples of stars. Errorbars have been computed as∆ f = f × p(1 + f )/MR, where f is the number ratio of MR to MP stars and MR is the number of MR stars.
in BW fromSchultheis et al.(2017). The fraction of MR to MP stars for |b| ≥ 1◦(corresponding to z= 0.14 kpc) out to the BW at
z= 0.57 kpc turns out to be rather constant around the value of 1, suggesting an almost equal fraction of MR and MP stars (see also
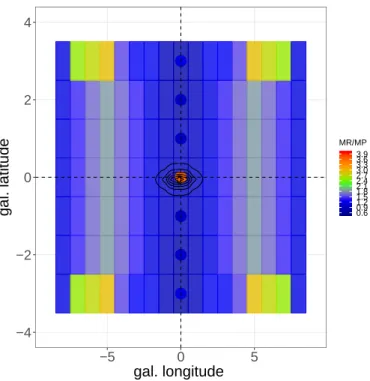
Zoccali et al. 2017). At variance, in the GC region the MR/MP number ratio significantly increases up to a value of about 3.6, indicating a dominance of the MR component. Figure5 shows the map of the MR/MP number ratio in the innermost bulge region while in Table 3 we list the fraction of MR/MP stars for each field. For comparison we also show the ratio of MR to MP stars fromZoccali et al.(2018) based on the GIBS data (see their Table 1) but confined to |b| ≤ 3◦. The distribution is rather flat, with values ranging between 0.8 and 1.2 with a spike in the GC region. In Fig.5, we superimpose the stellar mass dis-tribution of the nuclear disk fromLaunhardt et al.(2002) where our metallicity peak corresponds with the concentration of the mass within the nuclear disk/NSC. Subsequent studies all con-firm the extreme concentration of stellar mass in the nuclear disk and the NSC (e.g.,Fritz et al. 2016). Interestingly enough, the individual samples and the merged ones (i.e., FK17+R17 in the GC region, N18+Za19+Zo17 in the b = ±1 and b = ±2 fields, and N18+Za19 in the b = ±3 field) show similar MR/MP number ratios, despite their different spectral resolution, line diagnostics, and statistical significance. This suggests that the merged samples, meaning those with the highest statistical significance, can be safely used to trace possible metallicity vari-ations. Our finding that different spectral resolution and line diagnostics provide similar results is not surprising, given that we are simply considering two broad metallicity categories (i.e., MR and MP).
Figure 6 shows the median metallicities for the individual MR and MP components as well as for the global metallic-ity, as a function of z. We only used the merged samples since they are statistically more significant and we performed a lin-ear, square fit to the data points. The coefficients are reported in Table4. Very small positive slopes in the inner bulge fields (thus
A&A 627, A152 (2019) ● ● ● ● ● ● ● −4 −2 0 2 4 −5 0 5 gal. longitude gal. latitude 0.60.9 1.2 1.5 1.8 2.1 2.4 2.7 3.0 3.3 3.6 3.9 MR/MP
Fig. 5.Fraction of metal-rich to metal-poor stars (filled circles) super-imposed by fraction of MR to MP stars fromZoccali et al.(2018, their Table 1). The black contours show the surface brightness map of the best-fit model of the “nuclear bulge” component by Launhardt et al.
(2002).
Table 3. Ratio of MR to MP stars for each spectroscopic sample and each merge sample.
Data set (l, b) Ratio (MR/MP) σ(MR/MP)
FK17 (0, 0) 3.61 0.30 FK17+R17+N18 (0, 0) 3.63 0.33 N18 (0, ±1) 1.87 0.82 N18 (0, ±2) 1.00 0.41 N18 (0, 3) 1.14 0.59 Zo17 (0, –1) 0.85 0.08 Zo17 (0, –2) 0.95 0.09 Za19 (±0.2, ±1) 0.86 0.48 Za19 (±0.2, ±2) 0.76 0.20 Za19 (±0.2, ±3) 1.17 0.46 N18+Zo17+Za19 (0, ±1) 0.89 0.82 N18+Zo17+Za19 (0, ±2) 0.93 0.41 N18+Za19 (0, ±3) 0.86 0.59 BW (1, −4) 0.92 0.11
Notes. Errorbars have been computed as ∆ f = f × p(1 + f )/MR, where f is the number ratio of MR to MP stars and MR is the number of MR stars.
excluding the GC region) are obtained, the highest value for the MP component, indicating that the mild (if any) positive gradi-ent is mostly due to the decrease of the median metallicity of the MP component moving outwards. At variance, if the GC region is included, slopes become negative and the mild negative gra-dients are practically due to the high median metallicity of the dominant MR population in the GC region. Interestingly, all the slopes in Table4are consistent with flat distributions at ≤1.5σ level.
Fig. 6. Vertical metallicity gradient in inner bulge and GC region. Shown are results for MR (red dots), MP (blue dots), and all the stars together (black dots) from the merged samples of FK17+R17 in the GC region, N18+Za19+Zo17 in the b = ±1◦
and b= ±2◦fields, N18+Za19
in the b = ±3◦ field, and results fromSchultheis et al.(2017) in the
BW. Errorbars refer to 1σ dispersions. Dotted lines show the linear fit including the GC region, while the solid lines show the fit omitting the GC region.
Table 4. Linear fitting (i.e., y= a1 ∗ x + a0) parameters and 1σ disper-sions for vertical metallicity gradient.
Fit All AllB MRall MPall MRB MPB
a0 0.099 −0.042 0.345 −0.281 0.254 −0.367 σa0 0.069 0.023 0.059 0.061 0.073 0.085
a1 −0.270 0.057 −0.179 −0.061 0.031 0.136 σa1 0.198 0.058 0.165 0.174 0.182 0.212
rms 0.09 0.03 0.08 0.07 0.06 0.07 Notes. The overall rms of the residuals is given in the last row. The second column (All) shows the parameters for the full sample, the third one (AllB) for the full sample in the inner bulge without the GC, the fourth and fifth ones for the MR and the MP sub-samples including the GC, and columns six and seven for the MR and MP populations in the inner bulge without the GC.
4.2. The radial metallicity gradient
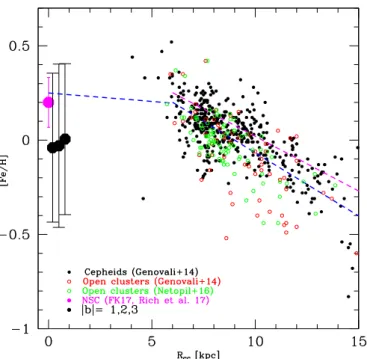
The radial metallicity gradient is an important constraint on the chemical evolution for the Milky Way and external galax-ies. Figure7 shows the mean metallicity for open clusters and Cepheids in the range 5 < RGC < 15 kpc by Genovali et al.
(2014) and Netopil et al. (2016) as a function of the Galacto-centric distance and the fitting relations based on observations of field giant stars byHayden et al.(2014) andAnders et al.(2017). For comparison, mean metallicities for the GC region and the inner bulge fields as discussed in this paper are also reported. There is clear evidence that the extrapolation of the radial gradi-ent inferred at large Galactocgradi-entric distances to the cgradi-enter would result in a metallicity exceeding the measured central value by A152, page 6 of9
Fig. 7.Radial gradient close to Galactic plane. Shown are data as traced by Cepheids (black dots fromGenovali et al. 2014), open clusters (red circles fromGenovali et al. 2014and green circles fromNetopil et al. 2016), and big magenta and black dots are the average metallicities for the GC region and |b| = 1, 2, 3 deg inner bulge fields discussed in this work. Errorbars refer to 1σ dispersions. The blue, dashed line indicates the relation noted byHayden et al. (2014) for a large sam-ple of APOGEE M giant stars covering a wide range of Galactocen-tric distances. The magenta dashed line indicates the relation found byAnders et al.(2017) for red giant stars with well-determined astero-seismological parameters.
∼0.6 dex. All the measurements in the inner bulge and in the GC region indicate average metallicities between solar and twice solar at most. As already speculated byHayden et al.(2014), this flattening might arise due to the mixing of the stars in the pres-ence of the galactic bar.
5. Alpha-element abundances
In order to determine individual abundances, high-spectral reso-lution (R > 20 000) is necessary. Indeed, very few studies exist in the inner two degrees on detailed chemical abundances of alpha-elements in the bulge low-latitude fields.Rich et al.(2007) did the first detailed chemical abundance analysis and found a rather homogeneous α-enhancement of ∼0.3 dex up to solar metallicity for a sample of 17 M giants located at (l, b)= (0, −1). In a simi-lar studyRich et al.(2012) extended this work to two more fields finding the same average α-element enhancement of ∼0.3 dex. Also, the study of the metal-poor stars in the NSC ([Fe/H] ∼ −1) found byRyde et al.(2016b), shows an α-enhancement of ∼0.4 dex.
Figure8shows the [Mg/Fe] and [Si/Fe] abundance ratios as a function of [Fe/H] as obtained byNandakumar et al.(2018) in the central two degrees and byZasowski et al.(2019) using the latest APOGEE Data Release 14 of bulge chemical abundances. However, we see that the APOGEE [Mg/Fe] and [Si/Fe] abun-dances level off approximately above solar metallicity, while our α-abundances continue decreasing with increasing metallicity.
Matteucci et al.(2019) reproduces this flattening by artificially increasing the Mg produced by Type Ia supernovae by a factor of ten. However, we believe that this flattening is unphysical,
and results from an artifact in the analysis of metal-rich, cool M giants.
In the |b|= 1◦and |b|= 2◦fields we observe a general decline of the [Mg/Fe] abundance ratio with increasing metallicity down to roughly solar-scaled [Mg/Fe] at super-solar [Fe/H], similar to that found by APOGEE, though with larger scatter. The [Si/Fe] distributions tend to be systematically lower (by 0.1–0.2 dex) than APOGEE, especially at [Fe/H] > −0.5 dex. The GC dis-tributions follow those of the |b|= 1◦and |b|= 2◦fields at
super-solar [Fe/H]. However, we want to stress that the GC sample is very small and clearly more observations are necessary for a more quantitative comparison.
6. Discussion and conclusions
Based on high- and low-resolution spectroscopic observations of giant stars located in the inner two degrees of the galactic bulge, we find evidence of a dominant population of metal-rich stars in the GC region, leading to an average metallicity of+0.2 dex. Moving outward from the GC, in the central 600 pc we find that the ratio of meta-rich to metal-poor stars is constant, with no evidence of vertical abundance gradients, confirming on a more robust statistical basis the previous work ofRamírez et al.
(2000b),Rich et al.(2007,2012), andBabusiaux et al.(2014). The GC region hosts a complex stellar population with a large spread in age and chemical content that significantly differs from the bulge stellar population in the inner 600 pc. Hence, in order to properly assess the possible presence of ver-tical or radial gradients in the bulge and inner disk, the GC region should be excluded. Interestingly, the vertical metallicity gradient of about −0.3 dex kpc−1 (Rojas-Arriagada et al. 2017;
Gonzalez et al. 2013) measured at galactic latitudes b ≥ 4◦
also holds in the inner 600 pc though only if the GC region is included; a proper measurement of the gradient should not con-sider the GC region.
We can thus confidently state that the metallicity distribu-tion in the inner 600 pc of the Galactic bulge is rather homoge-neous. Only the innermost ∼10 pc shows an overall higher mean metallicity, suggesting that the GC region is a very peculiar envi-ronment with a large concentration of MR stars, perhaps arising from the retention of metal-rich gas by the potential well of the NSC. It is worth noting that also the radial metallicity gradient observed in the disk at Galactocentric distances >6 kpc does not extrapolate when moving inwards toward the low-latitude bulge fields and the GC region.
There have been various mechanisms proposed to explain the origin of the vertical metallicity gradient of the MW bulge. It was originally thought that a dispersion-dominated classical bulge/spheroid was the only possible explanation for the ver-tical metallicity gradient (e.g. Zoccali et al. 2008). However, other studies have shown that the redistribution of stars by a bar and a boxy peanut bulge can also produce a vertical metal-licity gradient (see for example Martinez-Valpuesta & Gerhard 2013; Di Matteo et al. 2014). Fragkoudi et al. (2017) showed that while such models can indeed reproduce the vertical metal-licity gradient, they do not reproduce a number of other trends seen in the MW bulge and inner disk, such as the metal-poor stars in innermost regions and the positive longitudinal gradient. Very few chemical evolution models exist in the inner two degrees. Grieco et al. (2015) studied the chemical evolu-tion of the central region and concluded that the stars in the GC formed very rapidly (0.1–0.7 Gyr) with high star forma-tion efficiency (25 Gyr−1) and a top-heavy initial mass function.
A&A 627, A152 (2019)
Fig. 8.[Mg/Fe] vs. [Fe/H] (left panel) and [Si/Fe] vs. [Fe/H] (right panel) trends in inner bulge and GC regions.
massive centrally concentrated thick disk that evolves in forming a bar and a boxy/peanut bulge to find a remarkably good agree-ment with the metallicity distribution functions of APOGEE. They predict a gradient of −0.10 dex kpc−1for the inner 500 pc. However, this model is a simple, closed-box model that does not include star formation and stellar feedback processes nor any gaseous physics. The presence of RR Lyrae stars in the NSC (Dong et al. 2017) favors at least a non-negligible portion of the population being ∼10 Gyr or older, a point that is also made by
Nogueras-Lara et al.(2018b).
Our evidence for a high metallicity peak in the GC might plausibly be explained by a rapid in-situ star formation event in an enriched gas environment, which might have involved coevo-lution of the super massive black hole growth and the NSC. The formation of multiple stellar populations in the NSC might well be problematic due to the unique environment of SgrA* (e.g., a strong tidal field from the SMBH) and also at some point in its history would have included substantial AGN activity. Further, high energy phenomena are observed at the present day, includ-ing magnetic fields and outflows of hot gas (Ponti et al. 2019). It is possible that the conditions that produced the supermassive black hole arose at the same time vigorous star formation was building the NSC, leaving the fossil remnant of high metallicity that we observe today. However, the strong tidal fields near Sgr A* remain as an unsolved challenge to explaining star formation, also known as the so-called paradox of youth (Ghez et al. 2003). An attractive idea is to attribute the observed high metallicity spike to enhanced star formation rates in AGN hosts compared to non-AGN that appear to be the case (Santini et al. 2012) so they appear more pronounced for high luminosity AGNs. On the other hand, Stanley et al.(2015) found no evidence of a corre-lation between star formation rate and AGN activity across all AGN luminosities.
It would be valuable to test this hypothesis by measuring the star formation history and metallicity of other NSCs, per-haps spanning a range in black hole mass. It is also important to use the next generation of facilities to constrain in greater detail the star formation of the NSC and surrounding nuclear disk and bulge population.
We have exploited the high luminosities of late M giants to permit the investigation of the NSC using the current gen-eration of instrumentation. Spectrographs coming online in the near future, such as CRIRES+ or MOONS at the VLT, and, later on HIRES, HARMONI, and MOSAIC at the ELT, will allow a deeper exploration of this region that may eventually include the red clump stars. The NSC offers our best opportunity to explore the coevolution of a stellar population and a supermassive black hole; such studies will be of great interest in the next decade.
Acknowledgements. We want to thank the referee E. Valenti for her very con-structive comments. We want to thank F. Fragkoudi and A. Mastrobueno-Battisti for very fruitful discussions. M.S. acknowledges the Programme National de Cosmologie et Galaxies (PNCG) of CNRS/INSU, France, for financial support. N.R. acknowledge support from the Swedish Research Council, VR (project number 621-2014-5640), funds from Kungl. Fysiografiska Sällskapet i Lund. (Stiftelsen Walter Gyllenbergs fond and Märta och Erik Holmbergs donation), the project grant “The New Milky” from the Knut and Alice Wallenberg foun-dation, and support from the Crafoord Founfoun-dation, and Stiftelsen Olle Engkvist Byggmästare. Some of the data presented herein were obtained at the W. M. Keck Observatory, which is operated as a scientific partnership among the California Institute of Technology, the University of California, and the National Aeronautics and Space Administration. The Observatory was made possible by the generous financial support of the W. M. Keck Foundation. The authors wish to recognize and acknowledge the very significant cultural role and reverence that the summit of Mauna Kea has always had within the indigenous Hawaiian community. We are most fortunate to have the opportunity to conduct observa-tions from this mountain.
References
Anders, F., Chiappini, C., Minchev, I., et al. 2017,A&A, 600, A70
Antonini, F. 2013,ApJ, 763, 62
Babusiaux, C., Katz, D., Hill, V., et al. 2014,A&A, 563, A15
Barbuy, B., Chiappini, C., & Gerhard, O. 2018,ARA&A, 56, 223
Capuzzo-Dolcetta, R. 1993,ApJ, 415, 616
Capuzzo-Dolcetta, R., & Miocchi, P. 2008,ApJ, 681, 1136
Carr, J. S., Sellgren, K., & Balachandran, S. C. 2000,ApJ, 530, 307
Cirasuolo, M. & MOONS Consortium 2016, in Multi-Object Spectroscopy in the Next Decade: Big Questions, Large Surveys, and Wide Fields, eds. I. Skillen, M. Balcells, & S. Trager,ASP Conf. Ser., 507, 109
Cunha, K., & Smith, V. V. 2006,ApJ, 651, 491
Cunha, K., Sellgren, K., Smith, V. V., et al. 2007,ApJ, 669, 1011 A152, page 8 of9
Di Matteo, P., Haywood, M., Gómez, A., et al. 2014,A&A, 567, A122
Do, T., Kerzendorf, W., Winsor, N., et al. 2015,ApJ, 809, 143
Dong, H., Schödel, R., Williams, B. F., et al. 2017,MNRAS, 471, 3617
Feldmeier, A., Neumayer, N., Seth, A., et al. 2014,A&A, 570, A2
Feldmeier-Krause, A., Kerzendorf, W., Neumayer, N., et al. 2017,MNRAS, 464, 194
Fragkoudi, F., Di Matteo, P., Haywood, M., et al. 2017,A&A, 606, A47
Fragkoudi, F., Di Matteo, P., Haywood, M., et al. 2018,A&A, 616, A180
Fritz, T. K., Gillessen, S., Dodds-Eden, K., et al. 2011,ApJ, 737, 73
Fritz, T. K., Chatzopoulos, S., Gerhard, O., et al. 2016,ApJ, 821, 44
García Pérez, A. E., Ness, M., Robin, A. C., et al. 2018,ApJ, 852, 91
Genovali, K., Lemasle, B., Bono, G., et al. 2014,A&A, 566, A37
Genzel, R., Eisenhauer, F., & Gillessen, S. 2010, Rev. Mod. Phys., 82, 3121
Ghez, A. M., Duchêne, G., Matthews, K., et al. 2003,ApJ, 586, L127
Gnedin, O. Y., Ostriker, J. P., & Tremaine, S. 2014,ApJ, 785, 71
Gonzalez, O. A., Rejkuba, M., Zoccali, M., et al. 2012,A&A, 543, A13
Gonzalez, O. A., Rejkuba, M., Zoccali, M., et al. 2013,A&A, 552, A110
Grieco, V., Matteucci, F., Ryde, N., Schultheis, M., & Uttenthaler, S. 2015,
MNRAS, 450, 2094
Gustafsson, B., Edvardsson, B., Eriksson, K., et al. 2008,A&A, 486, 951
Hayden, M. R., Holtzman, J. A., Bovy, J., et al. 2014,AJ, 147, 116
Karim, M. T., & Mamajek, E. E. 2017,MNRAS, 465, 472
Launhardt, R., Zylka, R., & Mezger, P. G. 2002,A&A, 384, 112
Majewski, S. R., Schiavon, R. P., Frinchaboy, P. M., et al. 2017,AJ, 154, 94
Martinez-Valpuesta, I., & Gerhard, O. 2013,ApJ, 766, L3
Matteucci, F., Grisoni, V., Spitoni, E., et al. 2019,MNRAS, 487, 5363
McLean, I. S. 2005, inHigh Resolution Infrared Spectroscopy in Astronomy, eds. H. U. Käufl, R. Siebenmorgen, & A. F. M. Moorwood, 25
Milosavljevi´c, M. 2004,ApJ, 605, L13
Nandakumar, G., Schultheis, M., Hayden, M., et al. 2017,A&A, 606, A97
Nandakumar, G., Ryde, N., Schultheis, M., et al. 2018,MNRAS, 478, 4374
Netopil, M., Paunzen, E., Heiter, U., & Soubiran, C. 2016,A&A, 585, A150
Neumayer, N. 2017, in Formation, Evolution, and Survival of Massive Star Clusters, eds. C. Charbonnel, & A. Nota,IAU Symp., 316, 84
Nogueras-Lara, F., Gallego-Calvente, A. T., Dong, H., et al. 2018a,A&A, 610, A83
Nogueras-Lara, F., Schödel, R., Dong, H., et al. 2018b,A&A, 620, A83
Origlia, L. 2014, in Setting the scene for Gaia and LAMOST, eds. S. Feltzing, G. Zhao, N. A. Walton, & P. Whitelock,IAU Symp., 298, 28
Origlia, L., Massari, D., Rich, R. M., et al. 2013,ApJ, 779, L5
Origlia, L., Mucciarelli, A., Fiorentino, G., et al. 2019,ApJ, 871, 114
Pflamm-Altenburg, J., & Kroupa, P. 2009,MNRAS, 397, 488
Ponti, G., Hofmann, F., Churazov, E., et al. 2019,Nature, 567, 347
Ramírez, S. V., Sellgren, K., Carr, J. S., et al. 2000a,ApJ, 537, 205
Ramírez, S. V., Stephens, A. W., Frogel, J. A., & DePoy, D. L. 2000b,AJ, 120, 833
Rich, R. M. 2013, inPlanets, Stars and Stellar Systems. Volume 5: Galactic Structure and Stellar Populations, eds. T. D. Oswalt, & G. Gilmore (Netherlands: Springer), 271
Rich, R. M., & Origlia, L. 2005,ApJ, 634, 1293
Rich, R. M., Origlia, L., & Valenti, E. 2007,ApJ, 665, L119
Rich, R. M., Origlia, L., & Valenti, E. 2012,ApJ, 746, 59
Rich, R. M., Ryde, N., Thorsbro, B., et al. 2017,AJ, 154, 239
Rojas-Arriagada, A., Recio-Blanco, A., de Laverny, P., et al. 2017,A&A, 601, A140
Ryde, N., & Schultheis, M. 2015,A&A, 573, A14
Ryde, N., Lambert, J., Farzone, M., et al. 2015,A&A, 573, A28
Ryde, N., Schultheis, M., Grieco, V., et al. 2016a,AJ, 151, 1
Ryde, N., Fritz, T. K., Rich, R. M., et al. 2016b,ApJ, 831, 40
Santini, P., Rosario, D. J., Shao, L., et al. 2012,A&A, 540, A109
Schiavon, R. P., Johnson, J. A., Frinchaboy, P. M., et al. 2017,MNRAS, 466, 1010
Schödel, R., Feldmeier, A., Kunneriath, D., et al. 2014,A&A, 566, A47
Schultheis, M., Sellgren, K., Ramírez, S., et al. 2009,A&A, 495, 157
Schultheis, M., Chen, B. Q., Jiang, B. W., et al. 2014,A&A, 566, A120
Schultheis, M., Cunha, K., Zasowski, G., et al. 2015,A&A, 584, A45
Schultheis, M., Rojas-Arriagada, A., García Pérez, A. E., et al. 2017,A&A, 600, A14
Seth, A. C., Blum, R. D., Bastian, N., Caldwell, N., & Debattista, V. P. 2008,
ApJ, 687, 997
Stanley, F., Harrison, C. M., Alexander, D. M., et al. 2015,MNRAS, 453, 591
Thorsbro, B., Ryde, N., Schultheis, M., et al. 2018,ApJ, 866, 52
Trapp, A. C., Rich, R. M., Morris, M. R., et al. 2018,ApJ, 861, 75
Tremaine, S. D., Ostriker, J. P., & Spitzer, Jr., L. 1975,ApJ, 196, 407
Tsatsi, A., Mastrobuono-Battisti, A., van de Ven, G., et al. 2017,MNRAS, 464, 3720
Valenti, J. A., & Piskunov, N. 1996,A&AS, 118, 595
Valenti, J. A. 2012, Astrophysics Source Code Library [record ascl:1202.013] Zasowski, G., Schultheis, M., Hasselquist, S., et al. 2019,ApJ, 870, 138
Zoccali, M., Hill, V., Lecureur, A., et al. 2008,A&A, 486, 177
Zoccali, M., Vasquez, S., Gonzalez, O. A., et al. 2017,A&A, 599, A12

![Fig. 4. Fraction of MR ([Fe/H] > 0) to MP stars ([Fe/H < 0) as a function of vertical distance for considered samples of stars](https://thumb-eu.123doks.com/thumbv2/123doknet/13331700.401001/6.892.63.438.120.499/fraction-stars-function-vertical-distance-considered-samples-stars.webp)
![Fig. 8. [Mg/Fe] vs. [Fe/H] (left panel) and [Si/Fe] vs. [Fe/H] (right panel) trends in inner bulge and GC regions.](https://thumb-eu.123doks.com/thumbv2/123doknet/13331700.401001/9.892.69.825.119.483/fig-panel-right-panel-trends-inner-bulge-regions.webp)
