HAL Id: hal-02292304
https://hal.umontpellier.fr/hal-02292304
Submitted on 19 Sep 2019
HAL is a multi-disciplinary open access
archive for the deposit and dissemination of
sci-entific research documents, whether they are
pub-lished or not. The documents may come from
teaching and research institutions in France or
abroad, or from public or private research centers.
L’archive ouverte pluridisciplinaire HAL, est
destinée au dépôt et à la diffusion de documents
scientifiques de niveau recherche, publiés ou non,
émanant des établissements d’enseignement et de
recherche français ou étrangers, des laboratoires
publics ou privés.
Importance of RIP140 and LCoR Sub-Cellular
Localization for Their Association With Breast Cancer
Aggressiveness and Patient Survival
Sophie Sixou, Katharina Müller, Stéphan Jalaguier, Christina Kuhn, Nadia
Harbeck, Doris Mayr, Jutta Engel, Udo Jeschke, Nina Ditsch, Vincent
Cavaillès
To cite this version:
Sophie Sixou, Katharina Müller, Stéphan Jalaguier, Christina Kuhn, Nadia Harbeck, et al..
Im-portance of RIP140 and LCoR Sub-Cellular Localization for Their Association With Breast Cancer
Aggressiveness and Patient Survival. Translational Oncology, Elsevier, 2018, 11 (5), pp.1090-1096.
�10.1016/j.tranon.2018.06.006�. �hal-02292304�
Importance of RIP140 and LCoR
Sub-Cellular Localization for
Their Association With Breast
Cancer Aggressiveness and
Patient Survival
1Sophie Sixou*,†, 2, Katharina Müller*, 2,
Stéphan Jalaguier‡, Christina Kuhn*,
Nadia Harbeck§, Doris Mayr¶, Jutta Engel#,
Udo Jeschke*, Nina Ditsch**, 2and
Vincent Cavaillès‡, 2
*
Klinik und Poliklinik für Frauenheilkunde und Geburtshilfe, Campus Innenstadt, Klinikum der Ludwig-Maximilians-Universität, Maistrasse 11, D-80337 München, Germany;
†Université Paul Sabatier Toulouse III, Faculté des Sciences
Pharmaceutiques, F-31062 Toulouse cedex 09, France;
‡IRCM - Institut de Recherche en Cancérologie de
Montpellier, INSERM U1194, Université Montpellier, Parc Euromédecine, 208 rue des Apothicaires, F-34298
Montpellier Cedex 5, France;§Brustzentrum der Universität München, Klinik und Poliklinik für Frauenheilkunde und Geburtshilfe, Klinikum der Ludwig-Maximilians-Universität, Maistrasse 11, D-80337 München, Germany;¶Department of Pathology, Campus Innenstadt, Ludwig-Maximilians-University Hospital, Thalkirchner Str. 36, D-80337 Munich, Germany;#Tumorregister München (TRM) des
Tumorzentrums München (TZM) am Klinikum der Universität München (KUM), Marchionistraße 15, 81377 Munich, Germany;**Department of Obstetrics and Gynaecology, Campus Großhadern, Ludwig-Maximilians-University Hospital, Marchionistraße 15, 81377 Munich, Germany
Abstract
New markers are needed to improve diagnosis and to personalize treatments for patients with breast cancer (BC). Receptor-interacting protein of 140 kDa (RIP140) and ligand-dependent corepressor (LCoR), two transcriptional co-regulators of estrogen receptors, strongly interact in BC cells. Although their role in cancer progression has been outlined in the last few years, their function in BC has not been elucidated yet. In this study, we investigated RIP140 and LCoR localization (cytoplasm vs nucleus) in BC samples from a well-characterized cohort of patients (n = 320). RIP140 and LCoR were expressed in more than 80% of tumors, (predominantly in the cytoplasm), and the two markers were highly correlated. Expression of RIP140 and LCoR in the nucleus was negatively correlated with tumor size. Conversely, RIP140 and LCoR cytoplasmic expression strongly correlated with expression of two tumor aggressiveness markers: N-cadherin and CD133 (epithelial mesenchymal transition and cancer stem cell markers, respectively). Finally, high RIP140 nuclear expression was significantly correlated with longer overall survival, whereas high total or cytoplasmic expression of RIP140 was associated with shorter disease-free survival. Our study strongly suggests that the role of RIP140 and LCoR in BC progression could vary according to their
www.transonc.com
Address all correspondence to: Sophie Sixou, LMU and UPS, Klinik und Poliklinik für Frauenheilkunde und Geburtshilfe, Campus Innenstadt, Klinikum der Ludwig-Maximilians-Universität, Maistrasse 11, D-80337 München, Germany. or Vincent Cavaillès, IRCM - INSERM U1194, Parc Euromédecine, 208 rue des Apothicaires, F-34298 Montpellier Cedex 5, France. E-mail:sophie.doisneausixou@med.lmu.de
1
Funding: SS salary was supported by the University Paul Sabatier in Toulouse (France). The project was supported by the“Centre de Coopération Universitaire Franco-Bavarois” (CCUFB) or“Bayerisch-Französishes Hochschilzentrum” (BFHZ), Project funding FK19–15.
2
Should be considered as co-first or co-last authors.
Received 11 April 2018; Revised 13 June 2018; Accepted 15 June 2018
© 2018 The Authors. Published by Elsevier Inc. on behalf of Neoplasia Press, Inc. This is an open access article under the CC BY-NC-ND license ( http://creativecommons.org/licenses/by-nc-nd/4.0/).
1936-5233/18
prevalent sub-cellular localization, with opposite prognostic values for nuclear and cytoplasmic expression. The involvement in BC progression/invasiveness of cytoplasmic RIP140 could be balanced by the anti-tumor action of nuclear RIP140, thus explaining the previous contradictory findings about its role in BC.
Translational Oncology (2018)11, 1090–1096
Introduction
Breast cancer (BC) is the most frequent cancer and the leading cause
of mortality in women worldwide [1]. The involvement of nuclear
receptors in BC progression and aggressiveness is widely accepted. Human epidermal growth factor receptor 2 (HER2), estrogen receptor (ER) and progesterone receptor (PR) are key prognostic and predictive markers, and their expression is routinely determined in primary BCs[2]. Nuclear expression of ER/PR in tumor tissue is correlated with good outcome and an expected sensitivity to endocrine therapy, such as selective ER modulators (SERMs; e.g., tamoxifen). Conversely, HER2 expression is correlated with poor prognosis in untreated patients with BC and an expected sensitivity to
the humanized anti-HER2 antibody trastuzumab[3].
The main nuclear receptor activities are precisely regulated through complex and dynamic interactions of transcriptional co-regulators. Several families of coactivators and corepressors are involved in the development, progression, invasion, and therapy resistance of solid tumors, especially hormone-responsive cancers, such as breast, ovarian and prostate cancers[4,5]. Among the many nuclear receptor co-regulators, Receptor Interacting Protein of 140 kDa (RIP140), also called Nuclear Receptor Interacting Protein 1 (NRIP1), acts predominantly as a corepressor[6–9]through recruitment of histone deacetylase (HDAC) and C-terminal binding proteins (CtBPs)
[10,11]. RIP140 plays pivotal roles in normal cell metabolism, especially in lipid metabolism[12,13], and is required for ovulation
and mammary gland development[14]. RIP140 could also function
as a tumor suppressor in ovarian and colon cancer. Specifically, in ovarian cancer, RIP140 interacts mainly with ERβ and could be
involved in the repression of ERα activity by ERβ[15]. In colon
cancer, RIP140 inhibits cell proliferation through the Wnt signaling
pathway [16]. Similarly, it has been suggested that RIP140 is a
favorable prognostic marker in chronic lymphocytic leukemia[17]. In BC, RIP140 acts as a coactivator of ERα-responsive genes, and might regulate tumor progression and response to endocrine therapy [18]. On the other hand, RIP140 is the immediate downstream target of nucleolar protein 14 (NOP14), an RNA binding protein that acts as a tumor suppressor gene in BC through the Wnt/APC/βcatenin pathway[9]. Moreover, RIP140 is overexpressed in BC cell lines and tumors compared with normal breast cell lines and adjacent healthy tissues[7,9]. Importantly, RIP140 expression is higher in the nucleus of epithelial cells in malignant BC, whereas it is stronger in the cytoplasm of stromal cells in benign tumors[7].
We recently demonstrated that RIP140 directly interacts with Ligand-dependent CoRepressor (LCoR) and that the two proteins colocalize in the nucleus of human BC cells. RIP140 positively regulates LCoR expression and is necessary for LCoR-mediated inhibition of gene expression and cell proliferation in BC cells[19]. LCoR is a nuclear protein that interacts with ERα and the repressive activity of which is driven through HDAC and CtBPs recruitment, as
described for RIP140[20–22]. LCoR shows repressive activity in BC
cells [19,23], and also inhibits prostate cancer growth in murine
models[24]. Moreover, high RIP140 and LCoR mRNA expression
were associated with longer survival in a cohort of 183 patients with BC[19]. Very recently, a study confirmed the relevance of LCoR in BC by demonstrating that it inhibits mammary cancer stem cell (CSC) activity[25].
In this retrospective study, we wanted to determine the specific role of nuclear and cytoplasmic RIP140 and LCoR expression in BC. To this aim, we analyzed the tumor sub-cellular expression of these two transcriptional co-regulators in a cohort of 320 patients with BC, and evaluated the correlation with clinicopathological features and the expression of tumor aggressiveness markers.
Materials and Methods
Patient Characteristics
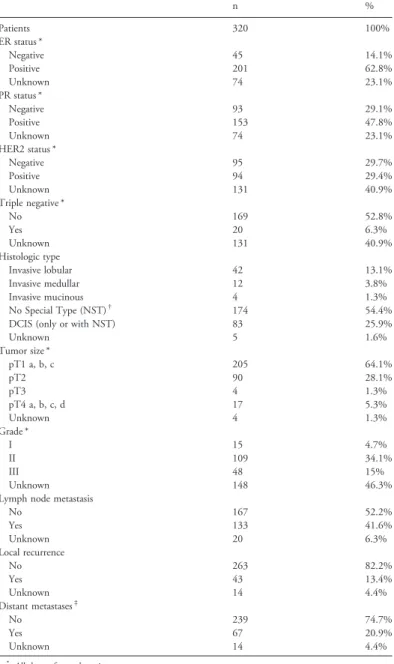
For this study, a well characterized collection of paraffin-embedded breast tumor tissue samples from 320 patients with BC was used. As only eight patients had metastatic BC at the time of diagnosis, the cohort was considered to be composed of patients with primary BC. The study was approved by the Ethics Committee of the Ludwig Maximilians University (LMU) of Munich, Germany (approval number 048–08). BC tissue samples were collected from patients treated for BC at the LMU Department of Obstetrics and Gynecology between 2000 and 2002. All tumors were classified using the tumor-node-metastasis (TNM) classification that includes the tumor size (primary tumor size, or pT, as defined in the TNM classification: pT1a-c, pT2, pT3, pT4a-d), the involvement of regional lymph nodes (N), and presence or absence of metastases (M). The BC histological grade was determined by an experienced pathologist (Dr D. Mayr) of the LMU Department of Pathology, according to the Elston and Ellis modification of the Bloom and Richardson grading system[26]. Patient data, such as age, hormone receptor status (ERα and PR), HER2-amplification, histological grade, metastases, local recurrence, progression and survival, were retrieved from the Munich Cancer Registry. The patients' character-istics are shown inTable 1.
Immunohistochemistry
Expression of ERα, PR and HER-2 was determined in all BC samples of this cohort at the LMU Department of Pathology, Germany, at diagnosis. ERα and PR expression was evaluated by
immunohistochemistry, as described previously [26]). Samples
showing nuclear staining in more than 10% of tumor cells were considered as hormone receptor-positive, in agreement with the guidelines at the time of the analysis (2000–2002). HER2 expression was analyzed with an automated staining system (Ventana; Roche, Mannheim, Germany), according to the manufacturer's instructions.
Data on N-cadherin and CD133 expression in these BC samples were
extracted from a previously published study[27]. For RIP140 and
LCoR analysis, samples were processed as previously described
[27,28]. Specifically, 3 μm tissue sections, cut from paraffin-embedded BC samples, were dewaxed in xylol (Carl Roth GmbH & Co. KG, Karlsruhe, Germany) at room temperature for 15 min. To block endogenous peroxidases, sections were immersed in a solution of 3% hydrogen peroxide (VWR International S.A.S., Fontenay-sous-Bois, France) in methanol (Sigma-Aldrich, Steinheim, Germany) for 20 min. After rehydrating in decreasing concentrations of ethanol (100–0% in distilled water), sections were boiled in a pressure cooker with sodium citrate buffer (pH 6) for 5 min (for epitope retrieval). Then, sections were washed with distilled water and phosphate buffered saline (PBS), before blocking with Powerblock (Biogenex, San Ramon, CA, USA) in distilled water (1:10) for 5 min. Sections were then incubated with the rabbit polyclonal anti-NRIP1
HPA046571 (1:400 in PBS; Sigma-Aldrich) and the mouse polyclonal anti-LCoR NBP1–83477 antibody (1:50 in PBS; Novus Biologicals, Littleton, CO, USA) at 4 °C for 16 hours. After incubation with the corresponding biotinylated secondary anti-rabbit and anti-mouse IgG antibodies, and with the associated avidin-biotin-peroxidase-complex (both Vectastain Elite ABC Kit; Vector Laboratories, Burlingame, CA, USA), interactions were visualized with the substrate and chromogen 3,3-diamino-benzidine (Dako, Glostrup, Denmark). Sections were counterstained with acidic hematoxylin and dehydrated in increasing concentrations of ethanol (70–100%). They were immediately mounted with Eukitt (Merck, Darmstadt, Germany) before manual analysis with a Diaplan light microscope (Leitz, Wetzlar, Germany) with 2.5x, 10x or 40x magnification. Images were acquired with a digital CCD camera system (JVC, Tokyo, Japan). Negative controls were performed by replacing the primary antibodies with the species-specific isotype control antibodies (Dako, Glostrup, Denmark). Appropriate positive controls (placenta samples) were included in each experiment.
Data Analysis
For RIP140 and LCoR expression, the immunoreactive score (IRS) was determined by evaluating the percentage of positive tumor cells and their staining intensity (IRS = percentage score x intensity score). For the quantification of positive cells (percentage score), BC samples were classified in four groups: no visible staining (score = 0),b10% of stained cells (score = 1), 10–50% of stained cells (score = 2), 51–80% of stained cells (score = 3), and 81–100% of stained cells (score = 4). Staining intensity (intensity score) was evaluated as: absence of staining (score = 0), weak (score = 1), moderate (score = 2), or strong staining (score = 3). Therefore, the maximum IRS value is 12. In doubtful cases, slides were evaluated by two or three independent examiners and the IRS represented the final consent. Staining localization (cytoplasmic and nuclear) was evaluated in parallel, leading to the determination of the cytoplasmic IRS and nuclear IRS separately. When needed, the total IRS was calculated by adding the cytoplasmic and nuclear IRS. For N-cadherin and CD133 expression, the IRS values corresponded to the total expression (i.e., nuclear and cytoplasmic staining)[27].
Statistical Analysis
Statistical analyses were performed using SPSS 23 (IBMSPSS Statistics, IBM Corp., Armonk, NY, USA). The correlations presented inTables 2 and 3were obtained by calculating the Pearson or Spearman's rho correlation coefficient (p values of Spearman's rho presented). Data distribution was displayed using box and whisker plots and the Kruskal-Wallis non-parametric one-way analysis of variance was used to detect significant differences. The p value and the number of patients/BC samples analyzed in each subgroup are
Table 2. Correlation Between Total, Nuclear and Cytoplasmic Expression of RIP140 and LCoR Correlation coefficient
n = 299 to 309
RIP140 LCoR
Total Nuclear Cytoplasmic Total Nuclear Cytoplasmic RIP140 Total 1.000 Nuclear 0.793** 1.000 Cytoplasmic 0.874** 0.427** 1.000 LCoR Total 0.414** 0.248** 0.459** 1.000 Nuclear 0.331** 0.284** 0.327** 0.819** 1.000 Cytoplasmic 0.397** 0.173** 0.465** 0.898** 0.536** 1.000 ** P≤ .01 (Spearman's rho test).
Table 1. Patients' Clinicopathological Characteristics
n % Patients 320 100% ER status * Negative 45 14.1% Positive 201 62.8% Unknown 74 23.1% PR status * Negative 93 29.1% Positive 153 47.8% Unknown 74 23.1% HER2 status * Negative 95 29.7% Positive 94 29.4% Unknown 131 40.9% Triple negative * No 169 52.8% Yes 20 6.3% Unknown 131 40.9% Histologic type Invasive lobular 42 13.1% Invasive medullar 12 3.8% Invasive mucinous 4 1.3% No Special Type (NST)† 174 54.4%
DCIS (only or with NST) 83 25.9%
Unknown 5 1.6% Tumor size * pT1 a, b, c 205 64.1% pT2 90 28.1% pT3 4 1.3% pT4 a, b, c, d 17 5.3% Unknown 4 1.3% Grade * I 15 4.7% II 109 34.1% III 48 15% Unknown 148 46.3%
Lymph node metastasis
No 167 52.2% Yes 133 41.6% Unknown 20 6.3% Local recurrence No 263 82.2% Yes 43 13.4% Unknown 14 4.4% Distant metastases‡ No 239 74.7% Yes 67 20.9% Unknown 14 4.4%
* All data refer to the primary tumor.
† NST include the formerly called“Invasive ductal” and “other” types.
‡ Distant metastases were detected in 8 patients (2.5%) at diagnosis and in 59 patients during the follow-up (18.44%).
given for each chart. For comparison of survival times, Kaplan–Meier curves were generated. Mantel-Cox (log-rank) tests were performed to compare survival curves (disease-free survival, DFS; or overall survival, OS). For all analyses, p values below 0.05 were considered statistically significant.
Results
RIP140 and LCoR Expression in BC Samples
The tumor samples evaluated for this study were from 320 patients with BC (mean age 59.9 years, range 26–94 years) who were followed for 10–12 years. As patients were treated between 2000 and 2002, hormone receptor and HER2 status were not recorded for all of them at the time of diagnosis (unknown ER and PR status in 19.5% and
unknown HER2 status in 37.1% of patients) (Table 1). Most
patients (n = 239; 74.7%) had a primary BC without metastases at diagnosis, and 59 (18.44%) developed distant metastases during the follow-up. Distant metastases were detected in 8 patients (2.5%) already at diagnosis, and the metastasis status at diagnosis was unknown in 14 patients (4.38%).
Analysis of RIP140 and LCoR expression in all BC samples showed that 304 and 309 samples were positive for RIP140 and LCoR, respectively. As staining was observed in the nucleus and/or cytoplasm of tumor cells, the IRS was calculated for each subcellular
location (Figure 1). Some tumors displayed similar nuclear and
cytoplasmic IRS values for the same protein (Figure 1, A and E, and B and F), whereas in other BC samples the nuclear and cytoplasmic IRS values were very different (Figure 1, D and H, and C and G).
Analysis of the distribution of the nuclear and cytoplasmic IRS values for RIP140 (Supplementary Fig. 1A and C) and LCoR (Supplementary Fig. 1B and D) showed that the highest IRS values was 9 in the nucleus and 8 in the cytoplasm for LCoR, whereas it was 6 in both compartments for RIP140. However, as very few samples had very high LCoR IRS values, the mean IRS were similar for LCoR and RIP140 (1.31 and 2.71 in the nucleus and cytoplasm respectively for LCoR, and 1.71 and 2.12 respectively for RIP140). For both proteins, the mean IRS was higher in the cytoplasm than in the nucleus.
Analysis of the correlations between nuclear, cytoplasmic and total IRS for each protein independently using the Spearman rho (Table 2) showed that for RIP140 (n = 304 samples), the total IRS was strongly correlated with both nuclear and cytoplasmic IRS, and that the nuclear and cytoplasmic IRS were correlated between them (Pb .01).
Similar results were obtained for LCoR (n = 309) (Pb .01).
The correlations between nuclear and cytoplasmic IRS values for RIP140 and LCoR were confirmed also when BC samples were classified in two groups based on the absence (IRS = 0) and presence (IRSN0) of nuclear expression of RIP140 or LCoR (Supplementary Fig. 2A-B) (box plots and Kruskal-Wallis non-parametric test, Pb .001).
Correlation Between RIP140 and LCoR Expression
Concerning the total expression of RIP140 and LCoR, both transcription co-regulators were negative (IRS = 0) in 1.7% of BC
samples (Figure 2), whereas they were both positive (IRS N0) in
81.3% of tumors. Positivity for only one was detected in 17% of samples. A similar distribution was observed for the nuclear and cytoplasmic IRS values. More than 60% of tumor samples expressed
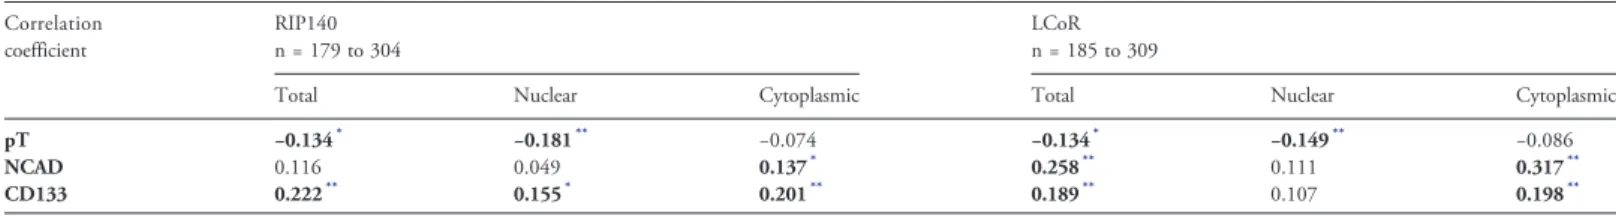
Table 3. Correlation Between RIP140/LCoR with Tumor Size (pT) and EMT/CSC Markers Correlation coefficient RIP140 n = 179 to 304 LCoR n = 185 to 309
Total Nuclear Cytoplasmic Total Nuclear Cytoplasmic
pT −0.134* −0.181** −0.074 −0.134* −0.149** −0.086
NCAD 0.116 0.049 0.137* 0.258** 0.111 0.317**
CD133 0.222** 0.155* 0.201** 0.189** 0.107 0.198**
* P≤ .05 or
** P≤ .01 (Spearman's rho test).
E
0:0 8:1G
F
8:9 3:9H
50 mA
0:0 3:0C
B
4:6 0:6D
50 µm RIP140 LCoR µFigure 1. Immunohistochemical analysis of RIP140 and LCoR expression. Evaluation of RIP140 (A to D) and LCoR (E to H) expression in primary BC samples showing no or low nuclear expression (A, C, E, G) and high nuclear expression (B, D, E, F) of the two transcription co-regulators. The cytoplasmic and nuclear IRS values are indicated for each BC sample. Scale bars: 50μm.
both markers, whereas 8% (nuclear IRS) and 11% (cytoplasmic IRS) of tumors were negative for both RIP140 and LCoR.
In agreement, the total, cytoplasmic and nuclear IRS for RIP140 were positively and significantly correlated with the relevant IRS
values for LCoR (Pb .01, n = 299 samples with both stainings)
(Table 2). The correlation between nuclear and cytoplasmic IRS
values for RIP140 and LCoR was confirmed when BC samples were classified in two groups based on the absence (IRS = 0) and presence
(IRSN0) of nuclear or cytoplasmic expression of LCoR
(Supplemen-tary Fig. 2C-D) (box plots and Kruskal-Wallis non-parametric test,
Pb .001). Similar results were obtained for the total IRS values
(data not shown).
Correlation of RIP140 and LCoR Expression with
Clinico-pathological Parameters and Tumor Aggressiveness Markers
Expression of ER and PR (two main prognostic markers for BC) did not correlate with RIP140 or LCoR expression (total, cytoplasmic or nuclear IRS values, data not shown). Conversely, the total
(Pb .05) and nuclear (P b .01) IRS values for RIP140 and LCoR
were negatively correlated with pT (Table 3). This result was
confirmed after separating BC samples in two groups based on the
pT: pT1 (tumor size≤20 mm at its widest area) and pT2–4 (tumor
larger than 20 mm) (Supplementary Fig. 3A-B).
No other clinicopathological parameter (age, HER2, histologic type, grade, node status, distant metastases, triple negative status, contralateral BC and local recurrence) was correlated with RIP140 or LCoR expression (data not shown). However, in the specific subgroup of patients with nuclear expression of both RIP140 and LCoR (n = 188), nuclear RIP140 was negatively correlated with ERα
and PR (rho =− 0.164 and − 0.181 respectively, P b .05), and
Nuclear RIP140 Total RIP140
Cytoplasmic RIP140 (HER2 positive patients)Total LCoR
A
B
C
D
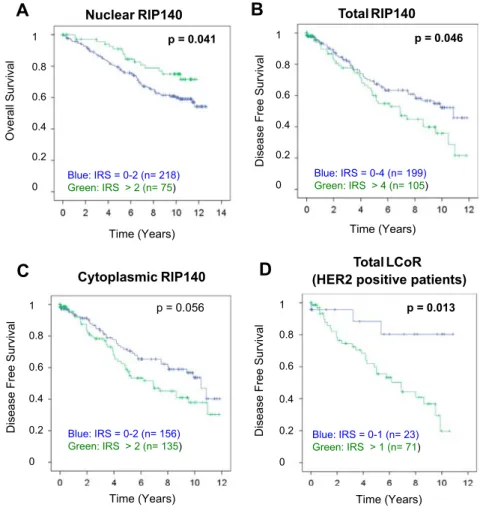
Figure 3. Kaplan–Meier analysis of patient survival according to the RIP140 or LCoR IRS values. For this analysis, optimized IRS cut-off values for low and high RIP140 or LCoR expression were determined by ROC-curve analysis. Overall survival was longer in patients with nuclear RIP140 IRSN2 (A). free survival (12-year follow-up) according to total (B) or cytoplasmic (C) RIP140 IRS values. Disease-free survival was associated with total LCoR IRS values only in the sub-population of patients with HER2-positive BC (n = 94) (D). Figure 2. Distribution of RIP140 and LCoR expression in primary BC
samples. The graph shows the percentage of tumors expressing both proteins, only RIP140, only LCoR, or none (IRS = 0).
positively correlated with the triple negative status (rho = 0.214,
Pb .01).
Besides these widely used clinicopathological features, BC aggressiveness is known to be driven by other parameters, such as epithelial mesenchymal transition (EMT) and CSCs. N-cadherin (EMT marker) and CD133 (CSC marker) expression correlated with
cytoplasmic RIP140 (Pb .05 for N-cadherin and P b .01 for
CD133) and cytoplasmic LCoR expression (P b .01 for
N-cadherin and for CD133), and also with total LCoR (Pb .01).
Moreover, CD133 correlated also with nuclear and total IRS for RIP140 (P b .01) (Table 3).
The correlations between cytoplasmic RIP140/LCoR and N-cadherin (Supplementary Fig. 3C-D) and CD133 expression (Supplementary Fig. 3E-F) were confirmed after grouping the BC samples according to the presence (IRSN0) and absence (IRS = 0) of N-cadherin or CD133 expression, respectively. Moreover, in the whole cohort, N-cadherin was correlated with CD133 expression
(rho = 0.432, n = 261, Pb .01).
Correlation with patient survival
Kaplan–Meier analyses identified significant correlations between
RIP140 and LCoR expression and DFS and OS (Figure 3). For this
analysis, optimized IRS cut-off values for low and high RIP140 or LCoR expression were determined by receiver operating characteristic curve (ROC-curve) analysis, based on the maximal differences of sensitivity and specificity.
Patients with tumors with low nuclear RIP140 expression (IRS≤2)
had a worse OS than those with high IRS values (IRSN2) (mean OS:
9.37 ± 0.30 years vs 10.14 ± 0.38 years; P = .041). Conversely, DFS was significantly longer in patients with low total RIP140
expression (IRS ≤4) than in those with high expression (IRS N4)
(mean DFS: 8.15 ± 0.39 years vs 6.89 ± 0.51 years; P = .046) (Figure 3, A and B). A similar trend, although not significant, was
observed for cytoplasmic RIP140 expression (P = .056,Figure 3C).
LCoR expression did not have a significant effect on DFS or OS in the whole population. However, within the subgroup with HER2-positive tumors (n = 94), DFS was significantly longer in patients
with low (total IRS≤1) than in those with higher LCoR expression
(total IRSN1) (mean DFS: 9.38 ± 0.77 years vs 6.23 ± 0.52 years;
(P = .013)(Figure 3D).
Finally, multivariate analysis using the Cox regression model with RIP140 and LCoR expression (total, nuclear or cytoplasmic), N-Cadherin and CD133 levels and 11 clinicopathological features (ER, PR, HER2, triple negative status, histologic type, age, grading, pT, pN, local recurrence, and distant metastases) showed that besides age, pT, pN, and distant metastasis, no other parameter was an independent prognostic factor for OS in this cohort (data not shown). Discussion
The purpose of this study was to elucidate the expression localization of the two transcription co-regulators RIP140 and LCoR in BC, and to correlate their expression in different cell compartments with tumor aggressiveness markers, clinicopathological features and patient survival.
Both RIP140 and LCoR were expressed in most of the 320 BC samples analyzed. Overall, they were moderately expressed, and predominantly in the cytoplasm with a strong correlation between cytoplasmic and nuclear expression for each protein. We and others previously described their expression in both nucleus and in cytoplasm [7,19,29]. Aziz et al. [7]reported a preferential increase
of RIP140 nuclear localization in epithelial cancer cells. Various
post-translational modifications, including lysine acetylation [30] or
conjugation to vitamin B6 [31], have been proposed to explain
RIP140 nucleo-cytoplasmic shuttling. Fewer data are available concerning LCoR post-translational modifications and it should be interesting to monitor its phosphorylation status, particularly in HER2-positive BC in view of our findings (see data fromFigure 3D). In the MCF-7 cell line used as a ER/PR-positive BC model, LCoR is evenly distributed in both compartments, whereas RIP140 is expressed predominantly in the nucleus[19]. Therefore, the MCF7 cell line, like the tumors of our patient cohort, is characterized by a low cytoplasmic/ nuclear IRS ratio for RIP140 and a ratio close to 1 for LCoR.
By comparing the expression of both RIP140 and LCoR, we found strong correlations between their cytoplasmic, nuclear and total expression. More than 80% of tumors expressed both proteins, whereas only 1.7% was negative for both. For both RIP140 and LCoR, the mean IRS values were higher in the cytoplasm than in the nucleus. These results are fully concordant with our previously published data obtained by mRNA analysis and showing that RIP140
can transactivate the LCOR gene promoter in BC cells[19].
We then analyzed the correlations between expression of RIP140/ LCoR and of N-cadherin (EMT marker) and CD133 (CSC marker). We previously demonstrated that N-cadherin and CD133 expression correlate positively in 307 primary BC tumors from this cohort, and that N-cadherin positivity is associated with shorter survival time for
patients without lymph node metastases [27]. Moreover, N-cadherin
expression was significantly higher in metastases than in the related primary tumors. Here, we found that RIP140 and LCoR cytoplasmic expression were positively correlated with N-cadherin and CD133 expression, suggesting that in the cytoplasm, RIP140 and LCoR could specifically interact with these pathways to promote BC progression.
Analysis of the correlations between the patients' clinicopatholog-ical and RIP140 and LCoR IRS values highlighted that only tumor size was negatively correlated with nuclear RIP140 and LCoR expression, suggesting that nuclear RIP140 and LCoR may play a role in tumor growth inhibition. Moreover, nuclear RIP140 was negatively correlated with ERα and PR and positively correlated with the triple negative status in the subgroup of patients with nuclear expression of both RIP140 and LCoR.
Altogether, these findings suggest that RIP140 and LCoR may have different roles in tumor development according to their subcellular location. This hypothesis is supported by the results of our survival analyses. Indeed, high total or cytoplasmic expression of RIP140 was associated with shorter DFS, whereas high nuclear expression predicted longer OS. This suggests opposite roles for cytoplasmic and nuclear RIP140 in survival. Similarly, low total LCoR expression was strongly correlated with longer DFS in patients with HER2-positive cancer. A previous study demonstrated that low
RIP140 or LCOR mRNA expression is associated with poor OS[19].
Although RIP140 and LCoR expression are well correlated with each other in BC samples, the present study also demonstrates that these two transcription co-regulators may play different roles in breast tumorigenesis, according to their subcellular location. Indeed, nuclear RIP140 correlated with smaller tumor size and longer OS, whereas cytoplasmic LCoR correlated with markers of poor prognosis (N-cadherin, CD133) and poor DFS in HER2-positive tumors. However, the result of the multivariate analysis indicated that only age, pT, pN, and distant metastasis are independent prognostic factors for OS in this cohort. Therefore, further studies are needed to
delineate the specific roles of cytoplasmic and nuclear RIP140 and LCoR in BC progression as well as their relevance as potential new independent prognostic markers in BC. Especially, it would be relevant to investigate the involvement the association of nuclear and cytoplasmic expression of RIP140 and LCoR with the response of BC patients to systemic or targeted therapies.
It is however noteworthy to highlight that, in this first study dealing with the specific analysis of nuclear/cytoplasmic expression of RIP140 and LCoR in breast tumors, data showing correlations of expression with patient survival or other parameter such as tumor size or expression of CD133/N-Cadherin, is helpful to better appreciate the biological roles of these two transcriptional co-regulators in breast tumorigenesis.
Competing Interests
The authors declare that they have no competing interests. We confirm that the authors have full control of all primary data and agree that the journal is allowed to review these data if requested. Acknowledgements
Not applicable.
Appendix A. Supplementary data
Supplementary data to this article can be found online athttps:// doi.org/10.1016/j.tranon.2018.06.006.
References
[1] Ferlay J, Soerjomataram I, Dikshit R, Eser S, Mathers C, Rebelo M, Parkin DM, Forman D, and Bray F (2015). Cancer incidence and mortality worldwide: sources, methods and major patterns in GLOBOCAN 2012. Int J Cancer136, E359-386.
[2] Duffy MJ, Harbeck N, Nap M, Molina R, Nicolini A, Senkus E, and Cardoso F (2017). Clinical use of biomarkers in breast cancer: Updated guidelines from the European Group on Tumor Markers (EGTM). Eur J Cancer75, 284–298.
[3] den Hollander P, Savage MI, and Brown PH (2013). Targeted therapy for breast cancer prevention. Front Oncol3, 250.
[4] Obeid J-P, Zafar N, and El Hokayem J (2016). Steroid Hormone Receptor Coregulators in Endocrine Cancers. IUBMB Life68, 504–515.
[5] Rohira AD and Lonard DM (2017). Steroid receptor coactivators present a unique opportunity for drug development in hormone-dependent cancers. Biochem Pharmacol140, 1–7.
[6] Augereau P, Badia E, Balaguer P, Carascossa S, Castet A, Jalaguier S, and Cavaillès V (2006). Negative regulation of hormone signaling by RIP140. J Steroid Biochem Mol Biol102, 51–59.
[7] Aziz MH, Chen X, Zhang Q, DeFrain C, Osland J, Luo Y, Shi X, and Yuan R (2015). Suppressing NRIP1 inhibits growth of breast cancer cells in vitro and in vivo. Oncotarget6, 39714–39724.
[8] Cavaillès V, Dauvois S, L’Horset F, Lopez G, Hoare S, Kushner PJ, and Parker
MG (1995). Nuclear factor RIP140 modulates transcriptional activation by the estrogen receptor. EMBO J14, 3741–3751.
[9] Lei J-J, Peng R-J, Kuang B-H, Yuan Z-Y, Qin T, Liu W-S, Guo Y-M, Han H-Q, Lian Y-F, and Deng C-C, et al (2015). NOP14 suppresses breast cancer progression by inhibiting NRIP1/Wnt/β-catenin pathway. Oncotarget 6, 25701–25714.
[10] Castet A, Boulahtouf A, Versini G, Bonnet S, Augereau P, Vignon F, Khochbin S, Jalaguier S, and Cavaillès V (2004). Multiple domains of the Receptor-Interacting Protein 140 contribute to transcription inhibition. Nucleic Acids Res 32, 1957–1966.
[11] Christian M, Kiskinis E, Debevec D, Leonardsson G, White R, and Parker MG (2005). RIP140-targeted repression of gene expression in adipocytes. Mol Cell Biol25, 9383–9391.
[12] Kiskinis E, Chatzeli L, Curry E, Kaforou M, Frontini A, Cinti S, Montana G, Parker MG, and Christian M (2014). RIP140 represses the“brown-in-white”
adipocyte program including a futile cycle of triacylglycerol breakdown and synthesis. Mol Endocrinol28, 344–356.
[13] White R, Morganstein D, Christian M, Seth A, Herzog B, and Parker MG (2008). Role of RIP140 in metabolic tissues: connections to disease. FEBS Lett 582, 39–45.
[14] Nautiyal J, Steel JH, Mane MR, Oduwole O, Poliandri A, Alexi X, Wood N, Poutanen M, Zwart W, and Stingl J, et al (2013). The transcriptional co-factor RIP140 regulates mammary gland development by promoting the generation of key mitogenic signals. Development140, 1079–1089.
[15] Docquier A, Garcia A, Savatier J, Boulahtouf A, Bonnet S, Bellet V, Busson M, Margeat E, Jalaguier S, and Royer C, et al (2013). Negative regulation of estrogen signaling by ERβ and RIP140 in ovarian cancer cells. Mol Endocrinol 27, 1429–1441.
[16] Lapierre M, Bonnet S, Bascoul-Mollevi C, Ait-Arsa I, Jalaguier S, Del Rio M, Plateroti M, Roepman P, Ychou M, and Pannequin J, et al (2014). RIP140 increases APC expression and controls intestinal homeostasis and tumorigenesis. J Clin Invest124, 1899–1913.
[17] Lapierre M, Castet-Nicolas A, Gitenay D, Jalaguier S, Teyssier C, Bret C, Cartron G, Moreaux J, and Cavaillès V (2015). Expression and role of RIP140/ NRIP1 in chronic lymphocytic leukemia. J Hematol Oncol8, 20.
[18] Rosell M, Nevedomskaya E, Stelloo S, Nautiyal J, Poliandri A, Steel JH, Wessels LFA, Carroll JS, Parker MG, and Zwart W (2014). Complex formation and function of estrogen receptorα in transcription requires RIP140. Cancer Res 74, 5469–5479.
[19] Jalaguier S, Teyssier C, Nait Achour T, Lucas A, Bonnet S, Rodriguez C, Elarouci N, Lapierre M, and Cavaillès V (2017). Complex regulation of LCoR signaling in breast cancer cells. Oncogene36, 4790–4801.
[20] Fernandes I, Bastien Y, Wai T, Nygard K, Lin R, Cormier O, Lee HS, Eng F, Bertos NR, and Pelletier N, et al (2003). Ligand-dependent nuclear receptor corepressor LCoR functions by histone deacetylase-dependent and -independent mechanisms. Mol Cell11, 139–150.
[21] Palijan A, Fernandes I, Bastien Y, Tang L, Verway M, Kourelis M, Tavera-Mendoza LE, Li Z, Bourdeau V, and Mader S, et al (2009). Function of histone deacetylase 6 as a cofactor of nuclear receptor coregulator LCoR. J Biol Chem 284, 30264–30274.
[22] Palijan A, Fernandes I, Verway M, Kourelis M, Bastien Y, Tavera-Mendoza LE, Sacheli A, Bourdeau V, Mader S, and White JH (2009). Ligand-dependent corepressor LCoR is an attenuator of progesterone-regulated gene expression. J Biol Chem284, 30275–30287.
[23] White JH, Fernandes I, Mader S, and Yang X-J (2004). Corepressor recruitment by agonist-bound nuclear receptors. Vitam Horm68, 123–143.
[24] Asim M, Hafeez BB, Siddiqui IA, Gerlach C, Patz M, Mukhtar H, and Baniahmad A (2011). Ligand-dependent corepressor acts as a novel androgen receptor corepressor, inhibits prostate cancer growth, and is functionally inactivated by the Src protein kinase. J Biol Chem286, 37108–37117.
[25] Celià-Terrassa T, Liu DD, Choudhury A, Hang X, Wei Y, Zamalloa J, Alfaro-Aco R, Chakrabarti R, Jiang Y-Z, and Koh BI, et al (2017). Normal and cancerous mammary stem cells evade interferon-induced constraint through the miR-199a-LCOR axis. Nat Cell Biol19, 711–723.
[26] Elston EW and Ellis IO (1993). Method for grading breast cancer. J Clin Pathol 46, 189–190.
[27] Bock C, Kuhn C, Ditsch N, Krebold R, Heublein S, Mayr D, Doisneau-Sixou S, and Jeschke U (2014). Strong correlation between N-cadherin and CD133 in breast cancer: role of both markers in metastatic events. J Cancer Res Clin Oncol 140, 1873–1881.
[28] Mylonas I, Makovitzky J, Jeschke U, Briese V, Friese K, and Gerber B (2005). Expression of Her2/neu, steroid receptors (ER and PR), Ki67 and p53 in invasive mammary ductal carcinoma associated with ductal carcinoma In Situ (DCIS) Versus invasive breast cancer alone. Anticancer Res25, 1719–1723.
[29] Ho P-C, Lin Y-W, Tsui Y-C, Gupta P, and Wei L-N (2009). A negative regulatory pathway of GLUT4 trafficking in adipocyte: new function of RIP140 in the cytoplasm via AS160. Cell Metab10, 516–523.
[30] Vo N, Fjeld C, and Goodman RH (2001). Acetylation of nuclear hormone receptor-interacting protein RIP140 regulates binding of the transcriptional corepressor CtBP. Mol Cell Biol21, 6181–6188.
[31] Huq MDM, Tsai N-P, Lin Y-P, Higgins L, and Wei L-N (2007). Vitamin B6 conjugation to nuclear corepressor RIP140 and its role in gene regulation. Nat Chem Biol3, 161–165.