HAL Id: hal-00276162
https://hal.archives-ouvertes.fr/hal-00276162
Submitted on 28 Apr 2008HAL is a multi-disciplinary open access archive for the deposit and dissemination of sci-entific research documents, whether they are pub-lished or not. The documents may come from teaching and research institutions in France or abroad, or from public or private research centers.
L’archive ouverte pluridisciplinaire HAL, est destinée au dépôt et à la diffusion de documents scientifiques de niveau recherche, publiés ou non, émanant des établissements d’enseignement et de recherche français ou étrangers, des laboratoires publics ou privés.
AN AUTOMATED MEASUREMENT BENCH FOR
INTEGRATED BAW RESONATORS NONLINEAR
CHARACTERIZATION AT MICROWAVE
FREQUENCIES
Sylvain Godet, Sébastien Gribaldo, Éric Tournier, Olivier Llopis, A.
Reinhardt, J.B. David
To cite this version:
Sylvain Godet, Sébastien Gribaldo, Éric Tournier, Olivier Llopis, A. Reinhardt, et al.. AN AU-TOMATED MEASUREMENT BENCH FOR INTEGRATED BAW RESONATORS NONLINEAR CHARACTERIZATION AT MICROWAVE FREQUENCIES. European Frequency and Time Forum, Apr 2008, Toulouse, France. paper n° 100. �hal-00276162�
AN AUTOMATED MEASUREMENT BENCH
FOR INTEGRATED BAW RESONATORS NONLINEAR
CHARACTERIZATION AT MICROWAVE FREQUENCIES
S. Godet, LAAS-CNRS, Toulouse University, FRANCE S. Gribaldo, LAAS-CNRS, Toulouse University, FRANCE E. Tournier, LAAS-CNRS, Toulouse University, FRANCE O. Llopis, LAAS-CNRS, Toulouse University, FRANCE A. Reinhardt, CEA- LETI MINATEC, Grenoble, FRANCE
J.B. David, CEA-LETI MINATEC, Grenoble, FRANCE
BIOGRAPHY
Sylvain Godet received the Master degree in electronics from Paul Sabatier University in 2005. He is currently working towards his PhD thesis at LAAS-CNRS laboratory in Toulouse (Laboratory for System Analysis and Architecture of the National Centre for Scientific Studies). His interests are in microwave integrated circuits design, integrated test benches and circuits using BAW devices.
I- INTRODUCTION
Microwave circuits engineers are still seeking new resonators, featuring simultaneously a high Q factor and small dimensions. Integrated piezoelectric resonators [1] match these requirements, with unloaded Q factors as high as 1000 for the recently developed AlN thin film resonators. These resonators are either of FBAR type (Film Bulk Acoustic Resonator) and isolated from the substrate, or of SMR type (Solidly Mounted Resonators) and physically linked to the substrate. They are either processed above IC or processed separately and assembled with the silicon circuit. Concerning time&frequency applications, these integrated BAW resonators are today essential devices for low phase noise oscillator design in the low microwave range (1 to 5 GHz). However, compare to more classical microwave resonators, these BAW devices feature a nonlinear behavior at high microwave power, which may be a problem in filter or oscillator applications [2 to 5]. This nonlinear behavior is also related to an intrinsic phase noise, which has to be characterized prior to oscillator design. It is thus important to accurately characterize this nonlinear behavior, in order to be able to model it and to take it into account in a circuit simulation.
This paper presents an automated measurement bench dedicated to the test of the nonlinear behavior of BAW resonators. It is well suited for applications in which a large number of resonators have to be measured. This includes reliability investigations at large microwave power. The measurement data are also used for resonators nonlinear model extraction, with a set of resonators featuring a large number of different shapes and areas.
II- BAW RESONATORS TEST SET-UP
Automated nonlinear microwave measurements are relatively complex, particularly if the device to be measured is highly sensitive to any change in the input frequency. The experimental problem is actually a special case of the nonlinear S parameters characterization. This type of measurement is today relatively well known in the field of power amplifiers design but, up to our knowledge, has never been applied to nonlinear resonators. This is indeed not easy, because the resonant frequency as to be found prior any power measurement can be performed, and this resonant frequency may shift in frequency with the microwave power. Moreover, nonlinear S parameters test sets are quite uncommon and very expensive systems.
We have thus decided to build our own dedicated system, based on a small signal S parameters measurement test-set which is coupled to a spectrum analyzer. The BAW resonator is measured in a reflection measurement mode (S11), using an highly directive coupler and a power amplifier (5 W output) on the port 1 of the network analyzer, which allows the measurement of the S11 parameter at high power level.
The measurement bench is depicted in Figure 1 and 2. The harmonic signals generated by the power amplifier are canceled using a low pass filter, which allows the system to deliver a high power sinusoidal signal near 2 GHz (actually, between 1.8 GHz and 2.2 GHz). An attenuator is used to protect the network analyzer port 2, in order to measure the S parameters always in linear mode at the network analyzer power detector level. Concerning the spectrum analyzer measurement, the 10 dB attenuation of the directive coupler, together with the 3 dB attenuation of the power splitter, are sufficient to protect this apparatus from the too high power levels reflected from the resonator. Any addition of an attenuator would reduce the signal to noise ratio and prevent the measurement of the low level harmonics signals generated by the resonator under test. Finally, the device under test (DUT) is put on a probe station, and the overall system is computer controlled through GPIB. The measurement process is shown in Figure 3. Firstly, the network analyzer is calibrated with the probes “up”, which corresponds to a reflection on an open circuit (|S11| = 1). The coupler performs the conversion of the S21 parameter measured on the network analyzer into the resonator’s reflection S11 parameter.
After the calibration has been performed, it is possible to search for the resonator resonant frequencies. The S parameters are plotted in real and imaginary values, and the marker is put at the maximum of the real value, which
corresponds to the parallel resonant frequency f1
(Figure 5). For more precision, it is possible to search for the zero of the imaginary part of S11. Concerning the series resonance f2, it is not as easy to find on the real part
plot of S11, and the search of the zero of the imaginary part is mandatory. However, in a first configuration, our system was dedicated to the test of the resonators on the parallel resonance (normal mode for a resonator connected to ground on one side).
The next step of the process is to fix the network analyzer synthesizer at a single frequency corresponding to the
resonant frequency f1. Then, the measurement of the
harmonics generated by the resonator under test can be performed on the spectrum analyzer. Once again, this measurement is performed automatically thanks to the marker search peak function of the spectrum analyzer. Then, the source power on the network analyzer is increased of 5 dB, and the measurement procedure can start again. 37 dBm Directive coupler GPIB Probe station 10 dB coupling / 45 dB isolation 1-2 GHz 1-2 GHz Power spectrum S parameters 1 2 PA PA Att. 1-2 GHz fc= 3 GHz 37 dBm Directive coupler GPIB Probe station 10 dB coupling / 45 dB isolation 1-2 GHz 1-2 GHz Power spectrum S parameters 1 2 PA PA Att. 1-2 GHz fc= 3 GHz
Figure 1 : Measurement test set - schematics
Figure 2 : Measurement test set – general view
A difficult problem is the management of the reference level and attenuator level of the spectrum analyser during the increase of the power. The increase of the programmable attenuator protects the spectrum analyser from being damaged, but also, and above all, of behaving itself as a nonlinear element. If the spectrum analyser saturates, it generates itself a second and third harmonic and the measurement data is no longer the DUT measurement but the measurement of the nonlinear behaviour of the spectrum analyser ! However, a value chosen too high of this parameter will reduce the signal to noise ratio, and prevent the measurement of the second and third harmonics of the DUT. In this case, the harmonics signals are hidden in the noise floor. Therefore these two parameters have to be constantly adjusted to an optimum value while the power is growing up.
1) Network analyser calibration
2) Computer control search for the amplitude minimum 3) Set the network analyser synthesizer frequency at the
resonance frequency 4) Measurement of the harmonics 5) Increase of the output power
Outputs Resonant frequency (versus power) Output power at harmonics
1) Network analyser calibration
2) Computer control search for the amplitude minimum 3) Set the network analyser synthesizer frequency at the
resonance frequency 4) Measurement of the harmonics 5) Increase of the output power
Outputs Resonant frequency (versus power) Output power at harmonics
Figure 3 : Measurement process
Concerning the test frequency, we have found that the search for the resonant frequency at every power is not always necessary for these devices. Indeed, the change of the resonant frequency with the microwave power is relatively weak : about 6 MHz up to 30 dBm (which is a little lower than the resonator 3 dB bandwidth). Moreover, such weak variations of the resonant frequency can only be measured if a calibration of the network analyser is performed at every output power, and also searching for the zero value of the imaginary part of S11 instead of the maximum of the real value.
III- EXAMPLES OF BAW MEASUREMENTS A set of resonators from CEA-LETI has been measured with this nonlinear measurement bench. These resonators are realized with a piezoelectric thin film of AlN, and an acoustic mirror. They are of different size and complex geometries in order to limit the parasitics acoustic modes (apodized resonators). Silicium Substrat Loading Layer Electrodes SiOC SiN Acoustic Mirror Piezo Layer : AlN
Silicium Substrat Loading Layer Electrodes SiOC SiN Acoustic Mirror Piezo Layer : AlN
A typical plot of the S parameters response of the resonators is depicted in Figure 5. The two resonance are clearly visible on this plot obtained at low microwave level (about -20 dBm).
These resonators are sensitive to high microwave power through self heating phenomena [6] and nonlinear phenomena. Discriminating both phenomena is not easy, at least studying the variation of the resonant frequency alone ; the harmonic generation is, of course, only related to the nonlinear effect.
The variation of the resonant frequency versus the microwave power is depicted in Figure 6 for three of these resonators. To plot this curve, a careful calibration has been performed at every power step, and the resonant frequency has been tracked on the crossing of the 0 axis of the imaginary part of S11. As already pointed out, the observed variation is relatively weak, but not negligible. It can be modelled using a nonlinear capacitance in the resonator model (model in progress at this time).
ST10 -1 -0,8 -0,6 -0,4 -0,2 0 0,2 0,4 0,6 0,8 1
1,80E+09 2,00E+09 2,20E+09 Frequency (Hz) R e al (S 21 ) -1 -0,8 -0,6 -0,4 -0,2 0 0,2 0,4 0,6 0,8 1 Im a g (S 2 1 ) reS21 imS21 f1 f2 ST10 -1 -0,8 -0,6 -0,4 -0,2 0 0,2 0,4 0,6 0,8 1
1,80E+09 2,00E+09 2,20E+09 Frequency (Hz) R e al (S 21 ) -1 -0,8 -0,6 -0,4 -0,2 0 0,2 0,4 0,6 0,8 1 Im a g (S 2 1 ) reS21 imS21 f1 f2
Figure 5 : low level S parameters of an SMR resonator
2,073 2,0735 2,074 2,0745 2,075 2,0755 2,076 10 15 20 25 30 35 Input pow er (dBm ) R e so n a n ce f re q u e n c y (G Hz ) ST-2 ST-25 ST-26 Figure 6 : parallel resonant frequency of three different
resonators versus the input microwave power Figure 7 depicts a typical plot obtained after an automated measurement of a resonator RF power response, on the first, second and third harmonics. The increase of the second harmonic is clear, meanwhile the third harmonic remains low. Because of the relatively weak effect which is measured, it is important to compare these results with the measurement noise floor. This is
what has been done on this picture, in which the resonator measurement is superimposed to the data obtained with a measurement performed with an open circuit in place of the resonator (probes “up”). It is clear, on this plot, that the second harmonic generated by the resonator is much higher than the second harmonic measured with the probes “up”. However, this is not the case of the third harmonic, for which the measurement data are too close from the system noise floor. Therefore, we have focused most of our investigations on the behaviour of the second harmonic. Pout=f(Pin) -70 -60 -50 -40 -30 -20 -10 0 10 20 30 40 -30 -20 -10 0 10 20 30 40 Pin (dBm) P out ( d B m ) ST-33 Harm1 ST-33 Harm2 ST-33 Harm3 ST-10 Harm1 ST-10 Harm2 ST-10 Harm3 Measurement floor & calibration (probes up) Pout=f(Pin) -70 -60 -50 -40 -30 -20 -10 0 10 20 30 40 -30 -20 -10 0 10 20 30 40 Pin (dBm) P out ( d B m ) ST-33 Harm1 ST-33 Harm2 ST-33 Harm3 ST-10 Harm1 ST-10 Harm2 ST-10 Harm3 Measurement floor & calibration (probes up)
Figure 7 : Reflected power response of a resonator on the three first harmonics near respectively 2 GHz, 4 GHz and 6 GHz (parallel resonant frequency). Comparison with the measurement noise floor.
Another question was about the sensitivity of the results on the resonant frequency : is the nonlinear behaviour observed only at resonance, or in the vicinity of the resonance, at the parallel resonance, at series resonance, or both ? Resonant frequency is the frequency in which the maximum power is trapped into the resonator, so it seems obvious that a maximum of the nonlinear behaviour should be observed at the resonance if the nonlinear behaviour is directly related to the resonator main vibration mode. However, if different modes are responsible for this effect, may be a lightly different frequency will enhance the phenomenon.
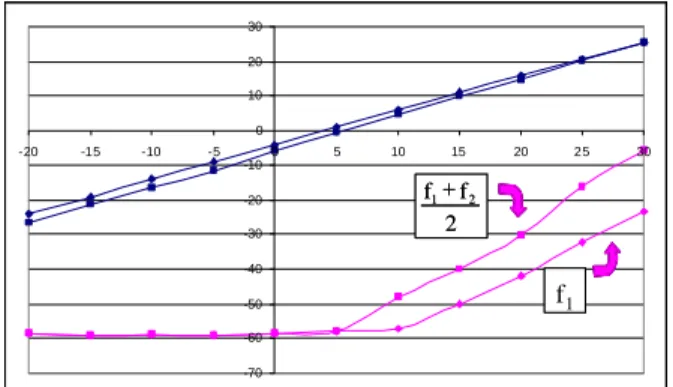
We have found actually that, for some devices, the nonlinear behaviour was stronger between the two resonances (f1 + f2)/2 than at the resonance f1. This effect
needs however to be more deeply investigated to determine the physical reason for this a priori unexpected behaviour. -70 -60 -50 -40 -30 -20 -10 0 10 20 30 -20 -15 -10 -5 0 5 10 15 20 25 30 2 f f1+ 2 f2 -70 -60 -50 -40 -30 -20 -10 0 10 20 30 -20 -15 -10 -5 0 5 10 15 20 25 30 2 f f1+ 2 f1 -70 -60 -50 -40 -30 -20 -10 0 10 20 30 -20 -15 -10 -5 0 5 10 15 20 25 30 -70 -60 -50 -40 -30 -20 -10 0 10 20 30 -20 -15 -10 -5 0 5 10 15 20 25 30 2 f f1+ 2 2 f f1+ 2 f2 -70 -60 -50 -40 -30 -20 -10 0 10 20 30 -20 -15 -10 -5 0 5 10 15 20 25 30 -70 -60 -50 -40 -30 -20 -10 0 10 20 30 -20 -15 -10 -5 0 5 10 15 20 25 30 2 f f1+ 2 2 f f1+ 2 f1
Figure 8 : Evidence on one of the resonators of a stronger nonlinear effect between the two resonances (f1+f2)/2 = 2.046 GHz, and f1 = 2.069 GHz.
IV- CONCLUSION
A measurement test set dedicated to the evaluation of integrated BAW resonators nonlinear behaviour has been presented. This measurement bench can be realized using apparatus currently available in microwave laboratories (a network analyser and a spectrum analyser). It allows the plot of the resonant frequency and of the harmonic power of the resonator submitted to microwave powers ranging from -20 dBm to 30 dBm. It includes an automated search of the resonant frequency and of the optimum conditions to minimize the noise floor.
Some measurements on SMR devices have been presented. These measurements show an evidence of a relatively high second harmonic power for an input signal rising above approximately 10 dBm input power. This nonlinear effect can be observed at the resonance, but also in the vicinity of the resonant frequency.
V- ACKNOWLEDGEMENTS
This work has been performed in the frame of the
European contract IST n° 027003
“
MOBILIS”. Wewould like to thank our partners of this consortium for fruitful discussions.
REFERENCES
[1] K. M. Lakin, “Thin Film Resonator Technology”,
IEEE Int. Freq. Control Symp. And PDA Exhibition, pp.765-778, 2003.
[2] Yutaka Abe, “Nonlinear Behavior in Quartz
Resonators”, IEEE Ultrasonics Symposium, pp.449-452, 1991.
[3] Jaroslav Nosek, “A Precise Measurement of Some
Nonlinear Effects and Its Application to the Evaluation of Nonlinear Elastic Constants of Quartz and GaPO4”, IEEE Trans. On Ultrasonics, Ferro. And Frequency Control., Vol.50, pp. 386-391, 2003.
[4] Jaroslav Nosek, “Drive Level Dependence of the
Resonant Frequency in BAW Quartz Resonators and His Modeling”, IEEE Trans. On Ultrasonics, Ferro. And Frequency Control, Vol.46, pp. 823-829, July 1999.
[5] P. Bates, “Drive Level Dependence versus Residual
Phase Noise Of Fifth Overtone at Cut Quartz Crystals”, IEEE Int. Freq. Control Symp. And Exhibition, pp.233-237, 2000.
[6] B. Ivira, R-Y. Fillit, F. Ndagijimana, P. Benech,
G. Parat, and P. Ancey “Self-Heating Study of Bulk Acoustic Wave Resonators Under High RF Power” IEEE transactions on Ultrasonics, Ferroelectrics, and Frequency Control, vol. 55, no. 1, January 2008.