HAL Id: hal-03009461
https://hal.archives-ouvertes.fr/hal-03009461
Submitted on 17 Nov 2020
HAL is a multi-disciplinary open access
archive for the deposit and dissemination of
sci-entific research documents, whether they are
pub-lished or not. The documents may come from
teaching and research institutions in France or
abroad, or from public or private research centers.
L’archive ouverte pluridisciplinaire HAL, est
destinée au dépôt et à la diffusion de documents
scientifiques de niveau recherche, publiés ou non,
émanant des établissements d’enseignement et de
recherche français ou étrangers, des laboratoires
publics ou privés.
Structures via Control of the Hard/Soft Segment Ratio
Gaëtan Lutzweiler, Julien Barthes, Nihal Engin Vrana, Michel Rawiso, Benoît
Louis, Josselin Mayingi, Albane Carre, Wiebke Drenckhan, Pierre Schaaf
To cite this version:
Gaëtan Lutzweiler, Julien Barthes, Nihal Engin Vrana, Michel Rawiso, Benoît Louis, et al..
Ad-justment of Cell Adhesion on Polyurethane Structures via Control of the Hard/Soft Segment
Ra-tio.
Macromolecular Materials and Engineering, Wiley-VCH Verlag, 2020, 305 (5), pp.2000093.
www.mme-journal.de
Adjustment of Cell Adhesion on Polyurethane Structures
via Control of the Hard/Soft Segment Ratio
Gaëtan Lutzweiler,* Julien Barthes, Nihal Engin Vrana,* Michel Rawiso, Benoît Louis,
Josselin Mayingi, Albane Carre, Wiebke Drenckhan, and Pierre Schaaf
DOI: 10.1002/mame.202000093
1. Introduction
Cell attachment is considered as the first step needed to trigger the prolifera-tion and afterward the colonizaprolifera-tion of porous scaffolds. Cell adhesion is often mediated by integrins, which are trans-membrane proteins composed of α
and β subunits that recognize specific
sequences of peptides to which they can bind to.[1] The most studied adhesion
peptide sequence is the RGD (Arg-Gly-Asp) sequence that is naturally present on some extracellular proteins.[2]
Syn-thetic materials do not have such adhe-sive motifs. Hence, often biomaterial surfaces are coated or functionalized with proteins or peptides to enhance cel-lular adhesion.[3–5] Poly urethane (PU)
is widely used in the medical field due to its biocompatibility as well as the advantageous mechanical properties that can be tailored to match the ones of a given tissue.[6,7] Poly urethanes are
pro-duced by the reaction between a polyol, and an isocyanate, as shown in Figure 1. Sometimes, a chain extender is used to increase the chain length of the final polymer.[8] Polyols have
higher molecular weights than isocyanate, they have a high mobility and flexibility of their chains, which is why they are named as “soft segments.” Isocyanates provide stiffness to the polymer and are often called “hard segments.” Hard and soft segments can separate into two distinct phases (due to their incompatibility) within the polymer matrix where hard segments can self-arrange by π-stacking or hydrogen
bonding forming distinct domains randomly distributed in the soft segment matrix. Phase separation depends on sev-eral factors such as the thermal history of the polymer[9] or
the molecular structure of both the hard and the soft seg-ments.[10] This phase separation has already been studied
in the past by X-Ray photoelectron spectroscopy (XPS),[11]
Fourier Transformed Infrared Spectroscopy (FTIR),[9] and
Small Angle X-ray Scattering (SAXS).[12] It was shown to
influence the mechanical properties.[13] To our knowledge,
only few examples are reported in the literature where the influence of this microphase separation on cell attachment and proliferation on the PU surface is investigated. Yuan et al.[14] produced poly(caprolactone)-based PU and modified
the hard segment fraction in their formulation. They showed
Creating substrates with a similar composition that can either prevent or promote cell adhesion is still a challenging feat. Here, it is shown that a strikingly simple method of tuning the amount of hard segments or isocy-anate index (NCOind) of a polyurethane (PU) film allows to modulate cell
adhesiveness. PU films are synthesized with NCOind of 75, 100, 200, 300 and
400 corresponding to ratios of isocyanate to hydroxyl functions of 0.75, 1, 2, 3, 4, respectively. The adhesive capacity of NIH 3T3 fibroblasts (3T3) and Wharton’s jelly mesenchymal stem cells (WJMSCs) are dependent on the NCOind. For NCOind below 300, no cell adhesion can be observed regardless
of the cell type, whereas for NCOind of 300 and 400 cells adhere to the PU
surface. WAXS and small angle X-ray scattering (SAXS) studies reveal that variations of NCOind allows to modulate the phase separation in PU films.
Porod’s law shows that for NCOind of 300 and 400, the hard–soft segment
interface is sharp. Conversely, samples with smaller NCOind present diffuse
interfaces. Hence, the morphology of the interface between hard and soft domains appears to be a critical feature that correlates with the adhesion capacity of cells.
Dr. G. Lutzweiler, Dr. J. Barthes, A. Carré, Prof. P. Schaaf Institut National de la Santé et de la Recherche Medicale UMR_S 1121, 11 rue Humann, Strasbourg Cedex 67085, France E-mail: gaetanlutzweiler@gmail.com
Dr. N. Engin Vrana Spartha Medical
14B rue de la Canardière, Strasbourg 67100, France E-mail: evrana@sparthamedical.eu
Dr. M. Rawiso, Dr. W. Drenckhan Université de Strasbourg CNRS
Institut Charles Sadron
23 rue de Loess, Strasbourg 67034, France Dr. J. Mayingi
CETIM Grand Est
24a Rue d’Alsace, Illkirch-Graffenstaden 67400, France Dr. B. Louis
ICPEES – Institut de Chimie et Procédés pour l’Énergie l’Environnement et la Santé
UMR 7515 CNRS – Université de Strasbourg 25 rue Becquerel, Strasbourg Cedex 2 67087, France
The ORCID identification number(s) for the author(s) of this article can be found under https://doi.org/10.1002/mame.202000093.
that endothelial cells form a well-organized network on films undergoing microphase separation within the bulk compared to homogenous PU films. The authors argued that cells were sensitive to the phase segregation and especially to the hard segment domains with a higher local stiffness that could help them to form stable focal contacts. The ability of the distinct domains containing hard segments to support cell adhesion was also demonstrated by Nalluri et al.[15] They
gen-erated polyurethanes having poly(ethylene glycol) as soft seg-ments (which prevent cell adhesion), and hard segseg-ments that were composed of either hexamethylene diisocyanate (HDI) or 4,4’-methylenebis (cyclohexyl isocyanate) (HMDI). While HDI-based PU exhibited a phase separation, HMDI-based PU showed that hard and soft segments were more homoge-nously distributed. This was attributed to the fact that HMDI cannot self-organize due to steric hindrance. In another study, Mesenchymal Stem Cells (MSCs) were shown to make stable focal contacts on PU presenting phase separation which was also attributed to the interaction between cells and the hard segment domains. Furthermore, Mi et al.[16] used
two commercial polyurethanes with two hard segment frac-tions. They showed that the polymers become increasingly hydrophobic when the hard segment content increases, and that the protein adsorption is higher when the hard segments content decreases. They demonstrated that 3T3 fibroblasts showed better viability on PU having a higher hard segment fraction despite the fact that those films were more hydro-phobic and that less proteins were adsorbed on their surface. Even if these authors did not investigate whether some phase separation is present within the polymer, these findings highlight the fact that cells respond differently regarding the microstructure of the PU underneath. The study therefore aims to investigate this effect in more detail.
We showed in a previous study that PU scaffold appears as a good candidate for tissue engineering applications but cell colo-nization and survival required surface treatments of PU.[17] As
other studies reported that PU by itself is a poor substrate to support cell adhesion,[18,19] it becomes important to understand
how cell adhesiveness is correlated to PU microstructure and how to improve it especially for tissue engineering where cell adhesion is necessary to obtain a fully colonized and functional scaffold.[20]
In that purpose, we synthesized PU films with different iso-cyanate index (NCOind) (i.e., the ratio of isocyanate to hydroxyl
groups times 100 added during the synthesis) ranging from 75 to 400. We investigated how the changes in isocyanate content affect the microstructure of the PU and correlate this with the capacity of NIH 3T3 fibroblasts (3T3) and Wharton’s Jelly mes-enchymal stem cells (WJMSCs) to attach to the PU surface. Higher NCOind result in more cell attachment and we aimed to
determine the optimal index for cellular adhesion. the control of the adhesion capacity of cells by varying the NCOind appears
to be a simple way to overcome the poor adhesive properties of PU without the need of supplementary surface treatments. We characterize the obtained films in terms of wettability, protein adsorption, surface and bulk chemistry, and phase separation of hard and soft segments within the matrix to establish a cor-relation between the cellular response to the material and its structural features.
We show for the first time that cell adhesion on PU surface depends on the nature of the interface between hard and soft segments and that the nature of the interface is easily con-trolled by the NCOind. Finally, we extrapolate this flat model to
a 3D porous material as a model system for tissue engineering and we investigate if cell colonization can be improved by the modulation of the NCOind.
2. Experimental Section
2.1. Polyurethane Film Synthesis and Casting
Polyurethane films were obtained by mixing all the precursors in the “one shot” method. As sketched in Figure 1a, a polyether triol composed of poly(propylene oxide) (PPO) end-capped with poly(ethylene oxide) (PEO) units (Voranol 6150, Dow, MW 6000,
Figure 1. a) Chemical structure of the PU obtained from the reaction of a polyether triol composed of polypropylene oxide (PPO) x ≈ 30 backbone end capped with polyethylene oxide PEO y ≈ 7 forming the soft segment units and the polyMDI with z ≈ 0 or 1 forming the hard segment units. b) Schematic representation of the PU with the main building blocks.
OH number (OHnumb 29 mg KOH g−1) and a Poly(methylene
Polyphenyisocyanate) (polyMDI Voranate M220b, Dow, with 30.9% of free NCO (%NCO) were mixed together under vig-orous stirring at 20K rpm for 3 min using an Ultra Turrax (IKA T25). 1 mL of this mixture was then cast into the bottom of a 6 well-plate, leading to films of 0.5 mm thickness. All films were let to solidify for 48 h at room temperature. The NCOind
were obtained by the following method given by Hepburn[21] in
which one calculates first the equivalent weights of polyol and isocyanate in order to take into account the differences in their respective functionality.
The polyol equivalent weight EW was calculated via
EW = 56100 = g
OH 1934.5
OH
numb
(1) where 56 100 is the molecular weight of potassium hydroxide expressed in milligrams (used in the titration to estimate the number of free hydroxyl groups). In this case, only one polyol was used and neither water nor catalyst that could contribute to increase the OH number was added. The equivalent weight of polyMDI was determined as
EW = 42 %NCO
NCO (2)
where 42 is the molecular weight of the isocyanate NCO function. In this case the equivalent weight of the isocyanate
EWNCO = 136 g. From the equivalent weights, polyurethane
films were prepared with isocyanate/hydroxyl function ratios of 0.75:1, 1:1, 2:1, 3:1, and 4:1 corresponding to NCOind of 75,
100, 200, 300, and 400. The isocyanate index is by convention 100 times the ratio of free isocyanate functions to free hydroxyl functions that are contained in the initial batch before the reaction.[22]
The well plates with PU films at the bottom were sterilized by UV radiation for 15 min.
2.2. Generation of Porous Scaffold
PU scaffolds were generated by a sphere templating approach already described in the previous paper.[17] Briefly, paraffin
spheres were obtained by an emulsion-dispersion method. 10 g of melting paraffin (Fischer Scientific, mp 58–62 °C) was added to 400 mL water at 70 °C under vigorous stirring (950 rpm) and stabilized by 3 g poly(vinyl alcohol) PVA (Sigma, MW 31 000–50 000 89% hydrolysate). After 10 min, 400 mL of ice cold water was added which solidified instantly the paraffin droplets. Those beads were directly sieved using stainless sieves to obtain bead sizes between 125 and 200 µm (133 µm on average) for the experiments. These paraffin beads were packed in a mold (petri dish of 34 mm in diameter, VWR) and put in an oven for 1 h at 43 °C to promote sintering which created a neck at the contact point between beads. A freshly prepared polyol-isocyanate mix-ture (Section 2.1) was then cast onto the bead assembly and let to infiltrate and solidify. Finally, the paraffin beads were dissolved by Sohxlet extraction in n-hexane at 80 °C for 4 h. The resulting porous scaffold was left to dry under a fume hood for 12 h.
2.3. Expansion of Cells and Cell Seeding
NIH 3T3 fibroblasts (ATCC) were suspended in culture media DMEM (Dulbecco’s modified Eagle’s Media) supplemented with 10% (v/v) of decomplemented Foetal Bovine serum (FBS) and 1% penicillin/streptomycin (v/v) and let to expand in 175 T-flasks within a humidified incubator at 37 °C, 5% CO2.
WJMSCs were isolated from umbilical cords of consenting patients (Authorization body: Inserm, ITMO Santé Publique Pôle Recherche Clinique (PRC)), Authorization number: DC-2015-2364) using a procedure described elsewhere.[23]
WJMSCs were suspended in α-MEM Eagle (Gibco)
supple-mented with 20% of decomplesupple-mented Fetal Bovine Serum (FBS), 1% penicillin/streptomycin/amphotericin, and 1% of L-glutamine and let to proliferate in 175 T-flasks at 37 °C, 5% CO2. WJMSCs were seeded at passage 5 while fibroblasts
were seeded at passage 16. 5 mL of a trypsin-EDTA solution was used to take off the cells and the solution was neutralized with cell media after 6 min in the incubator. 120 000 cells per well plate were seeded in 4 mL of appropriate culture media (depending on the cell type as aforementioned).
2.4. Calcein-Green Staining
Cells were pre-labeled with Calcein-green just before being seeded. Cells were suspended in serum free media, and 5 µL of calcein (Vybrant Cell Adhesion Assay kit V-13181, Ther-moFisher) per million of cells was added and the cell sus-pension was placed in an incubator at 37 °C for 30 min and protected from light. Afterward, cells were centrifuged and re-suspended in classical culture media prior to be seeded. 2.5. DAPI/Phalloidin Staining
Cells were washed two times in PBS and fixed in a 4% paraform-aldehyde in PBS solution for 30 min at room temperature. The fixation solution was then removed and samples were kept in PBS at 4 °C before staining. Cell membrane was first permea-bilized with a solution of 0.1% Triton X-100 in PBS for 10 min, followed by two washing steps with PBS and incubated with a solution of 1% v/v of Bovine Serum Albumin (BSA) for 20 min. Actin filaments were then stained with a solution of fluorescent molecule conjugated Phalloidin (Alexa Fluor 568) at 1/40 v/v in PBS for 30 min. Then, samples were washed two times with PBS for 5 min and subsequently counterstained with a DAPI (4’,6 diamidino-2-phenylindole, PromoKine) solution at a concentra-tion of 1/100 v/v in PBS for 5 min. At the end, samples were washed two times in PBS for 5 min and kept in PBS at 4 °C. DAPI/Phalloidin staining was performed after 7 days of culture in the case of WJMSCs seeded in porous scaffold and after 24 h of culture for 3T3 fibroblasts and WJMSCs seeded on PU films. 2.6. X-Ray Photoelectron Spectroscopy
The X-ray photoelectron spectroscopy (XPS) measurements were carried out in an ultrahigh vacuum (UHV) spectrometer
(Thermo VG Multi lab ESCA 3000) spectrometer equipped with a CLAM4 (MCD) hemispherical electron analyzer. A dual anode Al Kα X-ray source (1486.6 eV) was used as incident radiation.
Survey and high resolution spectra were recorded in constant pass energy mode (100 and 20 eV, respectively).
2.7. Fourier Transform Infrared Spectroscopy
FTIR was carried out for the solid PU films with a Bruker Vertex 70 instrument equipped with an attenuated total reflec-tance (ATR) module. Scans were performed from 400 to 4000 cm−1 with a spectral resolution of 2 cm−1.
2.8. Contact Angle Measurement
Surface wetting properties of the PUs with various NCOind
were obtained by static contact angle measurements with puri-fied water (Milli-Q) at room temperature. The sessile drop technique (Attension theta, Biolin Scientific) was used and the values of the contact angles were obtained by image treat-ment using the software Oneattension. Each experitreat-ment was repeated three times to ensure the reproducibility.
2.9. Confocal Microscopy
Confocal images were taken after 24 h of culture using an inverted Zeiss LSM 710 microscope. Objectives x10 and x20 were used to visualize the cells on the films. The six well plate coated with the PU films was directly placed under the microscope. Excitation/emission wavelengths were 489/556, 578/600, and 360/460 nm for Calcein-green, Alexa Fluor 568 Phalloidin and DAPI, respectively. For FITC-BSA detection to evaluate the amount of protein adsorbed on PU surface, an area of 849 µm × 849 µm was scanned using the same gain (636) for all images. The excitation wavelength was 488 nm at 17.5% intensity and the emission wavelength was 496–563 nm.
2.10. Mechanical Testing
PU films (15 mm thick) were shaped into dumbbells (90 mm long) and stress–strain curves were obtained according to the NF EN ISO 527-1 and NF EN ISO 527-2 standards. Trac-tion tests were performed using a machine of universal assays (Zwick) mounted with a sensor of 200 N. A preload of 1 N was applied and the stretching was performed at a rate of 50 mm min−1 until break. The Young’s modulus was obtained by
cal-culating the initial slope of the stress–strain curves in the linear regime.
2.11. Protein Adsorption Tests
Two tests were conducted to ensure that the results were accu-rate and reliable. The first method was the Bradford method.
Polyurethane samples were cut into discs having 13 mm in diameter and 5 mm height. PU samples with NCOind from 75
to 400 were first immersed in 2 mL FBS for 24 h. After that, samples were rinsed with PBS, and placed in a 24 well plate. The adsorbed proteins were then detached by using a deter-gent solution (3 m urea (Aldrich), and sodium dodecyl sulfate, SDS 5% (Sigma-Aldrich) in PBS) overnight. Aside, a calibra-tion curve was generated by using bovine serum albumin BSA (Sigma) diluted at 1% as the standard protein since the serum in culture media is mainly composed of BSA. The second method consisted in immersing PU samples with different NCOind in 1 mL of a solution of 0.25 mg mL−1 of FITC-BSA
in PBS for 30 min in the dark. Samples were then washed with PBS and left in PBS à 4 °C until observation with con-focal microscopy as described above. Fluorescent intensity was recorded at the surface of each sample using Teflon as control. Although the exact concentration value cannot be obtained, the fluorescent intensity is proportional to the amount of adsorbed proteins, therefore, one expects the same profile as the Brad-ford method.
2.12. Atomic Force Microscopy
Polyurethane films were cast in a petri dish. Once dried, sam-ples were cut into discs having 13 mm in diameter and 1 mm height. Samples were placed under the AFM in air at room temperature.
Experiments were carried out with a multimode AFM 8 mounted with a controller Nanoscope V 64 bits from Bruker. They were conducted in peakforce tapping mode by using a Probe Scan Asyst fluid (0.7 Nm) probe from Bruker. Surface roughness was determined using the software Nanoscope Anal-ysis 1.5 and expressed as root mean square value (RMS). 2.13. Small Angle X-Ray Scattering
SAXS experiments were performed with a diffractometer devel-oped by Molecular Metrology (Elexience in France) that uses a Rigaku Micromax 007HF generator with a copper-rotating anode. The wavelength of the incident X-ray beam is λ = 1.54 Å.
This diffractometer operates with a pinhole collimation of the X-ray beam focused by a multilayer optic designed by Osmic and a two-dimensional gas-filled multiwire detector. The sample-detector distance was set at 0.7 m, leading to a range of scattering vectors covered by the experiment 0.01 < q < 0.32 Å−1.
The scattering vector q is defined by q = (4π/ λ)sin(θ/2), where
λ is the wavelength of the incident beam and θ, the scattering
angle. The q-resolution related to the beam size on the sample and the beam divergence roughly 0.005 Å−1. Copolymer films
of thicknesses of 1 mm were studied. Measurements were per-formed at room temperature.
2.14. Wide Angle X-Ray Scattering
WAXS experiments were carried out with the same diffrac-tometer as the SAXS by using Phosphor imaging plates from
Molecular dynamics as detectors. These plates were set at 0.06 m from the samples, allowing to explore scattering vectors ranging from q = 0.05 to 3.5 Å−1. The same copolymer films of
thicknesses 1 mm were used in the same positions with respect to the incident X-ray beam than for the SAXS experiments (Sec-tion 2.13). Measurements were also performed at room temper-ature. WAXS measurements allow to investigate arrangements at the atomic level while SAXS measurements can probe larger length scale such as nano domains in the polymer.
2.15. Data Treatment
For SAXS, all data were treated according to standard proce-dures for isotropic small angle X-ray scattering.[24] After radial
averaging, the spectra were corrected from electronic noise of the detector, empty cell, absorption and sample thickness. A 55Fe source was used for the corrections of geometrical factors and detector cells efficiency as well as a Silver Behenate sample, for the q-calibration. The normalization to the unit incident flux was then obtained by using water or Lupolen (polyethylene) as standard samples. Nevertheless, such measurements on an absolute scale, scattered intensities I(q) expressed in cm−1, were
not perfectly achieved for the WAXS experiments in this case. The spectra were then locked onto the related SAXS ones. After all these data treatments, the scattered intensities at low q-values only associated with the concentration fluctuations, should still be corrected from the scattering related to the density fluctua-tions. This last correction was done through the subtraction of an additional constant that allows observing a q−4 scattering
behavior characteristic of the existence of sharp interfaces for some samples. Indeed, the “far-away point” method,[25] which
assumes that the density fluctuations are almost identical for the background and the film could not be used here as the density fluctuations were already taking place in a q-range in which the concentration fluctuations are not still negligible (q ≈ 0.3 Å−1). According to such a procedure, the scattered intensity
I(q) at low q-values, containing all the structural information, is
obtained for each PU film.
2.16. Analysis of Elementary Scatterers for X-Ray Experiments The characteristics of the elementary scatterers involved in the SAXS experiments are listed in Table 1. Z is the number of
electrons of the elementary scatterer (E.S.). The coherent X-ray scattering length a (cm) of the E.S. is proportional to Z and defined by the relation
a=0.282 10−12Z (3)
The coherent X-ray scattering length density ρsl (cm) is then obtained through the equation
a vNA
ρ =sl (4)
where v (cm3 mol−1) is the molar volume of the E.S. and N
A (mol−1) Avogadro’s number.
The molar volumes of most of the E.S. involved in the studied polyurethanes are listed in the book of Van Krevelen et al.[26] and summarized in Table 1. For the missing ones the
additivity law of the partial molar volumes was used.
The contrast between the hard and soft segments (CONHPhCH2PhNHOCO and CH2CH(CH3)O)
is then ∆ρ2 = (ρ
s − ρ h)2 = 3.2761 1020 cm−4, assuming an
amor-phous state for both segments. This is justified by the lack of Bragg peaks in Figure 8. It becomes ∆ρ2 = (ρ
s − ρh)2 = 9.9856 1020 cm−4,
when the hard segments are considered in their crystalline state. 2.17. Viability Assay
Cytotoxicity of the different PU samples was tested toward NIH 3T3 fibroblasts via indirect contact method. This experi-ment was performed on extraction vehicle. PU samples were immersed in 1 mL of cell culture medium (DMEM sup-plemented) for 24 h at 37 °C in order to extract all potential harmful monomers (extraction vehicle) In the same time, NIH 3T3 cells were seeded in a 24 well plate at a density of 60 000 cells per well to obtain a cell layer of 80% confluence after 24 h. Then after 24 h, the extraction vehicle is transferred on the cell layer and let in contact for 24 h. MTT test (bromure 3-(4,5-dimethyltiazol-2-yl)-2-5 diphenyl tetrazolium) is then per-formed to assess the metabolic activity of cells and determine the percentage of viability. Viability is normalized with a control which is a cell layer cultured for 48 h without exposure with to extraction vehicle. According to the test standards, a sample is considered cytotoxic if the viability normalized with control is less than 70%.
Table 1. Characteristic parameters of the various elementary scatterers involved in this study. Z is the number of electrons; a is the coherent X-ray scattering length (see Equation (3)); v the molar volume (amorphous state/crystalline state), and ρ the scattering length density. Ph stands for an aromatic cycle especially those present in the polyMDI shown in Figure 1.
E.S. Z v [cm3 mol−1] a [fm = 10−13 cm] ρ [1010 cm−2] CH2CH2O 24 36.74/33.36 67.68 11.09/12.22 CH2CH(CH3)O 32 53.09/48.03 90.24 10.24/11.31 PhCH2Ph 88 147.37/132.68 248.16 10.14/11.26 CONH 22 21 62.04 17.79 OCONH 30 29 84.60 17.57 CONHPhCH2PhNHOCO 140 197.37/177.38 394.80 12.05/13.40
3. Results
In order to see the effect of NCOind on cell adhesion, two types
of cells were seeded on the substrates with different NCOind as
shown in Figure 2. Both 3T3 fibroblasts and WJMSCs adhesion show a clear dependence on the NCOind. A surface which is
effi-cient to promote cellular adhesion results in a cell morphology where cells cover the surface and show a spindle like mor-phology. A threshold value seems to appear between NCOind =
200 and NCOind = 300 for cellular adhesion strength. For PU
films having NCOind < 200, cells have a round shape and
aggre-gate. Starting from NCOind = 300, cells can clearly spread on
the substrate which indicates that they are able to adhere on the material surface. This demonstrates that cell adhesion on PU films was greatly affected by the NCOind. From Figure 2, one
can also notice that the threshold value in the NCOind seems to
be the same for both cell types.
Then, cells were also fixed in paraformaldehyde and stained for F-actin filaments and nucleus by using DAPI/Phalloidin (see Section 2.5 for experimental details) and monitored with confocal microscopy. Obviously the same trend is emerging (Figure S1, Supporting Information) for PU films having an NCOind > 200: we can observe again that both cell types can
spread on the surface, whereas no more cells can be observed on substrate with NCOind lower than 300 implying that the
cel-lular adhesion depends on the PU formulation.
Cell adhesion on artificial substrates is a protein-mediated process. The physico-chemical properties of the substrate can induce conformational changes of the adsorbed proteins or discriminate one given type of protein with respect to another implying a surface concentration that differs from the concen-tration in the media.
In order to see whether this difference in cell spreading originates from differential cytotoxicity of PU films with dif-ferent NCOind, we first tested the cytotoxicity of the samples via
an indirect contact method to investigate the effect potentially harmful products on the cells. For an implantable material to be authorized to be used in the human body, they should have a cell viability of at least 70% after direct or indirect contact with the material. For all the tested samples (i.e., NCOind of 75, 100,
and 400) no cytotoxic effect was observed since the cell viability was always higher than 70% after normalization by the control (Figure S2, Supporting Information).
The response of the cells to PU films with various NCOind
can be extrapolated to 3D structures. We prepared intercon-nected porous materials (as described in Section 2.2) with different NCOind into which we seeded WJMSCs. Details on
the scaffold production and the cell culture are published elsewhere.[17] We kept the same porous structure, using a
PU that was synthesized with two different NCOind showing
opposite cell adhesion when on films: NCOind = 100 which
prevents cell adhesion and NCOind = 400 which promotes
cell attachment. We seeded only WJMSC cells because the cell response to the NCOind was the same for both 3T3 and
WJMSCs. Figure 3 shows that in the case of NCOind of 400,
groups of cells spread well within the pores of the scaffold whereas in samples with an NCOind 100 nearly no cells were
observed after 7 days. As for the adhesion on flat substrates, one thus observes that cell colonization in 3D is also facili-tated in scaffolds made by PU with an NCOind of 400
com-pared to 100.
Since the attachment of cells to a surface is often mediated by protein adsorption, we examined if the amount of adsorbed proteins depends on the NCOind. We quantified the amount
of proteins adsorbed onto the PU surface by two methods, namely the Bradford method and by recording the fluorescence intensity of FITC-BSA adsorbed on the PU surface (see Sec-tion 2.11) to ensure the reliability. We found that for samples having NCOind of 75 and 100, less proteins were adsorbed onto
the PU surface (437 and 495 µg mm² respectively) compared
Figure 2. 3T3 fibroblasts (top row) and WJMSCs (bottom row) seeded on PU films with various isocyanate indexes after 24 h, cells were stained with Calcein-green.
to samples with NCOind higher than 200 whose adsorbed
pro-tein amounts are 758, 712 and 680 µg mm² for NCOind of 200,
300, and 400 respectively (Figure S3, Supporting Information). But even if less protein adsorb onto the substrate with 75 and 100 NCOind, this cannot explain alone why cell adhesion seems
prohibited on these films. Indeed, the amount of adsorbed pro-teins on samples with NCOind 200 is at the same level as that of
samples with NCOind of 300 and 400 yet, cells were not able to
adhere the sample with NCOind of 200.
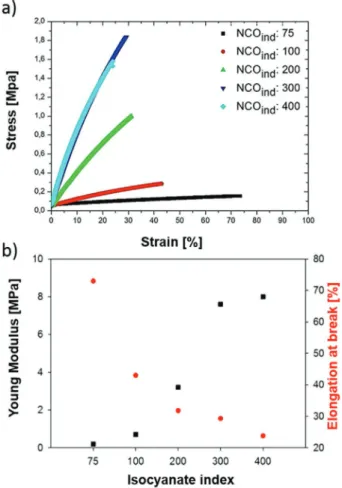
To understand how the changes in isocyanate content can affect PU properties, and subsequently the adhesion capacity of the cells, we investigated the mechanical properties of the samples. To this end, tensile tests were performed on 1-mm-thick PU films of variable NCOind. Typical stress–strain curves
are shown in Figure 4a. Curves are shown until rupture of the PU film. For all NCOind, they show a nearly linear stress–strain
dependence until rupture. As the isocyanate index increases, the initial slope of strain versus stress increases as well. Hence, the Young’s modulus, which is given by this slope, increases with the amount of isocyanate used in the formulation. This is a well-known effect, since hard segments contribute to make the polymer stiffer.[27] The obtained Young’s moduli
and the elongation at break are summarized in Figure 4b. For an isocyanate index of 75, the Young’s modulus was 0.2 MPa while it was 8 MPa for NCOind of 400. The Young’s modulus
increases significantly (nearly linearly) with isocyanate content until an NCOind of 300. Above this value the increase in
mod-ulus with NCOind is less pronounced but as we only have one
data point above the NCOind: 300, we cannot conclude that this
is a general trend. Therefore, cells start to adhere on PU films with Young’s moduli around 8 MPa. Nevertheless, care must be taken to not hurriedly correlate those values to the ability of cells to sense the substrate stiffness. Indeed, the range of Young’s moduli in substrate stiffness to which cells are sensi-tive is commonly between tens to hundreds of kPa[28] which are
significantly smaller than the Young’s moduli measured for all our samples. Therefore, we hypothesize that for films having Young’s moduli above 0.7 MPa, cells are not sensitive to the averaged modulus that is measured by the mechanical testing but rather to the more local material properties. It is also note-worthy that the elongation at break decreases with increasing NCOind (Figure 4b). For the lowest index (i.e., NCOind:75), the
elongation at break is 73% compared to 24% for NCOind of 400.
These differences can be explained by the increased crosslink density with increasing NCOind. Therefore, variation of the
NCO/OH functions in the formulation of polyurethane allows adjusting finely the mechanical properties,[29] but these changes
cannot be considered as the main driving factor in the differ-ence in cell behavior.
Infrared spectroscopy was also employed to investigate the differences in chemical functions for the different samples. The FTIR spectra obtained for PUs with increasing NCOind
are shown in Figure 5. An increase in the NCO content of the polymer shows an increase in the intensity of the band at 2274 cm−1 associated with free NCO groups[22] as well as an increase
of the bands at 1597 and 1411 cm−1 which are attributed to
aro-matic and isocyanurate vibrations respectively. Peaks at 1539 and 1727 cm−1 correspond to amide I and II respectively.[30]
On Figure 5a, one can clearly see that peaks associated to free NCO groups increase with increasing NCOind. This is rather
obvious since unreacted isocyanate functions remain left for NCOind greater than 100. However, due to the highly reactive
nature of isocyanate, free NCOind tend to react with other free
NCO groups to form isocyanurates which are indeed present by looking at the band at 2274 cm−1 (Figure 5b).
Addition-ally, NCO groups are also known to be able to react with pri-mary and secondary amines.[31] Urea, biuret, or allophanates
Figure 3. Images of WJMSC cells after 7 days of cell culture in a PU scaf-fold having an NCOind of 100 (left) and 400 (right). Cells were stained with DAPI/Phalloidin for the visualization of F-actin filaments and nucleus respectively.
Figure 4. a) Stress–strain curve of polyurethane films obtained upon stretching and b) their corresponding Young’s modulus and elongation at break (red plots).
are common products of these reactions.[31] These side
prod-ucts are associated to the peaks at 1539 and 1727 cm−1
cor-responding to amide I and II vibrations respectively. In Figure 5b, the curves for NCOind 75 and 100 show the same
profile whereas, for higher indexes, all the peaks associated to species that result from the reaction of free isocyanates groups are increasing.
To gain more insight into the process by which cells can adhere to the PU surface, one needs to characterize the outer-most surface of the considered material. It is well known that the surface chemistry of polyurethanes tends to be different from the bulk composition.[32] Hence, X-Ray Photoelectron
Spectroscopy (XPS) analyses were carried out to evaluate what are the changes induced by these specific NCOind on surface
chemistry.
The respective peaks of the O1S, C1S, and N1S orbitals
are shown in Figure 6a,b,d. We were not able to obtain the spectra of the sample with an NCOind of 75 because the
ultra-high vacuum could not be achieved. This could be due to
unreacted monomers that leached out of the sample. Peaks at 284.6 and 286.5 eV on the C1S spectra are attributed to
aliphatic carbons and carbons from COC ether func-tions respectively.[33] The peak at 400 eV on the N
1S nitrogen
curve (Figure 6b) corresponds to nitrogen atoms in the ure-thane and/or urea bonds.[11] Interestingly, when the NCO
ind
increases, the nitrogen percentage at the surface does almost not vary for NCOind of 100, 200, and 300 where values are
comprised between 0.3% and 0.6%. Nitrogen content increases more for NCOind 400 to reach 1.9%. As nitrogen
is only present on hard segments, one can use the nitrogen quantification as an indication of the amount of hard seg-ments at the topmost surface of the PU. These findings are in good agreement with other studies which demonstrated that hard segment content at PU surface remains fairly con-stant.[34,35] One generally accepted explanation is that PU
outermost surface is enriched in soft segments to lower the surface energy.[36,37] The higher nitrogen percentage in the
sample with an NCOind of 400 is consistent with the study
of Nakamae et al.[36] who also observed that hard segments
are more present at the surface when their concentration is increased. However, XPS analysis is performed under high vacuum, and these conditions are not necessarily accurate to describe the surface in aqueous media. Nevertheless, XPS measurements allow us to identify the chemical species formed in the PU. Of particular interest is the spectrum asso-ciated to nitrogen which is never shifted. This implies that the side products formed by the reaction of free isocyanate with other groups than hydroxyl are not present at the top-most surface of the samples.
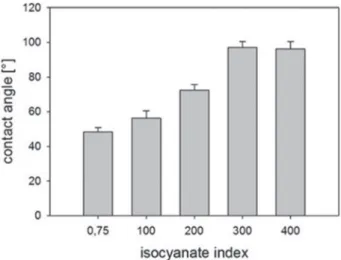
We also performed contact angle measurements of water drops deposited on the PU surfaces (Figure 7). Contact angles progressively increase from 48° to 96° with increasing NCOind
up to an NCOind of 300, that is, the samples are becoming
increasingly hydrophobic. Beyond this value, the contact angle seems constant at 100°. Since the only parameter that was varied is the ratio of isocyanate to hydroxyl function in the PU synthesis, differences in contact angle values can be correlated to changes in isocyanate content from one sample to another. Furthermore, aromatic rings, being hydrophobic compound, contained in the polyMDI are assumed to contribute to the enhanced hydrophobicity. This appears contradictory with the XPS analysis where surface chemistry was shown to be the same regardless of the NCOind. One can therefore assume that
surface rearrangement at the PU/water interface differs from the PU/air interface.
Surface roughness was also investigated by AFM meas-urement (Table S1, Supporting Information). The root mean square values show a maximum at 12.9 nm for an NCOind of 75
and 1.6 nm for an NCOind of 400. Therefore, the contact angle
value can depend on both differences in surface chemistry and on surface roughness.
We also investigated the microscopic structure of the PU films using both WAXS/SAXS methods. Figure 8a shows the combined results from both techniques. The region cor-responding to WAXS (i.e., for q > 0.3 Å−1) displays a unique
and similar halo for every sample indicating an amorphous system. Indeed, no Bragg peak appears in this q-range for any of the NCOind, indicating the absence of measurable crystalline
Figure 5. a) FTIR spectra of PU films with various NCOind and b) a higher magnification of the region between 1350 and 1850 cm−1.
structures. This can be explained by the steric hindrance of PPO chains and the oligomeric nature of polyMDI compared to its monomeric form MDI which is known to be able to crystallize.[38]
From the SAXS measurements (i.e., for q < 0.3 Å−1) shown
in Figure 8a a clear evidence of micro phase separation can be observed as attested by the peaks around 0.08 Å−1. This can be
interpreted as a result of the presence of small domains sepa-rated by 7.7 nm (NCOind: 75) and 7.9 nm (NCOind: 400)
respec-tively which is quite similar. We interpret this as the signature of hard domains embedded in soft matrix.[39,40] The peak
inten-sity increases with increasing NCOind. No second- or third-order
peaks are visible, ruling out the possibility that hard domains display translational order within the soft segments matrix. If the interface between the hard and soft domains was sharp, one would expect a decrease of the tail of the curve for small angles (i.e., q < 0.3 Å−1) proportional to q−4 according to Porod law.[41]
Hence, in such conditions one can use the Porod’s invariant[41]
Q defined as Q 1 q I q q 2 2 ( )d 2 0
∫
π = ∞ (5) and Q= ∆ρ φ φ2 s h= ∆ρ φ2 s(1−φs) (6)where q is the scattering vector, φs and φh are the volume
fraction of the soft and hard domains, respectively, and ∆ρ² = (ρs − ρh)² is the square of the difference of the scat-tering length density of the electrons between hard and soft domains. We do not observe this slope because the peak asso-ciated with the density fluctuations at 1.5 Å−1 starts very close
to the peaks associated with the phase separation. Therefore, we suppose that the contribution of the second peak at large angles (q ≈ 0.076 − Å−1) may overlap the peak associated with
the phase separation. However, by subtracting the contribu-tion of the density fluctuacontribu-tions (see Seccontribu-tion 2.15), one obtains
curves in which the tail of the SAXS region is decreasing as q−4 since I q S V q q→∞ = ∆π ρ lim, ( ) 2 2 1 4 (7)
where S/V is the total area of the interfaces divided by the total volume of the sample. By plotting q4 I(q) as a function
of q (Figure 8b), one should therefore obtain a plateau for the
q values > qpeaks when the two phases are separate by sharp
interfaces. This plateau is observed for samples having an NCOind of 300 and 400, as seen in Figure 8b. This plateau starts
at q ≈ 0.15 Å−1 and is quite short.
Even samples with NCOind of 300 and 400 show a decrease
of their respective q4I(q) versus q curves at a given point around
0.22 Å. This means that some diffuse interfaces are also present within these systems but to a much lower extend. According to Buckley et al.,[42] interfaces are diffuse when hard and soft
segments are interpenetrating and the separation between hard and soft domains is not sharp anymore. For diffuse interfaces, the evolution of the tail of the curves of I(q) obeys the following law[43] lim 4 ( ) 2= ∆π ρ2 exp(− 2σ2) →∞q I q S V q q (8) or, I q S V q q lim ln[q ( )] ln 24 = π ρ∆ 2 2σ2 − →∞ (9)
where σ is related the average width l lof the diffuse interface l
between the hard and soft domains by l= 2πσ when using a model describing a sigmoidal interface.[44] From Equation (9),
by plotting ln[q4I(q)] as a function of q² (Figure 9), we obtain
curves whose slope is related to the width of the diffuse inter-face. As seen in Figure 9, the width of the interface increases with decreasing NCOind. This is in accordance with our
obser-vations in Figure 8 since samples with NCOind of 300 and 400
display a plateau consistent with a sharp interface. We find that the width of the interface of these two samples is l = 3.8 and 5.3 Å respectively. Samples with lower NCOind have a more diffuse
interface whose thickness increases from 7.6 Å (NCOind: 300) to
9.9 Å (NCOind: 75).
Figure 7. Static contact angle measurement of ultrapure water for PU films with various NCOind.
Figure 9. Evolution of ln [q4I(q)] as a function of q2 for samples with NCOind of 75 to 400. The slope of each curves provides the square width l2 of the diffuse interface, the calculated width l is provided in the caption for each sample.
Figure 8. Evolution of the scattered intensity (log scale) measured by SAXS/WAXS for PU samples with various NCOind a) the dashed line indi-cates the SAXS/WAXS transition. b) Porod representation for the different samples, the dashed line indicates the plateau.
From the knowledge of the height of the plateau in Figure 8, one can determine the total surface area S of the interfaces divided by the volume of the sample V. Moreover, from the product of volume fractions of hard and soft segments φsφh
used in the batch (Supporting Information) one can estimate the Porod inhomogeneities length lp (see Equation (S2), Sup-porting Information) which correspond to an average radius of the domains. We determined lp to be 2.7 and 2.3 nm for an NCOind of 400 and 300, respectively. The absence of a plateau
for samples with NCOind below 300 prevents us from extracting
an accurate value of S/V from the curves in Figure 8; hence, no value for the radius of the domains in samples with NCOind
below 300 can be provided in this study.
A schematic representation of the PU microstructure with sharp and diffuse interfaces is shown in Figure 10a,b.
Moreover, by integrating the curves q²I(q) versus q (see Figure S4, Supporting Information) one can obtain the Porod invariant Q expressed in Equation (5), and compare this value to the theoretical one Qt (see Table S2, Supporting information) obtained from the known volume fractions of both polyol and isocyanate added during synthesis and from ∆ρ² in Table 1. One can then define a degree of phase separation which is the experimental Q-values of our samples expressed as percentage of the theoretical Qt-values (system with purely sharp inter-faces). We obtained respectively 81% and 82% for NCOind of
300 and 400. This illustrates again that sharp interfaces coexist with diffuse interfaces, but the degree of phase separation is high enough to form domains. We hypothesize that it is these domains that support cell adhesion.
We have found that both cell types, 3T3 and WJMSCs, could adhere on PU surface that exhibits phase separation between hard and soft segments at the condition that the hard/soft ment interface is sharp. Conversely, PU, whose hard/soft seg-ments interface is diffuse, do not promote cell attachment. These findings are summarized in Figure 10. For samples
with NCOind of 300 and 400, we estimated the size of the hard
domains through Porod’s law as 2.3 to 2.7 nm for NCOind of
300 and 400 respectively. The interdomain distance was deter-mined by the position of the peaks in the SAXS curve Figure 8a and we found values between 7.1 and 8 nm without clear trend between the NCOind.
4. Discussion
The adhesion of cells on a synthetic substrate is not straight-forward since these materials lack the binding motifs that are found in the extracellular matrix (ECM). The use of surface modifications or coatings is widespread to improve the surface bioactivity regarding cell behavior inside the body or in vitro. Such approaches tend to be time-consuming (covalent immo-bilization), and costly (addition of specific ECM molecules), sometimes temporary (plasma treatment[17]) and rarely highly
efficient (due to stability issue, detachment etc.) which hamper their applications in the medical domain. However, some syn-thetic materials can promote cell adhesion and subsequently support cell proliferation. The understanding of the intrinsic properties of such materials is important for applications in regenerative medicine or tissue engineering. We propose here a simple way to modulate the adhesion of both WJMSCs and 3T3 fibroblasts by tailoring the isocyanate index of PUs. In particular, we show that a clear threshold exists in the isocy-anate index beyond which both cells types adhere easily on the surface. As the first glance, one may expect that for NCOind
below 100, the excess of hydroxyl groups would render the material more hydrophilic and thus increase the cellular adhe-sion. Indeed, several studies report that hydrophilic surfaces are more likely to allow cell attachment,[45] but the correlation
between contact angle values and the cellular adhesion is not established in a material dependent manner yet.[46] Here we
showed that the more hydrophobic surfaces (i.e., NCOind of 300
and 400) allow both cell types to adhere on our PU films. Cell adhesion appears at a threshold value of the NCOind between
200 and 300. As the interaction of cells with the substrate is directed by the outermost surface, we evaluated the changes in surface chemistry associated with changes in NCOind.
As shown in our XPS measurements (Figure 6), chemical species are the same for all samples and the outmost layer is enriched in soft segments. This is consistent with the studies of Hearn et al.[47] who conclude that the difference in
composi-tion between the surface and the bulk material is due to sur-face rearrangements to minimize the sursur-face energy. However, care must be taken in this assumption since XPS are conducted under ultra-high vacuum and these conditions cannot capture the “real” surface arrangement when samples are in aqueous conditions. Moreover, several other authors reported[48,49] that
the PU surface is a dynamic environment and that undergoes rearrangement that depend on the hydration time. Neverthe-less, XPS study allowed to determine the chemical nature of the species generated in the PU.
Protein adsorption is also a key element that is the first step in the adhesion process. We showed that the amount of proteins adsorbed onto the material surface is nearly the same for all the samples except for the ones with lower NCOind (100 and 75). We
Figure 10. Schematic representation of PU structure with phase separa-tion when the interface between hard and soft segments is a) diffuse and b) sharp.
expect that in these later cases some free ethylene glycol groups repel the adsorption of proteins.[50] Nevertheless, samples with
NCOind of 200, 300, and 400 have similar quantities of proteins
adsorbed onto the PU substrate but cell do not adhere to PU with 200 as NCO index. Hence the modulation of cell adhe-sion cannot be explained by the argument of increased protein adsorption only.
The main hypothesis which we put forward here to explain the cell response with NCOind is related to the segmented
structure of the polyurethane. It is well known that the polyu-rethane microstructure is well described as a biphasic system where hard segments form distinct domains scattered within a matrix of soft segments.[51] This phase separation can be
con-trolled by several parameters such as the molecular weight of polyols,[52] the type of chain extender,[53] or the amount of
isocy-anate used in the formulation. Hsu et al.[48] demonstrated that
phase separation in poly(carbonate urethane) is important to support endothelial cell adhesion and proliferation compared to PU where hard and soft segments are homogenously mixed and therefore do not form any domains. Therefore, when a PU surface displays clear nanodomains, cells may sense these het-erogeneities and preferentially attach to these hard domains. Using WAXS and SAXS, we demonstrated that our PUs exhibit a phase separation for all our experimental conditions. Nalluri et al.[15] showed that PU having hard segment domains
sepa-rated with non-adherent PEG soft segment allowed for MSCs to spread and adhere on the surface on the contrary to PUs that do not exhibit any phase separation. The same trend was observed by Yuan et al.[14] for endothelial cells. Furthermore,
Hao et al.[16] produced thermoplastic polyurethane and showed
that 3T3 fibroblasts were able to adhere better on PU with high hard segment content than on those having smaller hard seg-ment content. They also demonstrated that protein adsorption was higher when decreasing the amount of hard segments even though cells could not adhere on those surfaces.
We confirmed that phase separation in PU can be controlled by the NCOind. We used SAXS and WAXS methods to
ana-lyze the degree of phase separation within the polymer and we demonstrate that even if phase separation is confirmed for all samples, the nature of phase separation between hard and soft segments is different. Our analysis shows that the existence of domains enriched with either hard or soft segments within the polymer is not enough to promote cellular adhesion, but that the “quality” of phase separation is the important feature. Using Porod’s law,[43] we showed that samples with NCO
ind of 300 and
400 display sharp interfaces, indicating a more complete phase separation. This is attested by the plateau in Figure 8b which indicates that I(q)∝q−4 at the tail of the SAXS curve which is
con-sistent with systems with sharp interfaces, and thus, more com-plete phase separation.[42,54] On the other hand, samples with
NCOind of 75, 100, and 200 exhibit a more pronounced decrease
of the tail of the peak at small angles by looking at the curves in Figure 8b which indicates that the interfaces between hard and soft segments are diffuse. Therefore, hard domains are not only composed of hard segments but also of soft segments that are interpenetrated. The dependence of the degree of phase separa-tion on the NCOind was already shown by Saiani et al.[55]
Moreover, the isocyanate index is also contributing to the extent of phase separation within the system. When the degree
of phase separation is high enough, interfaces are sharp, and the separation between hard and soft domains is clear. These domains form islets that could allow the cells to adhere on the surface. It was already demonstrated that for copolymers that undergo phase separation, the dispersed phase can be used as islet to allow cells to forms focal contacts while the continuous phase (non-adhesive) contributes to the overall mechanical properties of the polymer.[56] Besides, the domains in this study
are disorganized in space. This is, in fact, an advantage for cell adhesion as Dalby et al.[57] demonstrated that randomly
distrib-uted nano pits are more likely to promote cell adhesion and MSCs osteogenesis compared to organized pit (i.e., in square and hexagonal).
The exact mechanism by which cells can be attached on PU surface via microdomains has yet to be elucidated. The wet-tability properties of a given material affect drastically protein adsorption and conformation as demonstrated by Tzoneva et al.[58] Therefore, we hypothesize that microdomains induce
conformational changes on the adsorbed proteins which in turn mediate cell adhesion which was also proposed by Groth et al.[59]
who showed that platelet adhesion on PU surface depend on hard segment content and probably on proteins conformation.
5. Conclusion
We generated polyurethane films with controlled NCOind.
We demonstrated that the cell attachment is linked with the NCOind and we showed that both 3T3 fibroblasts and WJMSCs
were able to attach on the PU surfaces which have an NCOind
higher than or equal to 300. In order to understand the under-lying reason for such differences regarding cell adhesion, we further characterized our substrates in terms of surface wetta-bility, surface chemistry, Young’s modulus, and structure prop-erties. We demonstrated that the NCOind influences the degree
of phase separation within the polymer. For NCOind of 300
and 400, phase separation is more complete and interfaces are sharp whereas for NCOind below 300, the interfaces are diffuse.
This implies that in this later case the hard domains are not only composed of hard segments but also contain a fraction of soft segments. This may explain why cells adhere only on PU with indexes higher than 300 since it is the hard domains that were already found to favor cell adhesion. We finally extrapo-lated these results from flat surfaces to a tridimensional scaf-fold. We showed that this cell adhesiveness is also maintained when cultured in 3D which is a promising way to combine a controlled microarchitecture of the scaffold with nano-cues to support cells adhesion for tissue engineering applications.
Supporting Information
Supporting Information is available from the Wiley Online Library or from the author.
Acknowledgements
The authors thank Christophe Contal for his AFM analysis as well as Geraldine Koenig for scientific discussions. The authors also thank Robin
Bollache for technical support. The technical assistance from Dr. Vasiliki Papaefthimiou (ICPEES) was greatly appreciated. Moreover, Guillaume Fleith’s help for diffusion experiments was also highly appreciated and the authors thank him for that. The authors also thank FoamPartner for having supplied reactants. This work has been published within the IdEx Unistra framework (Chaire W. Drenckhan) and has, as such, benefited from funding from the state, managed by the French National Research Agency as part of the “Investments for the future” program. The work was also supported by the Institut Carnot MICA (project DiaArt) and by an ERC Consolidator Grant (agreement 819511 – METAFOAM). The authors thank Horizon 2020 PANBioRA (Grant agreement No 760921) as well as the grant of doctoral school of physics and physical chemistry of Strasbourg (GL).
Conflict of Interest
The authors declare no conflict of interest.
Keywords
hard segments, isocyanate index, phase separation, polyurethane, wharton’s jelly mesenchymal stem cells
Received: February 11, 2020 Published online: March 20, 2020
[1] R. O. Hynes, Cell 1992, 69, 11.
[2] M. H. Sonntag, J. Schill, L. Brunsveld, ChemBioChem 2017, 18, 441. [3] U. Hersel, C. Dahmen, H. Kessler, Biomaterials 2003, 24, 4385. [4] C. J. Wilson, R. E. Clegg, D. I. Leavesley, M. J. Pearcy, Tissue Eng.
2005, 11, 1.
[5] K. S. Siow, L. Britcher, S. Kumar, H. J. Griesser, Plasma Processes Polym. 2006, 3, 392.
[6] S. A. Guelcher, Tissue Eng., Part B 2008, 14, 3.
[7] P. Vermette, H. J. Griesser, G. Laroche, R. Guidoin, Biomed. Appl-icat. Polyurethanes, Landes Bioscience, Georgetown, TX 2001. [8] Y.-K. Jhon, I.-W. Cheong, J.-H. Kim, Colloids Surf. A 2001, 179, 71. [9] H. S. Lee, S. L. Hsu, Macromolecules 1989, 22, 1100.
[10] S. Abouzahr, G. L. Wilkes, J. Appl. Polym. Sci. 1984, 29, 2695. [11] B. J. Tyler, B. D. Ratner, D. G. Castner, D. Briggs, J. Biomed. Mater.
Res. 1992, 26, 273.
[12] Y. Li, T. Gao, B. Chu, Macromolecules 1992, 25, 1737.
[13] H. N. Ng, A. E. Allegrezza, R. W. Seymour, S. L. Cooper, Polymer. 1973, 14, 255.
[14] Y. Yuan, C. Cheah, A. Arzumand, J. Luo, G. R. Krishnan, D. Sarkar, Technology 2016, 04, 139.
[15] S. M. Nalluri, G. R. Krishnan, C. Cheah, A. Arzumand, Y. Yuan, C. A. Richardson, S. Yang, D. Sarkar, Mater. Sci. Eng. C. 2015, 54, 182. [16] H.-Y. Mi, X. Jing, M. R. Salick, T. M. Cordie, X.-F. Peng, L.-S. Turng,
J. Biomed. Mater. Res., Part B 2015, 103, 960.
[17] G. Lutzweiler, J. Barthès, G. Koenig, H. Kerdjoudj, J. Mayingi, F. Boulmedais, P. Schaaf, W. Drenckhan, N. E. Vrana, ACS Appl. Mater. Interfaces 2019, 11, 19819.
[18] W. K. Nichols, D. Gospodarowicz, T. R. Kessler, D. B. Olsen, ASAIO J. 1981, 27, 208.
[19] H.-B. Lin, W. Sun, D. F. Mosher, C. Garcia-Echeverria, K. Schaufelberger, P. I. Lelkes, S. L. Cooper, J. Biomed. Mater. Res. 1994, 28, 329.
[20] E. S. Place, N. D. Evans, M. M. Stevens, Nat. Mater. 2009, 8, 457. [21] C. Hepburn, Polyurethane Elastomers, Springer Science & Business
Media, Dordrecht 2012.
[22] M. Modesti, A. Lorenzetti, Eur. Polym. J. 2001, 37, 949.
[23] L. Aubert, M. Dubus, H. Rammal, C. Bour, C. Mongaret, C. Boulagnon-Rombi, R. Garnotel, C. Schneider, R. Rahouadj, C. Laurent, S. C. Gangloff, F Velard, C Mauprivez, H. Kerdjoudj, Int. J. Mol. Sci. 2017, 18, 2210.
[24] M. F. Butler, A. M. Donald, W. Bras, G. R. Mant, G. E. Derbyshire, A. J. Ryan, Macromolecules 1995, 28, 6383.
[25] P. Lindner, T. Zemb, Neutron, X-Ray and Light Scattering: Introduction to an Investigative Tool for Colloidal and Polymeric Systems, North-Holland, 1991, ISBN: 0 444 88946 9.
[26] D. W. Van Krevelen, K. Te Nijenhuis, Properties of Polymers: Their Correlation with Chemical Structure; Their Numerical Estimation and Prediction from Additive Group Contributions, Elsevier, Amsterdam 2009.
[27] R. J. Zdrahala, R. M. Gerkin, S. L. Hager, F. E. Critchfield, J. Appl. Polym. Sci. 1979, 24, 2041.
[28] D. E. Discher, P. Janmey, Y. Wang, Science 2005, 310, 1139.
[29] I. R. Clemitson, Castable Polyurethane Elastomers, CRC Press, Boca Raton 2015.
[30] M. M. Bernal, M. A. Lopez-Manchado, R. Verdejo, Macromol. Chem. Phys. 2011, 212, 971.
[31] H. Okuto, Die Makromolekulare Chemie 1966, 98, 148. [32] S. C. Yoon, B. D. Ratner, Macromolecules 1988, 21, 2392.
[33] H.-B. Lin, C. Garcia-Echeverria, S. Asakura, W. Sun, D. F. Mosher, S. L. Cooper, Biomaterials 1992, 13, 905.
[34] Y. Deslandes, G. Pleizier, D. Alexander, P. Santerre, Polymer 1998, 39, 2361.
[35] B. S. Kim, H. Y. Jeong, B. K. Kim, Colloids Surf. A 2005, 268, 60. [36] K. Nakamae, T. Nishino, S. Asaoka, Sudaryanto, Int. J. Adhes. Adhes.
1996, 16, 233.
[37] D. K. Chattopadhyay, B. Sreedhar, K. V. S. N. Raju, J. Polym. Sci., Part B: Polym. Phys. 2006, 44, 102.
[38] L. Ning, W. De-Ning, Y. Sheng-Kang, Polymer. 1996, 37, 3577. [39] A. J. Ryan, W. R. Willkomm, T. B. Bergstrom, C. W. Macosko,
J. T. Koberstein, C. C. Yu, T. P. Russell, Macromolecules 1991, 24, 2883. [40] S. Velankar, S. L. Cooper, Macromolecules 1998, 31, 9181.
[41] J. T. Koberstein, R. S. Stein, J. Polym. Sci.: Polym. Phys. Ed. 1983, 21, 1439.
[42] L. J. Buckley, P. T. Hammond, M. F. Rubner, Macromolecules 1993, 26, 2380.
[43] J. T. Garrett, J. S. Lin, J. Runt, Macromolecules 2002, 35, 161. [44] J. T. Garrett, J. Runt, J. S. Lin, Macromolecules 2000, 33, 6353. [45] C. H. Kim, M. S. Khil, H. Y. Kim, H. U. Lee, K. Y. Jahng, J. Biomed.
Mater. Res. Part B Appl. Biomater 2006, 78B, 283.
[46] M. R. Alexander, P. Williams, Biointerphases 2017, 12, 02C201. [47] M. J. Hearn, B. D. Ratner, D. Briggs, Macromolecules 1988, 21,
2950.
[48] S. Hsu, Y.-C. Kao, Macromol. Biosci. 2004, 4, 891.
[49] L.-C. Xu, J. Runt, C. A. Siedlecki, Acta Biomater.. 2010, 6, 1938. [50] J. G. Archambault, J. L. Brash, Colloids Surf., B 2004, 33, 111.
[51] T. K. Kwei, J. Appl. Polym. Sci. 1982, 27, 2891.
[52] T.-L. Wang, T.-H. Hsieh, Polym. Degrad. Stab. 1997, 55, 95. [53] K. Gisselfält, B. Helgee, Macromol. Mater. Eng. 2003, 288, 265. [54] J. W. C. Van Bogart, P. E. Gibson, S. L. Cooper, J. Polym. Sci.: Polym.
Phys. Ed. 1983, 21, 65.
[55] A. Saiani, C. Rochas, G. Eeckhaut, W. A. Daunch, J.-W. Leenslag, J. S. Higgins, Macromolecules 2004, 37, 1411.
[56] M. J. Dalby, M. O. Riehle, H. J. H. Johnstone, S. Affrossman, A. S. G. Curtis, Tissue Eng. 2002, 8, 1099.
[57] M. J. Dalby, N. Gadegaard, R. Tare, A. Andar, M. O. Riehle, P. Herzyk, C. D. W. Wilkinson, R. O. C. Oreffo, Nat. Mater. 2007, 6, 997.
[58] R. Tzoneva, M. Heuchel, T. Groth, G. Altankov, W. Albrecht, D. Paul, J. Biomater. Sci., Polym. Ed. 2002, 13, 1033.
[59] T. H. Groth, K. Klosz, E. J. Campbell, R. R. C. New, B. Hall, H. Goering, J. Biomater. Sci., Polym. Ed. 1995, 6, 497.