Publisher’s version / Version de l'éditeur:
Virginia Transportation Research Council Final Contract Report, 2009-01-01
READ THESE TERMS AND CONDITIONS CAREFULLY BEFORE USING THIS WEBSITE.
https://nrc-publications.canada.ca/eng/copyright
Vous avez des questions? Nous pouvons vous aider. Pour communiquer directement avec un auteur, consultez la
première page de la revue dans laquelle son article a été publié afin de trouver ses coordonnées. Si vous n’arrivez pas à les repérer, communiquez avec nous à [email protected].
Questions? Contact the NRC Publications Archive team at
[email protected]. If you wish to email the authors directly, please see the first page of the publication for their contact information.
NRC Publications Archive
Archives des publications du CNRC
For the publisher’s version, please access the DOI link below./ Pour consulter la version de l’éditeur, utilisez le lien DOI ci-dessous.
https://doi.org/10.4224/20374390
Access and use of this website and the material on it are subject to the Terms and Conditions set forth at
Development of performance-based guidelines for selection of
bituminous-based hot-poured pavement crack sealants: an executive summary report
Al-Qadi, I. L.; Masson, J.-F.; Yang, S. H.; Fini, E.; McGhee, K. K.
https://publications-cnrc.canada.ca/fra/droits
L’accès à ce site Web et l’utilisation de son contenu sont assujettis aux conditions présentées dans le site LISEZ CES CONDITIONS ATTENTIVEMENT AVANT D’UTILISER CE SITE WEB.
NRC Publications Record / Notice d'Archives des publications de CNRC:
https://nrc-publications.canada.ca/eng/view/object/?id=9d7a1cf5-d3b1-4f65-b1e6-802ce9a5c9c7 https://publications-cnrc.canada.ca/fra/voir/objet/?id=9d7a1cf5-d3b1-4f65-b1e6-802ce9a5c9c7
http://www.nrc-cnrc.gc.ca/irc
A fra m e w ork for se rvic e e nt e rprise w ork flow sim ula t ion ba se d on m ult i-a ge nt c oope ra t ion
N R C C - 5 3 5 2 7
Y a n g , F . ; S h e n , W . ; T a n , W . ; G h e n n i w a , H . .
O c t o b e r 2 0 1 0
A version of this document is published in / Une version de ce document se trouve dans: 2010 14th IEEE International Conference on Systems, Man, and Cybernetics (IEEE SMC 2010), Istanbul, Turkey, October 10-13, 2010, pp. 1-8
The material in this document is covered by the provisions of the Copyright Act, by Canadian laws, policies, regulations and international agreements. Such provisions serve to identify the information source and, in specific instances, to prohibit reproduction of materials without
written permission. For more information visit http://laws.justice.gc.ca/en/showtdm/cs/C-42
Les renseignements dans ce document sont protégés par la Loi sur le droit d'auteur, par les lois, les politiques et les règlements du Canada et des accords internationaux. Ces dispositions permettent d'identifier la source de l'information et, dans certains cas, d'interdire la copie de
DEVELOPMENT OF PERFORMANCE-BASED
GUIDELINES FOR SELECTION
OF BITUMINOUS-BASED HOT-POURED
PAVEMENT CRACK SEALANT:
AN EXECUTIVE SUMMARY REPORT
FINAL
CONTRACT REPORT
VTRC 09-CR7
IMAD L. AL-QADI
Founder Professor of Engineering
Director, Illinois Center for Transportation
Department of Civil and Environmental Engineering
University of Illinois at Urbana-Champaign
JEAN-FRANCOIS MASSON
Senior Research Officer
Institute for Research in Construction
National Research Council of Canada
SHIH-HSIEN YANG and ELI FINI
Graduate Research Assistants
Department of Civil and Environmental Engineering
University of Illinois at Urbana-Champaign
KEVIN K. McGHEE
Senior Research Scientist
Standard Title Page—Report on Federally Funded Project
1. Report No.: 2. Government Accession No.: 3. Recipient’s Catalog No.: FHWA/VTRC 09-CR7
4. Title and Subtitle: 5. Report Date: January 2009
6. Performing Organization Code: Development of Performance-Based Guidelines for Selection of Bituminous-Based
Hot-Poured Pavement Crack Sealant: An Executive Summary Report 7. Author(s):
Imad Al-Qadi, Jean-Francois Masson, Eli Fini, Shih-Hsien Yang, and Kevin K. McGhee
8. Performing Organization Report No.: VTRC 09-CR7
10. Work Unit No. (TRAIS): 11. Contract or Grant No.: 9. Performing Organization and Address:
Illinois Center for Transportation
University of Illinois at Urbana-Champaign 1611 Titan Drive
Rantoul, IL 61866
67775 TPF-5(045)
12. Sponsoring Agencies’ Name and Address: 13. Type of Report and Period Covered: Final Contract
July 2003-December 2007 14. Sponsoring Agency Code: Virginia Department of Transportation
1401 E. Broad Street Richmond, VA 23219
Federal Highway Administration 400 North 8th Street, Room 750 Richmond, VA 23219-4825 15. Supplementary Notes:
This study is based on work supported by the Federal Highway Administration and the U.S.–Canadian Crack Sealant Consortium under pool fund award No. TPF-5(045). Virginia serves as the Lead State; the Virginia Transportation Research Council of the Virginia Department of Transportation managed the project.
16. Abstract:
This report summarizes research presented in separate technical reports, papers, and journal articles that collectively document the development of a systematic process to aid in the selection of appropriate bituminous hot-poured sealants for pavement cracks and joints.
The following process elements are summarized herein: Apparent Viscosity Test for Hot-Poured Crack Sealants,
Development of a Short-Term Aging Test and Low-Temperature Testing Bibliography, Sealant Flow and Deformation by
Dynamic Shear Rheometry in Summer Temperatures, Characterization of Low Temperature Creep Properties of Crack Sealants
Using Crack Sealant Bending Beam Rheometry, Characterization of Low Temperature Mechanical Properties of Crack Sealants
Using Crack Sealant Direct Tension Test, and Development of Adhesion Tests for Crack Sealants at Low Temperature.
This report brings the results of this cumulative research together to introduce a set of tests and performance parameters for sealant at installation and service temperatures; an aging procedure to simulate sealant weathering; and most important, a simplified chart with thresholds for all performance parameters for the straightforward selection of crack sealant.
17 Key Words: 18. Distribution Statement: Crack sealants, pavement preservation, viscosity, bituminous
aging, dynamic shear rheometry, bending beam rheometry, sealant performance parameters, sealant adhesion, low temperature properties
No restrictions. This document is available to the public through NTIS, Springfield, VA 22161.
19. Security Classif. (of this report): 20. Security Classif. (of this page): 21. No. of Pages: 22. Price:
FINAL CONTRACT REPORT
DEVELOPMENT OF PERFORMANCE-BASED GUIDELINES FOR SELECTION OF BITUMINOUS-BASED HOT-POURED PAVEMENT CRACK SEALANT:
AN EXECUTIVE SUMMARY REPORT Imad L. Al-Qadi
Founder Professor of Engineering Director, Illinois Center for Transportation Department of Civil and Environmental Engineering
University of Illinois at Urbana-Champaign Jean-François Masson
Senior Research Officer
Institute for Research in Construction National Research Council of Canada
Shih-Hsien Yang and Eli Fini Graduate Research Assistants
Department of Civil and Environmental Engineering University of Illinois at Urbana-Champaign
Kevin K. McGhee
Associate Principal Research Scientist Virginia Transportation Research Council
Project Manager
Kevin K. McGhee, P.E., Virginia Transportation Research Council
Contract Research Sponsored by the Virginia Transportation Research Council
(A partnership of the Virginia Department of Transportation and the University of Virginia since 1948)
In Cooperation with the U.S. Department of Transportation Federal Highway Administration
Charlottesville, Virginia January 2009 VTRC 09-CR7
DISCLAIMER
The project that is the subject of this report was done under contract for the Virginia Department of Transportation, Virginia Transportation Research Council. The contents of this report reflect the views of the authors, who are responsible for the facts and the accuracy of the data presented herein. The contents do not necessarily reflect the official views or policies of the Virginia Department of Transportation, the Commonwealth Transportation Board, or the Federal Highway Administration. This report does not constitute a standard, specification, or regulation. Any inclusion of manufacturer names, trade names, or trademarks is for identification purposes only and is not to be considered an endorsement.
Each contract report is peer reviewed and accepted for publication by Research Council staff with expertise in related technical areas. Final editing and proofreading of the report are performed by the contractor.
Copyright 2009 by the Commonwealth of Virginia. All rights reserved.
ABSTRACT
This report summarizes research presented in separate technical reports, papers, and journal articles that collectively document the development of a systematic process to aid in the selection of appropriate bituminous hot-poured sealants for pavement cracks and joints.
The following process elements are summarized herein: Apparent Viscosity Test for
Hot-Poured Crack Sealants, Development of a Short-Term Aging Test and Low-Temperature Testing
Bibliography, Sealant Flow and Deformation by Dynamic Shear Rheometry in Summer
Temperatures, Characterization of Low Temperature Creep Properties of Crack Sealants Using
Crack Sealant Bending Beam Rheometry, Characterization of Low Temperature Mechanical
Properties of Crack Sealants Using Crack Sealant Direct Tension Test, and Development of
Adhesion Tests for Crack Sealants at Low Temperature.
This report brings the results of this cumulative research together to introduce a set of tests and performance parameters for sealant at installation and service temperatures; an aging procedure to simulate sealant weathering; and most important, a simplified chart with thresholds for all performance parameters for the straightforward selection of crack sealant.
FINAL CONTRACT REPORT
DEVELOPMENT OF PERFORMANCE-BASED GUIDELINES FOR SELECTION OF BITUMINOUS-BASED HOT-POURED PAVEMENT CRACK SEALANT:
AN EXECUTIVE SUMMARY REPORT Imad L. Al-Qadi
Founder Professor of Engineering Director, Illinois Center for Transportation Department of Civil and Environmental Engineering
University of Illinois at Urbana-Champaign Jean-François Masson
Senior Research Officer
Institute for Research in Construction National Research Council of Canada
Shih-Hsien Yang and Eli Fini Graduate Research Assistants
Department of Civil and Environmental Engineering University of Illinois at Urbana-Champaign
Kevin K. McGhee, P.E.
Associate Principal Research Scientist Virginia Transportation Research Council
INTRODUCTION
ASTM Standard D5535 defines a sealant as a material that possesses both adhesive and cohesive properties to form a seal, which prevents liquid and solid from penetrating into the pavement system. Crack sealing has been widely accepted as a routine preventative maintenance practice. Given a proper installation is achieved, crack sealant can extend pavement service life by a period ranging from three to five years (Chong and Phang, 1987). Numerous studies also demonstrated the cost- effectiveness of crack sealants (Joseph, 1990; Cuelho et al., 2002, 2003; Fang et al., 2003; Ward, 2001; Chong and Phang, 1987; Chong, 1990).
Crack sealant is produced so that it keeps its shape as applied and hardens through chemical and/or physical processes to form a viscoelastic rubber-like material that withstands extension or compression (crack movement) and weathering (Al-Qadi et al., 2007). However, in many cases, premature failure of crack sealants may be observed in one of the following
scenarios. During the sealant installation, if the viscosity of the sealant is too high, sealant might not be able to fill the crack properly; hence, it will affect the interface bonding between sealant and pavement substrate. If the viscosity is too low, sealant might flow out from the cracks.
In the field, a sealant extends at low temperature and compresses at high temperature to accommodate pavement crack openings which increase with decreasing temperature and
decreases with rising temperature. At high service temperature, sealant might fail due to pull out from the crack by tire passing. At low service temperature, the crack opening may increase from 10% to more than 90% depending on the environmental location; hence, one of the two
mechanisms might be observed: cohesive or adhesive failure. The former occurs in the sealant, and the latter occurs at the sealant-pavement crack wall interface. At low temperature, sealant becomes more brittle due to physical hardening and is subjected to short-duration loading due to crack movements associated with stick-slip motions and truck trafficking as well as long periods of environmental loading.
In order to achieve a cost-effective crack sealing/filling operation and proper field performance, two factors must be closely controlled: quality of sealant installation and sealant mechanical and rheological properties (such as viscosity, bulk stiffness, and adhesive bonding). Regardless of sealant quality, improper installation will cause premature failure and, hence, reduced sealant service life.
Standards and specifications for selecting crack sealant have been established by several organizations, including ASTM International; the American Association of State Highway and Transportation Officials (AASHTO); and U.S. and Canadian federal, state, provincial, and municipal agencies. The objective of the specifications is to select materials that have the necessary properties to perform adequately in the field. However, these specifications are generally empirical and do not measure sealant fundamental properties. Hot-poured bituminous crack sealants are typically selected based on standard empirical tests such as penetration, resilience, flow, and bond to cement concrete briquettes (ASTM D6690). ASTM Standard D5329-04 (Standard Test Methods for Sealants and Fillers, Hot-Applied, for Joints and Cracks in Asphaltic and Portland Cement Concrete Pavements) summarizes most of these tests. These include immersed cone penetration, fuel-immersed cone penetration, the flow test, the non-immersed bond test, the water-non-immersed bond test, the fuel-non-immersed bond test, the resilience test, the oven-aged resilience test, the asphalt compatibility test, the artificial weathering test, the tensile adhesion test, the solubility test, and the flexibility test.
These tests are used by most state highway agencies in selecting their crack sealing materials; but the specification limits may vary from one state to another. These differences create difficulties for crack sealant suppliers because many states with the same environmental conditions specify different limits for the measured properties. These tests were also reported to poorly characterize the rheological properties of bituminous-based crack sealants and to predict sealant performance in the field.
Researchers have widely reported that current specifications for selection of hot-poured crack sealants are based on tests whose results showed no correlation with field performance (Masson, 2000; Belangie and Anderson, 1985; Masson and Lacasse, 1999; Smith and Romine, 1993; 1999). In addition, over the past two decades, a new generation of highly modified crack sealants has been introduced to the market (Zanzotto, 1996). These sealants exhibit quite complex behavior compared to those of traditional sealant materials (Belangie and Anderson, 1985). This necessitates the development of a new set of specifications.
PURPOSE AND SCOPE
The most effective way to evaluate the performance of crack sealants would be to perform field tests. However, the results from field tests are sometimes controversial because a sealant can perform well in one site and fail in another simply because of differences in
environmental conditions. Therefore, the main objectives of this project were to develop laboratory tests that measure bituminous-based crack sealants rheological properties and to develop performance-based guidelines for the selection of hot-poured crack sealants. Meeting these objectives requires the development of new tests to measure the rheological properties of hot-poured crack sealants over a wide range of service temperatures. The developed tests need to be practical, repeatable and reproducible. Thresholds for each test should be identified to ensure desirable sealant field performance. A special effort was given to make use of the equipment originally developed during the five-year Strategic Highway Research Program (SHRP), which were used to measure binder rheological behavior as part of the performance grading (PG) system.
This executive summary report introduces a systematic process to help users select appropriate bituminous hot-poured crack sealants. This document summarizes research that is presented in separate technical reports, papers, and journal articles that collectively chronicle the development of this process. The process includes a new set of tests and performance
parameters for sealant at installation and service temperatures. It also proposes a new aging procedure to simulate sealant weathering.
METHODS
To develop performance-based guidelines for the selection of hot-poured crack sealants that meet the aforementioned requirements and minimize the cost of possessing new testing equipment, the research group made use of the SuperPave™ binder performance grading (PG) equipment. Modifications to the existing viscosity test, bending beam rheometer, and direct tension test devices, specimen size and preparation, and testing procedures were made to accommodate the testing of crack sealants. In addition, new tests for sealant aging and sealant evaluation at high service temperatures were introduced. Upon the completion of test validation, test measured performance parameters were recommended for implementation as part of the newly developed “Sealant Grade” (SG) system. Appendix A briefly catalogues the sealants that were used in the extensive laboratory and field tests as well as their ASTM testing results that supported this research.
Apparent Viscosity
Sealant viscosity is among the parameters that affect initial bonding. Therefore, applying a sealant at the appropriate viscosity provides for better crack filling and enhances interface bonding. Several factors affect the measured viscosity of hot-poured crack sealant. Therefore, it is essential to identify the material characteristics that influence the rheological behavior of hot-poured crack sealant at installation. These characteristics need to be set at reasonable limits, to
simulate field installation as closely as possible. Although standard tests to examine sealant consistency exist, these standard tests have not been proven to predict field performance. As part of an effort to bridge the gap between sealant fundamental properties and field performance, a test procedure was developed to measure apparent sealant viscosity using the same rotational viscometer equipment used in the SuperPave™ PG system. The development of this procedure is described in detail in a supporting document (Al-Qadi et al., 2008b). The procedure for measuring apparent viscosity is summarized in this report under “Results and Discussion.”
Sealant Aging
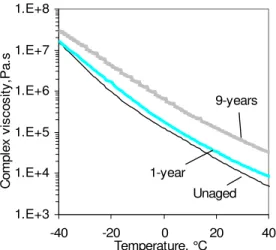
For an aging test to be effective, it must quickly provide an aging as close as possible to reality. Figure 1 illustrates the basic process. To this effect, true aging was determined from the physico-chemical analysis of 12 sealants weathered in Montreal, Canada, for nine years (Table 1). As expected, sealants with good performance contain components resistant to weathering, whereas sealants with poor performance oxidize quickly. Figure 2 shows an example of sealant stiffening due to weathering.
Because of sealant’s complex mixture, each sealant shows unique aging characteristics. To mimic the effect of weathering on sealants, several accelerated aging methods were compared (alone or in combination) after various aging periods and temperatures, including small-kettle aging, microwave aging, pressure aging, oven aging, and vacuum oven aging. The results of physico-chemical analysis of sealants weathered in the field were compared to those of sealants aged quickly in the laboratory (Al-Qadi et al., 2004).
Determine aging rate and mechanism for weathered sealants
Simulate aging on un-aged sealants
Validate aging test
Figure 1. Schematic of Aging Procedure
Table 1. Physico-chemical Method to Characterize Crack Sealant Aging
Method* Output Use GPC Separation of bitumen and
polymer
Quantify polymer; degradation rate and mechanism
FTIR Fingerprint of composition Oxidation; identification of polymer and filler; semi-quantitative analysis; degradation mechanism
TG Weight loss upon heating Contents of filler and light, medium, and heavy hydrocarbon components
DSR Stiffness, relaxation Effect of temperature and aging on mechanical properties *GPC: Gel permeation chromatography; FTIR: Fourier transform infrared spectroscopy; TG: Thermogravimetric analysis; and DSR: Dynamic shear rheometry (DSR).
1.E+3 1.E+4 1.E+5 1.E+6 1.E+7 1.E+8 -40 -20 0 20 40 Temperature, °C C o m p le x vi sc o s it y,P a .s Unaged 1-year 9-years
Figure 2. Complex Viscosity Increase for a Field-Aged Sealant at One and Nine Years
Sealant Flow and Deformation
Bituminous sealants applied to cracked pavements sometimes fail due to deformation under the combined action of shear stresses and high service temperatures (Masson et al., 2007). In an attempt to define performance parameters, 21 sealants were tested with a dynamic shear rheometer (DSR) and subjected to increasing stresses at temperatures between 46°C and 82°C. These conditions were meant to mimic the effects of various traffic levels and maximum temperature in the field.
Flexural Creep
The bending beam rheometer (BBR) is used in most pavement laboratories nowadays to measure binder stiffness at low temperature. A modified BBR test, a crack sealant bending beam rheometer (CSBBR), was introduced to measure the flexural creep of crack sealant at
temperatures as low as -40°C. The development of this procedure is described in detail in a supporting document (Al-Qadi et al, 2008d). The resulting procedure is summarized later in this report.
Low Temperature Tensile Properties
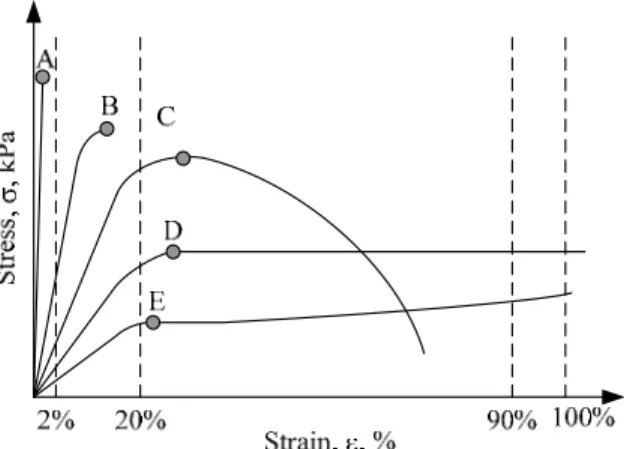
Four typical types of stress-strain curves of crack sealant are shown in Figure 3.
Depending on sealant composition and test temperature, sealants may behave as a brittle plastic for which the stress-strain curve is linear up to fracture with little percentage elongation (Curve A). Low-polymer and high-crumb-rubber-modified sealants behave this way. A brittle-ductile failure may be observed for crack sealants as well. When the tensile load reaches a maximum, sealant may fracture as shown in curve B, or the specimen may continue to stretch after the maximum load as shown in curve C (Figure 3). Sealant may also experience ductile failure (curves D and E). Typically, this type of sealant exhibits a yield point, followed by extensive elongation at a constant stress. This is referred to as a plastic flow region, and is clearly a region
Figure 3. Stress-Strain Behavior of Crack Sealant Observed in the Direct Tension Test
of nonlinear viscoelasticity. After the plastic flow region, sealant might exhibit strain hardening. This type of sealant usually has a relatively high polymer concentration.
To investigate whether a sealant can survive in a particular service conditions, the SuperPaveTM Direct Tension Test (DTT) was considered and modified for crack sealants. The development of crack sealant direct tension test (CSDTT) is described in detail in a supporting document (Al-Qadi et al, 2008c). The resulting procedure is summarized later in this report.
Adhesive Properties at Low Temperature
The adhesion capability of hot-poured bituminous sealants is usually evaluated using a standard test of an empirical nature (ASTM D5329). There is, however, no indication that the results of this test pertain to field performance. In addition, this test examines adhesion of sealant to Portland cement concrete, and the test result does not account for aggregate
composition, which is the main component of HMA. Therefore, a reliable test method, which is based on sealant rheology, accounts for aggregate composition, and correlates with field
performance, is urgently needed. This study proposes three laboratory tests to predict interface bonding of crack sealant to aggregate at service temperatures ranging from -4ºC to -40ºC (Al-Qadi et al., 2008a). The three tests are designed to address the needs of manufacturers, transportation organizations, including contractors, transportation agencies and consultants, and researchers, respectively.
The first laboratory approach addresses the compatibility of sealant with a specific substrate, by measuring the free energy of the bond, work of adhesion. The second test makes use of the direct tension test (DTT) device. The third test is a fracture type test that uses a fracture mechanics approach to derive a fundamental property of the bond, interfacial fracture
RESULTS AND DISCUSSION Apparent Viscosity Testing Procedure
Numerous factors affect the measured viscosity of hot-poured crack sealant. Due to the relatively high polymer content, sealant responses to changes in temperature and loading can be quite complex. Since hot-poured crack sealants behave as non-Newtonian fluids, variation in the experimental parameters can affect the measured values; hence, a test setup and testing
parameters were identified (Al-Qadi et al., 2006; 2008b). Laboratory conditions should simulate sealant installation conditions as closely as possible. A critical issue was the shear rate imposed on the material during application. It was determined that a spindle speed ranging from 115 rpm to 5536 rpm should be used to simulate the shearing of the sealant as it enters the crack during installation. However, a significant reduction in the shear rate may occur as the sealant exits the applicator wand, due to the sharp temperature drop as well as the high friction with the crack walls.
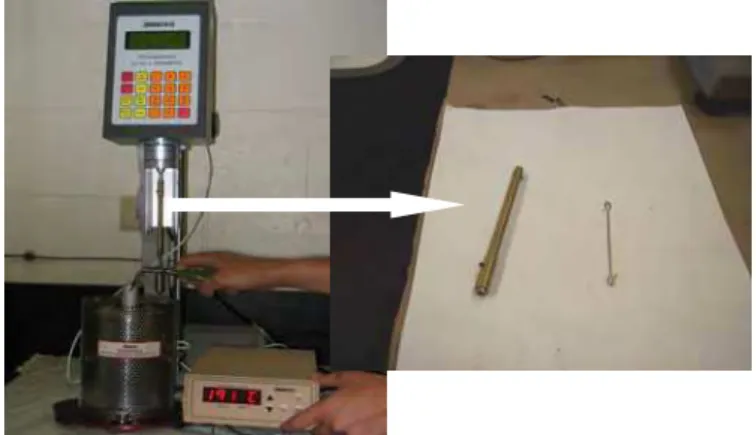
Although the Brookfield Thermosel system (as adopted from SuperPave™) is not a high-shear rheometer (its maximum allowable spindle speed is 250 rpm), it was found to be sufficient for the sealant testing. After extensive testing, a Brookfield rotational viscometer was adopted; modification of the test procedure and equipment was implemented (Figure 4). SC4-27 spindle at a speed of 60 rpm (shear rate of 20.4s-1) at the recommended installation temperature is used. The spindle is attached to a newly developed rigid rod. The rod is a replacement for the current hook; it prevents a rubber particle from disturbing the spindle rotation which results in better test repeatability. A conditioning time of 20 min and a waiting time of 30 s before collecting data are also recommended to ensure that the measured viscosity has stabilized.
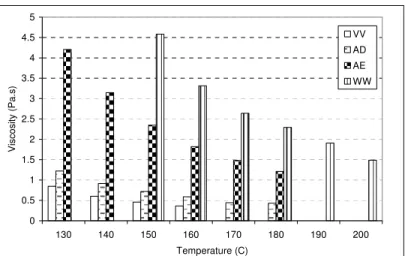
In this test, sealants are cut in small pieces and placed directly in an aluminum chamber, then sealant was melted inside the chamber. Cutting sealant without melting it improved test results significantly. This measured apparent viscosity is expected to be an acceptable indication of the sealant’s rheological behavior at installation temperature, assuming that the suggested procedure and equipment are used. Fifteen virgin sealants were tested in accordance with the developed testing procedure; the apparent viscosity of several sealants at various temperatures is presented in Figure 5.
Figure 4. Brookfield Thermosel System and Rigid Rod Used for Crack Sealant Testing Compared to the Rod Used for Asphalt Binder
0 0.5 1 1.5 2 2.5 3 3.5 4 4.5 5 130 140 150 160 170 180 190 200 Temperature (C) Vi sc os it y ( P a.s ) VV AD AE WW
Figure 5. Apparent Viscosity of Several Sealants at Various Temperatures Weathering and Accelerated Aging of Hot-Poured Bituminous Sealants
Seven laboratories conducted a round-robin test. The repeatability of the measured apparent viscosities was determined through statistical analysis. The average coefficients of variation within and between laboratories were found to be 1.6% and 6%, respectively.
Maximum permissible differences within a laboratory and between laboratories are 5.4% (among the best three readings out of four) and 17% (between the test conducted in two different
laboratories), respectively. These values are comparable to those of asphalt binder: 3.5% and 14.5% based on ASTM D4402-02 and 3.5% and 12.1% based on AASHTO 2006 T316, respectively. Because viscosity plays an essential role in predicting field performance of hot-poured crack sealant, upper and lower viscosity limits are recommended. An upper limit of 3.5 Pa.s ensures that sealant is liquid enough to pour, whereas a lower limit of 1 Pa.s controls the potential of using excessively fluid sealant. Hence, the sealant apparent viscosity should be between 1.0 and 3.5 Pa.s when measured at recommended installation temperature.
Sealant Aging
The effect of hot-poured crack sealant oxidation and the change in polymer molecular weight on the sealant complex viscosity between -40°C and 40°C served as the two parameters in examining the applicability of pressure aging method (method 1) and vacuum oven method (method 2) (Figure 6). Microwave heating was found to mimic the aging of sealants that contain mineral filler; but not other sealants. The microwave method thus lacked general application. Pressure aging was also found to be inappropriate because it often led to insufficient bitumen oxidation, and excessive thermo-degradation of the polymer. Vacuum oven aging proved to be the most appropriate method to simulate sealant weathering. In this method, sealants are cut into slices and placed on a stainless steel pan; each pan contains 35 g of sealant. The pan is
transferred into a conventional temperature controlled oven which is maintained at 180°C for approximately 5 min to allow sealant to melt and form a film. The sealant is then removed from the oven and cooled to room temperature. Once it cools, sealant is placed in a vacuum oven preheated at 115°C for 16 hr. After 16 hr, the vacuum is released and sealant is placed in a conventional oven at 180°C for 5 min or until the sealant is fluid enough to pour.
1.E+3 1.E+4 1.E+5 1.E+6 1.E+7 1.E+8 -40 -20 0 20 40 Temperature, °C C o m p le x vi sco s ity, P a .s 9-years Unaged Method 2 Method 1
Figure 6. Complex Viscosity of a Field-Aged Sealant Compared to that after Accelerated Aging
Sealant Flow and Deformation by Dynamic Shear Rheometry
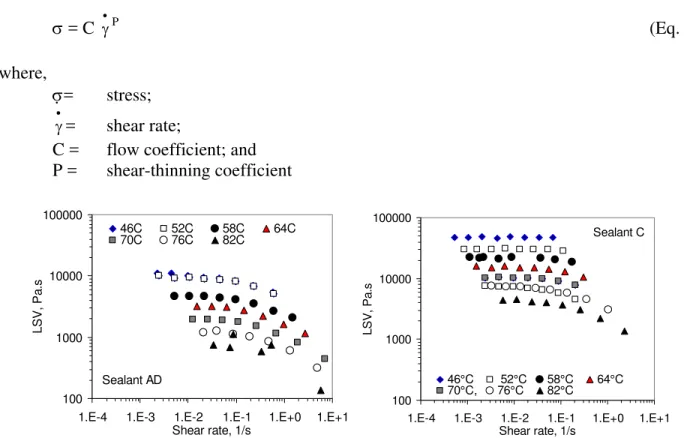
Plots of low shear viscosity (ηL) versus shear rate (
•
γ), Equation 1, indicated that many sealants were susceptible to shear thinning. Their apparent viscosity decreased with an increase in shear rate and/or temperature (Figure 7). This indicated that at high service temperatures, high traffic loads or volumes would affect the extent of sealant flow when it is under stress.
σ = C γ•P (Eq. 1) where, σ= stress; • γ= shear rate;
C = flow coefficient; and P = shear-thinning coefficient Sealant AD 100 1000 10000 100000
1.E-4 1.E-3 1.E-2 1.E-1 1.E+0 1.E+1 Shear rate, 1/s L S V, Pa .s 46C 52C 58C 64C 70C 76C 82C Sealant C 100 1000 10000 100000
1.E-4 1.E-3 1.E-2 1.E-1 1.E+0 1.E+1
Shear rate, 1/s L SV, Pa .s 46°C 52°C 58°C 64°C 70°C, 76°C 82°C
Figure 7. Low Shear Viscosity as a Function of Shear Rate; The Stress Doubles for Each Point from Left to Right
Plots of ηL vs
•
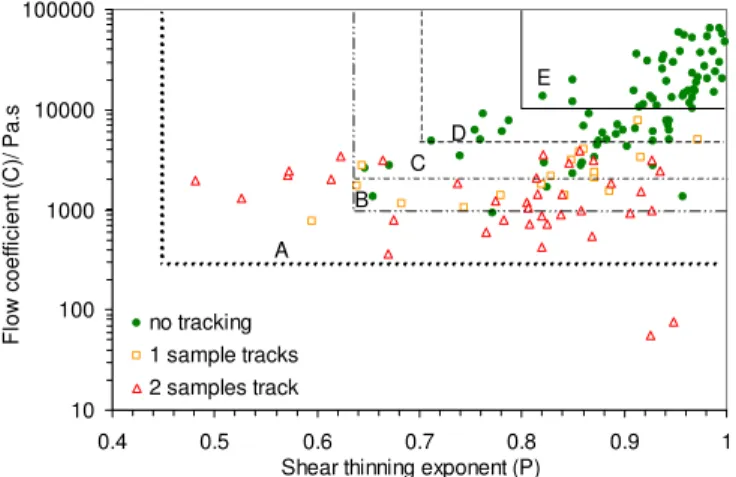
γ were interpreted based on the Ostwald power law model. This model provides two parameters: a flow coefficient (C) and a shear-thinning coefficient (P). These coefficients correlated well with sealant pseudo-field performance as measured by tracking (Collins et al., 2007). Figure 8 shows the relationship between these factors and performance during the pseudo-field test. The solid markers indicate the sealants that did not fail during the pseudo-field test, and the open markers show those that failed. The semi-log scale in Figure 8 serves to highlight the high-failure regions (open markers). Limiting values for P and C can be established to limit the risk of sealant failure. Each pair of C and P represents performance criteria.
In the absence of effective limiting criteria (area A in Figure 8), the sealant failure rate due to tracking is 39% (Table 2). As C and P limits are raised, the risk of tracking failure is reduced. Area E defines the limits within which no tracking failure is observed. With such demanding criteria, 33% of the sealants are above the pass limits. Any limits in C and P can be used to define the level of sealant performance, but the most appropriate performance criteria may be that defined by area D, where limits of C = 4000 Pa.s and P = 0.70 provide for a failure risk of only 3% and a sealant acceptance rate greater than 50%. The other limits have greater acceptance rates, but the risk of failure is disproportionately higher (Table 2).
10 100 1000 10000 100000 0.4 0.5 0.6 0.7 0.8 0.9 1
Shear thinning exponent (P)
F low c oef fi ci en t ( C )/ P a .s no tracking 1 sample tracks 2 samples track A B C E D
Figure 8. Semi-Log Plot of the Ostwald Parameters and Possible Performance Limits, Areas A to D
Table 2. Lower Limits for C and P and their Relationship with Tracking Performance
Areaa C (Pa.s) P Passingb Trackingc
A 300 0.46 145 (99%) 39 % failure B 1000 0.64 123 (84%) 24% failure C 2500 0.64 98 (66%) 14% failure D 4000 0.70 76 (52%) 3% failures E 10000 0.80 49 (33%) No failures a Area in Figure 8. b
From DSR: Number of samples above C and P limits out of a total of 147.
c
Characterization of Low Temperature Mechanical Properties Using Modified Bending Beam Rheometry
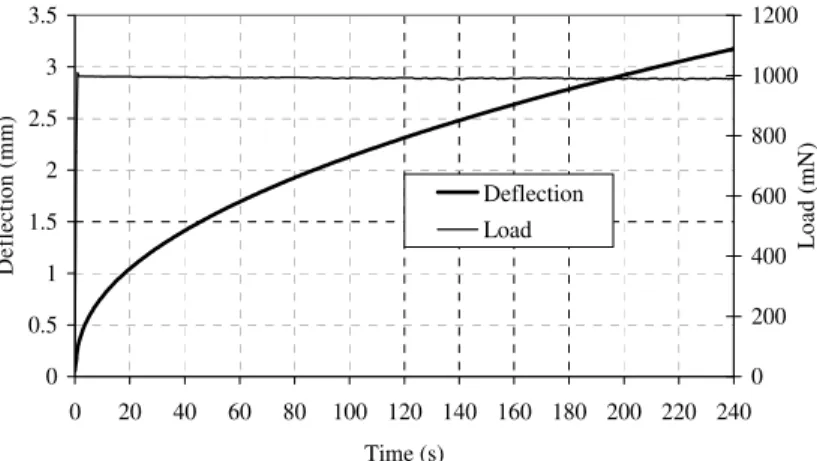
The principle of the crack sealant bending beam rheometer (CSBBR) test is applying a constant load of 980 mN (100g) to a sealant beam and then measuring the beam deflection. The crack sealant is a much softer material compared to asphalt binder; therefore, excessive
deflection was encountered during the testing of some sealants with the SuperPave™ BBR device. Consequently, several modifications were made to the SuperPave™ BBR test. First, the specimen thickness was doubled to overcome the excessive deflection. Second, the device was modified to accommodate the new specimen geometry. Additionally, a modified testing procedure, a new aging procedure, a validated testing period, and stiffness determination time were introduced. Linearity verification was conducted in order to verify that bituminous crack sealants behave as linear viscoelastic materials within CSBBR testing range.
The CSBBR beam thickness was doubled from 6.35 to 12.7 mm. However, because of the increase in the beam’s thickness, the deflection at the center of the beam due to shear would increase. The analysis shows that the center deflection contributed by shear force is only 4%, which was deemed acceptable. Figure 9 shows the softest tested sealant loaded with 980 mN and resulted in final deflection of 3.2 mm after 240 s of loading (Al-Qadi et al., 2005). To adjust the device to accommodate the newly developed specimen geometry, the specimen support and calibration kits of the BBR were modified, as shown in Figure 10. The new design specimen supports are 6.35 mm shorter than the SuperPaveTM BBR specimen supports and can easily be replaced. The calibration kits of the system were also modified as shown in Figure 11. The compliance beam for the crack sealant test was modified by adding two footers at each end of the beam (Al-Qadi et al., 2008d).
0 0.5 1 1.5 2 2.5 3 3.5 0 20 40 60 80 100 120 140 160 180 200 220 240 Time (s) De flecti on (m m) 0 200 400 600 800 1000 1200 Loa d (m N) Deflection Load
(a) (b) (c) Figure 10. (a) SuperPaveTM BBR Specimen Supports; (b) Crack Sealant BBR Specimen Supports;
and (c) Modified Specimen Supports
Figure 11. Calibration Beam: In the Front, Compliance Beam for SuperPaveTM BBR Test and in the Back, Modified Compliance Beam for Crack Sealant BBR Test
The test procedure modification was completed in two parts: the silicon-based release agent was used to replace the Mylar strip because the Mylar strip melted at sealant pouring temperature; second, each specimen was poured from an individual container which has the same weight. Because bituminous-based sealants are composed by asphalt binder, SBS copolymer, crumb rubber, and various additives, the variability between specimens is high. By controlling the pouring weight of each specimen, the test repeatability was greatly improved (Al-Qadi et al., 2006). Prior to pouring specimens into the molds, sealant was aged in accordance with the aging method developed in this study.
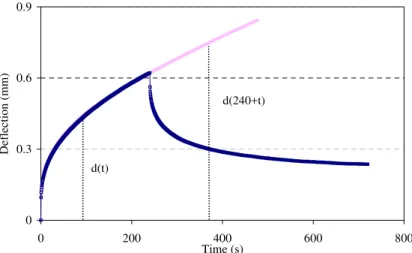
The assumption that crack sealant follow linear viscoelastic behavior was verified (Elseifi et al., 2006). Test results indicated that stiffness was independent of the applied stress level, as shown in Figure 12; three levels of loading (250 mN, 490 mN, and 980 mN) were applied on sealant specimens. The second condition of linearity, the experimental deflection at time (t) and the recovery deflection at time 240s + (t) should be equal or within a 5% difference could not be verified experimentally due to the sealant’s softening behavior. Therefore, finite element (FE) was used to investigate the second condition of linearity. Figure 13 shows that the second condition of linear viscoelasticity can be verified.
0 1 10 100
1.0E-01 1.0E+00 1.0E+01 1.0E+02 1.0E+03
Time (s) St iffness (MP a ) 980mN 490mN 250mN
Figure 12. Measurements of Creep Stiffness for Sealant NN at -40°C
0 0.3 0.6 0.9 0 200 400 600 800 Time (s) Deflection ( mm) d(t) d(240+t)
Figure 13. Schematic Diagram Illustrates the Extrapolated Data after 240s, Using FE
The viscoelastic model, Prony series, was fitted to the experimental data to obtain Prony series parameters. Prony series expansion was found to be adequate in describing the
mechanical behavior of crack sealants at low temperature (Elseifi et al., 2006). Fitting
parameters were then incorporated into a three-dimensional FE model of the CSBBR specimen. The resulting calculated creep deflections agreed with the measured values.
Fifteen sealants were tested at temperatures ranging from -4°C to -40°C. In this test, 35 g of sealant is first heated at its recommended pouring temperature and then poured into an
aluminum assembled mold. A rectangular sealant beam is cast with dimension of 12.7 mm in height, 12.7 mm in width, and 102 mm in length. The beam is then placed in a fluid
environmental chamber and the specimen is placed on a two-point support and subjected to a point creep loading. The specimen is exposed to a creep loading for 240 s then followed by 480 s unloading. The load and deflection of the sealant beam is recorded during the period of loading and unloading.
Each sealant was tested at three temperatures. These testing results were used to develop performance parameters. The selected performance parameters had to satisfy these four criteria: ability to describe the sealant’s rheological behavior, ease of measurement and calculation, repeatability, and correlation with field performance. In addition, it was found that the critical loading time for crack sealant material at low temperature is after 5 hr of loading. If the
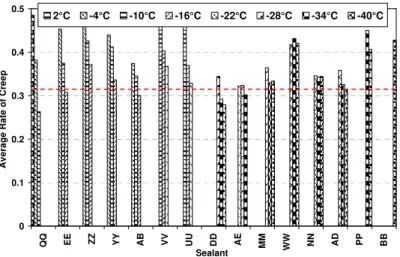
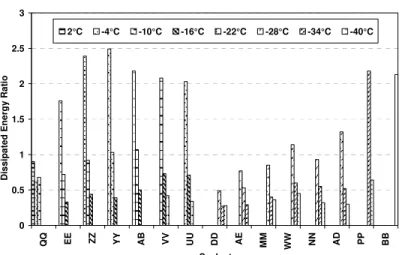
temperature superposition principle is applied, the stiffness at 240 s for a given temperature can be used to predict the stiffness after 5 hr of loading at a temperature of approximately 12°C greater. Given the variation in sealant response to temperature change, 6°C shift is deemed appropriate. The stiffness at 240 s (Figure 14), the average creep rate (Figure 15) and dissipated energy ratio (Figure 16) were the performance parameters selected to distinguish between sealants. These new tests are repeatable, and the coefficient of variation between operators is less than 4%. However, there is a difference in measured values was noted when using devices from different manufacturers (Al-Qadi et al., 2007).
0 5 10 15 20 25 30 35 40 45 50 QQ EE ZZ YY AB VV UU DD AE MM WW NN AD PP BB Sealant Stiffness (MPa) 2°C -4°C -10°C -16°C -22°C -28°C -34°C -40°C S(-10°C)=85MPa
Figure 14. Stiffness at 240 s at Various Testing Temperatures for 15 Sealants
0 0.1 0.2 0.3 0.4 0.5 QQ EE ZZ YY AB VV UU DD AE MM WW NN AD PP BB Sealant Av er a g e R a te o f C re e p 2°C -4°C -10°C -16°C -22°C -28°C -34°C -40°C
0 0.5 1 1.5 2 2.5 3 QQ EE ZZ YY AB VV UU DD AE MM WW NN AD PP BB Sealant D iss ip ate d En er g y R a ti o 2°C -4°C -10°C -16°C -22°C -28°C -34°C -40°C
Figure 16. Dissipated Energy Ratio at 240 s at Various Testing Temperatures for 15 Sealants
Five sealants that were previously installed in Montreal as part a long-term field
performance evaluation survey were tested using CSBBR. The results were used to establish the selection criteria for the CSBBR test. The test results recommend two performance criteria for application: stiffness at 240s and average creep rate. The recommended thresholds, which are temperature independent, for the two criteria are a maximum stiffness of 25 MPa and minimum average creep rate 0.31, respectively.
Characterization of Low Temperature Tensile Properties Utilizing Direct Tension Tester
The principle of the crack sealant DTT (CSDTT) is to slowly pull a crack sealant specimen in tension until it breaks. The dog-bone shaped specimen used in the DTT has a rectangular cross section. Its ends are enlarged so that when crack sealant is poured into the mold, it has a large adhesive area between the crack sealant and end tabs. The end tabs are made from Phenolic G-10 material, to provide good bonding. The SuperPaveTM DTT specimen
geometry can only extend the sealant specimen up to 32% strain. This is significantly smaller than the expected crack sealant extension in the field. Therefore, for crack sealant testing, the specimen geometry and preparation procedure were modified.
A FE analysis was conducted to determine the optimized specimen geometry which provides uniform stress distribution within specimen while allowing sufficient extension (Figure 17). This led to a new geometry; the new specimen dimensions are the following: 24 mm long, 6 mm wide and 3 mm thick; the effective gauge length is 20.3 mm. The maximum extension that can be achieved using this specimen is 19 mm which is equivalent to approximately 94% strain. This meets the extreme service conditions that sealants may experience in the field. Table 3 presents the geometry comparison of SuperPaveTM binder DTT specimen, transition specimen and CSDTT specimen (Al-Qadi et al., 2007).
Figure 17. Uniform Stress Distribution along the Web of the Dog-Bone Shape CSDTT Specimen
Table 3. Comparison of Direct Tension Specimen Dimensions
Specimen Type Width (mm) Thickness (mm) Nominal Length (mm)
Effective Gauge Length (mm)
SuperPaveTM 6 6 40 33.8
Transition 6 3 40 33.8
Crack Sealant 6 3 24 20.2
The effects of geometry and loading rate on sealant tensile behavior were investigated. Results obtained from testing SuperPave™ (6 x6 x 33.8 mm3), transition (6 x 3 x 33.8 mm3) and crack sealant (6 x 3 x 20.2 mm3) high-polymer-content sealant specimens were used to evaluate the effect of cross-section area on the stress-strain relationship. As illustrated in Figure 18, high-polymer-content sealants WW and PP showed no major effects due to changes in specimen cross-section areas. The effect of specimen length on stress-strain response for effective gauge length of 33.8 mm and 20.3 mm specimens is shown in Figure 19 a and b). A greater stress response was noted in the 20.3 mm specimen than in the 33.8 mm specimen when tested at the same elongation rate. To compare the stress response at the same strain level, two elongation rates, 3 mm/min and 1.8 mm/min, were applied to 33.8 mm and 20.3 mm gauge length specimens, respectively. Considering the corresponding specimen length, the variation in
elongation rate resulted in an identical strain rate of 8.8%/min for each type. Figure 19 illustrates that the crack sealant specimen elongates about two to three times longer than the SuperPave™ binder specimen. In addition, high-polymer-content sealants have shown 10 to 20 times more elongation and up to twice the tensile strength of crumb-rubber sealants. Regardless of specimen geometry, high-polymer-content sealants have shown equivalent peak stress at its maximum elongation state. Hence, the length effect is negligible in the sealant tensile strength when high-polymer-content products were used (Al-Qadi et al., 2007).
0 400 800 1200 1600 0 5 10 15 20 25 30 35 Strain (%) St re ss ( k P a) WW_SuperPave WW_Transition PP_SuperPave PP_Transition
Figure 18. Effect of Cross-Section Area on Stress-Strain Relationship for Two High-Polymer-Content Sealants at 4.5 mm/min 0 400 800 1200 0 20 40 60 80 100 120 Strain (%) St res s (kP a) WW_Transition WW_Crack Sealant PP_Transition PP_Crack Sealant (a) 0 400 800 1200 0 1 2 3 4 5 6 Strain (%) St res s (kP a) ZZ_Transition ZZ_Crack Sealant YY_Transition YY_Crack Sealant (b)
Figure 19. Effect of Specimen Length on Stress-Strain Relationship at the Same Strain Rate for (a) High-Polymer-Content Sealant, and (b) Crumb-Rubber Sealant
The specimen preparation procedure was also modified to accommodate various sealant compositions to improve the workability while pouring the sealant into a mold. The mold was heated to 50°C lower than sealant pouring temperature prior to pouring the sealant. Right after the sealant was poured into the mold, a spatula was used to slightly tap the sealant to ensure that sealant filled the mold. Figure 20 shows the typical stress-strain relationship of six replicates for stiff sealant QQ and soft sealant BB, which were tested at -10°C and -40°C, respectively.
Fifteen sealants were tested at low temperatures ranging from -40 to -4°C. The
extendibility of the sealant was measured and used as a performance parameter (see Figure 21). It was found that extendibility is a good criterion for identifying and distinguishing among sealants. In addition, a viscoelastic model was fitted to tensile stress-strain test results to obtain Prony series of crack sealants. The model was used to estimate the stress relaxation modulus for the crack sealant. The fundamental property, relaxation modulus, can be used to relate to
sealant’s field performance as well (Yang and Al-Qadi, 2008).
The study recommends using the DTT as a standard test to evaluate the bituminous-based hot-poured crack sealant at low temperature. The performance parameter, extendibility, was recommended for use in the specification. The threshold for the extendibility depends on the sealants’ lowest application temperature and is presented in Table 4. In addition, because the test is conducted under a relatively higher deformation rate compared to real crack movement, the research team recommends a +6°C shift in the crack sealant grading system. Therefore, for instance, if the lowest service temperature is determined as -16°C, the test would then be conducted at -10°C. If the extendibility of such sealant is over 25%, the sealant passes the criteria and is approved for use.
0 0.05 0.1 0.15 0.2 0.25 0.3 0 2 4 6 8 10 12 14 16 18 20 22 24 Strain (%) Stres s (MPa) 0 0.25 0.5 0.75 1 1.25 1.5 1.75 2 2.25 0 0.2 0.4 0.6 0.8 1 Strain (%) Stre ss (MPa) (a) (b)
0 10 20 30 40 50 60 70 80 90 100 DD AE MM WW NN AD PP BB Sealant Ex te nsi o n (% ) -22 -28 -34 -40 -4°C Grade -10°C Grade -16°C Grade -22°C Grade -28°C Grade -34°C Grade + (a) 0 10 20 30 40 50 60 70 80 90 100 QQ EE ZZ Sealant YY AB VV E x te ns ion ( % ) -4 -10 -16 -22 -4°C Grade -10°C Grade -16°C Grade -22°C Grade -28°C Grade -34°C Grade + (b)
Figure 21. Extendibility of Selected Sealant at (a) -22, -28, -34, and -40°C; and (b) -4, -10, -16, -22°C Table 4. Thresholds for Crack Sealant Extendibility at Various Temperatures
Temperature (°C) -4 -10 -16 -22 -28 -34 -40 Extendibility (%) 10 25 40 55 70 85 85
Adhesive Properties of Crack Sealant at Low Temperature Work of Adhesion
Even a quality sealant may fail if used with an incompatible aggregate. A compatibility test can be performed using the Sessile drop method, Figure 22, which is used to determine both the surface energy of the hot-poured crack sealant and its wettability (contact angle) with respect to aggregate. For this test, sealant is heated and mixed at the manufacturer’s recommended installation temperature and poured onto an aluminum sheet to form a thin, smooth surface. The sealant is cooled at room temperature to solidify and make thin plates. A five-micrometer pipette is used to manually apply liquid drops from three probe liquids (water, formamide, and glycerol) onto the sealant plate. The image of each drop is captured by microscope within 15 s after it is
(a) (b)
Figure 22. Surface Energy Method: (a) Sessile Drop Equipment and Microscope; and (b) Contact Angle of a Drop of Liquid on a Solid
applied. The resulting contact angle is used to determine the work of adhesion between sealant and substrate.
Due to the high variation among aggregate properties, replacing aggregate substrate with a standard material would be beneficial. Various potential reference materials were examined and aluminum was selected because it has compatible thermal expansion, smoothest surface, and similar surface chemistry to natural aggregate (Fini et al., 2006). Figure 23 presents the
calculated work of adhesion between sealant and four substrates: aluminum, granite, quartzite, limestone.
Direct Tension
The premise of the DTT for adhesion is to detach sealant from its aggregate counterpart by applying a tensile force. A new test fixture that simulates sealant pouring condition and loading mechanism in the field was developed. The briquette assembly consists of two
aluminum half-cylinders of 25 mm diameter and 12 mm thickness; aluminum is conservatively selected as a substrate reference material. Each aluminum briquette is confined within an aluminum grip designed to work with the DTT sitting posts. The assembly has a half cylinder mold, open at the upper part. The mold is placed between the two aluminum half cylinders on an even surface. In order to ensure that adhesive failure occurs, and to define failure’s location, a notch is made at one side of the sealant-aggregate interface. A 12.5 x 2 mm shim is placed at one aggregate-sealant interface. The assembly then is placed in the DT machine so the notch is placed at the non-moving side of the DT machine.
To conduct the test, sealant is heated at its recommended installation temperature and poured into the half cylinder mold. After one hour of annealing at room temperature, the specimen is trimmed and placed in the cooling bath for 15 min . The specimen is then removed from the bath, demolded, and placed back in the bath for another 45 min before testing. Using the DT device, the end pieces are pulled apart by moving one of the end pieces at a speed of 0.05 mm/s, strain rate of 0.005 mm/mm/s (Figure 24). The results of the test are the maximum load and calculated energy, which is the area under the load-displacement curve up to failure, are reported as indications of bond strength (Al-Qadi et al., 2008a).
The interfacial bonding of combinations of eight sealants and four substrates were measured. Figure 25 presents the maximum load and energy required to break the bond between
0 10 20 30 40 50 60 70 80 90 UU BB AE PP AD WW MM W o rk of Ad hesion ( m J/ m 2 ) Limestone Quartzite Granite Aluminum (a) 0 2 4 6 8 10 12 14 16 DD QQ NN VV EE ZZ YY W o rk of A d h e s io n (m J /m 2 ) Limestone Quartzite Granite Aluminum (b)
Figure 23. Work of Adhesion between Sealants and Limestone, Quartzite, Granite and Aluminum for Sealants a) UU, BB, AE, PP, AD, WW, MM; and b) DD, QQ, NN, VV, EE, ZZ, YY
0 20 40 60 80 100 120 140 -4 -10 -16 -22 -28 -34 -40 Temperature (ºC) Pma x (N ) NN WW PP AE UU LL DD VV (a) 0 20 40 60 80 100 120 140 -4 -10 -16 -22 -28 -34 Temperature (ºC) E ner gy ( J /m 2) NN WW PP AE UU LL DD VV E (b)
Figure 25. Maximum Load and Energy Required to Break the Bond between Sealant and Aluminum at Various Temperatures
the eight sealants and aluminum. The maximum load showed better repeatability, and it was able to clearly distinguish among different sealant-aggregate pairs. Variation between operators and setups were checked, and no significant variations were found. The maximum load was selected as the test performance parameter (Al-Qadi et al., 2008a). Figure 26 presents this parameter for several pairs of sealant-aggregate. Using comparison between test results of laboratory-aged specimens and field data, a minimum 50N at tested temperature was selected as the performance threshold.
Interfacial Fracture Energy
The third test of the low-temperature adhesive properties of sealants is a fracture-type test that utilizes fracture mechanics to derive a fundamental property of the bond. The fundamental property is the interfacial fracture energy (IFE). A geometry-independent, pressure blister test was developed (Fini et al., 2007). The intrinsically stable interface debonding process makes this test attractive and allows calculation of fundamental properties of the interface (Gent and Lewandowski, 1987; Shirani and Liechti, 1998; Penn and Defex, 2002). The blister test, which
0 50 100 150 200 250 300 350 400 PP A-34 NNA -34 NNA -28 AE A-28 AE A-22 LLA -22 LLA -16 VV A-22 VVA -16 VV A-10 UU A-16 UU A-10 ZZA -10 ZZA -4 QQ A-4 QQ A+2 P ma x (N) Aluminum Limestone Granite Quartzite
Figure 26. Maximum Load Measured for Bonding between Sealants and Substrates
is an enclosed system, exposes the interface to simultaneous loading and environmental condition.
In this test, a servo-hydraulic pump displaces a piston at a constant rate. The upward movement of the piston injects a liquid medium (alcohol) at a constant rate of 0.1L/hr through a channel that is connected to the specimen (Figure 27). The specimen is composed of an annular (donut-shaped) substrate plate (aggregate or a standard material) covered with binder or sealant on one side. Alcohol pushes the adhesive (binder or sealant) away from the substrate creating a blister which continues to grow until the adhesive separates from the substrate. The blister height and the pressure are recorded during the test and they are used to calculate the IFE. In simplified form, IFE can be calculated as half of the product of the maximum pressure and the corresponding blister height. In addition to IFE, adhesive modulus can be determined from this test using the test data before debonding occurs. In addition, residual stress developed at the interface during the sample preparation process can be obtained.
Figure 28 shows the IFE values for several sealant-substrates. It clearly shows that IFE can differentiate among sealants at different temperatures. The crack sealant blister test was
0 50 100 150 200 250 300 350 2 -4 -10 -16 -22 IF E ( J /m 2) EE DD UU AB QQ (a) 0 200 400 600 800 1000 1200 -22 -34 -40 IF E ( J /m 2) AD BB PP NN LL AE MM (b)
Figure 28. IFE for 12 Sealants at Temperature Ranging from a) 2 to -22ºC; and b) -22 to -40ºC
further used to study the effect of sealant aging, temperature, loading rate, viscosity, and curing time on interface bonding. Al-Qadi et al. (2008a) found that aging significantly affects interface bonding; depending on the sealant property, IFE may increase/ decrease due to aging (Figure 29). In addition, within-laboratory variation was checked; and no significant difference was found between operators.
Sealant IFE strongly depends on temperature and loading rate; this dependence varies based on material condition (rubbery vs. glassy stages). The IFE of eight aged sealants and three binders were determined at various temperatures. A master curve was constructed for sealant UU which could be tested at the widest temperature range varying from -4 to -34ºC. It was found that when the adhesives are in their rubbery stage, the IFE increases as temperature decreases. However, in the glassy stage, the opposite trend was observed (Figure 30). This study concluded that an optimum interface bonding can be achieved at specific temperature and loading rate identified for each sealant. Knowing the expected loading rate in the field and using a loading rate-temperature master curve, an IFE range can be identified for a specific
temperature to ensure acceptable bonding (Fini et al., 2008). In addition, testing results showed that high-viscosity sealants adhere better as long as substrate surface is adequately wetted (Al-
0 100 200 300 400 500 600 700 ZZ+2 QQ+2 UU-16 NN-34 AE-40 LL-22 IF E ( J /m 2) Aged Unaged
Figure 29. IFE for Aluminum with Aged and Non-Aged Sealants
y = 177.9 e-0.22x R2 = 0.82 y = 1300 e0.48x R2 = 0.96 0 100 200 300 400 -8 -6 -4 -2 0 2 4 6 8 Log (RaT) IF EPe a k (T g /T ), kPa
Figure 30. IFE versus Reduced Loading Rate for Sealant UU Bonded to Aluminum
Qadi et al., 2008e). Effect of curing time was also investigated; sealant cured for 24 hr at room temperature has significantly higher life than that cured for 1 hr (Al-Qadi et al., 2007).
SUMMARY AND CONCLUSIONS
New sealant tests were developed based on the performance of sealants tested in the field and on the characterization of other sealants widely used in North America. The newly
developed procedures provide fundamental sealant properties that include apparent viscosity at the recommended installation temperature, vacuum oven aging to simulate sealant weathering in the field, a DSR test to assess sealant’s tracking resistance at high service temperatures, the CSBBR test to evaluate sealant’s creep properties at low temperatures, the CSDTT to characterize sealant’s low temperature extendibility, and low temperature adhesive (surface energy, direct adhesion, and blister) tests to evaluate the bonding between sealant and its substrate.
Extensive laboratory testing, regular consultation with the project’s 26-member technical advisory committee, and limited field testing support conclusions that were used to develop a draft set of performance criteria for crack sealants. Those conclusions and criteria are
summarized as follow:
• An apparent viscosity at installation temperature of between 1 and 3.5 Pa.s provides for good crack filling while not being excessively fluid. Note that this test is the only
test performed on un-aged material.
• Resistance to tracking at high service temperatures can be controlled using a minimum flow coefficient of 4 kPa.s and a shear thinning exponent of 0.7, as determined using a dynamic shear rheometer (DSR).
• Using the modified BBR test (CSBBR), a maximum stiffness at 240 s of 25 MPa and minimum average creep rate of 0.31 will promote good field performance of sealant materials that must withstand low-temperature service conditions.
• Extendibility, as measured with the CSDTT, is another good measure of expected low-temperature performance of crack sealants. The threshold for good expected performance is tied to the lowest application temperature (plus a 6°C shift), which is reported in Table 4.
• At this time, the direct adhesion test is best suited (of the three adhesion tests that were developed) for use in a practical performance-based guideline. A minimum load of 50 N at tested temperature coincides with good field performance for sealant adhesion.
RECOMMENDATIONS
A systematic process for the selection of hot-poured crack sealants is proposed. This process, including performance guidelines for crack sealant grading, is described in detail in Appendix B. The following recommendations relate to these newly developed guidelines.
1. AASHTO representatives from the sponsoring member states of this pooled fund study (No. TPF-5[045]) should submit the developed tests and guidelines for consideration as provisional AASHTO specifications.
2. The Virginia Transportation Research Council in collaboration with the University of Illinois should pursue a second pooled funded research program to validate and implement the guidelines for selection of hot-poured crack sealants.
COSTS AND BENEFITS ASSESSMENT
In this study, a systematic approach is proposed to help state agencies select more effective and durable crack sealing material. A study conducted by Ontario’s Ministry of Transportation (MTO) during the 1970s to 1980s, which included several field test sections to investigate the influence of crack sealing on pavement distress and performance, shows that with effective crack sealing techniques, at least two years of service life extension can be added to flexible pavements (Chong, 1987). Ponniah and Kennepohl (1996) indicate that most of the premature sealant failure occurs after the first year of installation and is mainly due to unsuitable material and inappropriate installation techniques. In their study, the authors also show a cost-benefit ratio of 1.48 through effective sealing of pavement.
A recent survey on the pavement preventive maintenance programs (PPM) of 18
transportation agencies in North America shows that 13 transportation agencies have established PPM programs, and crack sealing is routinely used as treatment in the PPM program (AASHTO, 2006). The budgets for the PPM programs of each transportation agency are listed in Table 5. For example, the Commonwealth of Virginia spends approximately $20M/year on crack sealing (Liston, 2002). If sealant life is doubled through better selection procedures, then annual savings of $20M/year are possible. More conservatively, the cost-benefit multiplier from Ponniah and Kennepohl’s work can be applied to the North American survey to determine a nation-wide estimate of savings. If each PPM program with a dedicated budget devoted only 10% to crack sealing, the total annual savings for these 18 states would be nearly $30M/year.
Table 5. Budget and Miles Covered by Pavement Preventive Maintenance Program for 18 Transportation Agencies in North America
Transportation Agency PPM Budget ($) Miles cover by PPM
Alberta Transportation Yes 12M 16875 Alaska DOT Yes 100M 14500 Missouri DOT No Not dedicated 10000 Illinois DOT Yes 50M 14292 South Dakota DOT No Not dedicated 7500 Washington DOT Yes 25M 17800 Hawaii DOT No Not dedicated 1000
Idaho DOT No 4M 12000
New York DOT Yes 70M 28925 New Jersey DOT Yes 60M 8500 Vermont DOT Yes 10-20M 1600 Georgia DOT Yes 89M 18000 Oregon DOT No Not dedicated 18000 Delaware DOT Yes 40-45M 5700 Louisiana DOT Yes 12M 12400
Iowa DOT Yes 11M 9350
Michigan DOT Yes 81M 1203 Rhode Island DOT Yes 4M 1100
ACKNOWLEDGMENTS
This study is based upon work supported by the Federal Highway Administration and the U.S.–Canadian Crack Sealant Consortium under pool fund award No. TPF5 (045). Virginia served as the Lead State; the Virginia Transportation Research Council of the Virginia
Department of Transportation managed the project. The contribution of the participating states, industries, and provinces is greatly appreciated. The contents of this report reflect the views of the authors, who are responsible for the facts and the accuracy of the data presented herein. The content does not necessarily reflect the official views or policies of the pool fund-participating departments of transportation or the Federal Highway Administration. This paper does not constitute a standard, specification, or regulation. Special thanks are extended to Amara Loulizi, Mostafa Elseifi, William Hobbs, Samer Dessouky, and Hector Figueroa Hernandez.
The authors also acknowledge the guidance and input of the technical advisory committee consisting of the following members (listed with their respective state, city, or agency): Alan Lugg (New Hampshire), William R. Bailey III (Virginia), Charles Drda (Connecticut), Edward Denehy (New York), James McGraw (Minnesota), John Bohuslav (Texas), Larry Chung and Wasi Kahn (Washington D.C.), Michael Eacker (Michigan), Moussa Issa (Georgia), Colin Franco (Rhode Island), Timothy Soucie (Maine), Steven Mueller and Joseph Gregory (FHWA), Al Cepas (City of Edmonton), Alan Herring (Greater Toronto Airport Authority), Bill Mason (City of Toronto), Bob Hardy (Department of National Defense-Canada), David Watson (Regional Municipality of Niagara), Ed d’Antoni (City of Calgary), Fred Abalos (Regional Municipality of Peel), Gelu Vasiliu and Graham Hagens (Lafarge), John Blair and Joseph Ponniah (Ministry of Transportation of Ontario), Ken Boyd (City of Winnipeg), Len Gardiner (Regional Municipality of Peel), Louis Zidar (Region of Peel), Normand Chevalier (City of Ottawa), Ray Clement (Department of National Defense-Canada), Steve Goodman (City of Ottawa), and Tony Kucharek (McAsphalt Industries Ltd.).
REFERENCES
AASHTO. Responses to Request for PPM Information (online). American Association of State Highway and Transportation Officials (AASHTO) Standing Committee on Research (SCOR), and its Research Advisory Committee (RAC). Available from:
www.transportation.org/sites/research/docs/PPM%20information.doc, 2006 [Accessed 8 November 2007].
Al-Qadi, I.L., Masson, J-F, Loulizi, A., Collins, P., Woods, J.R., Bundalo-Perc, S., and McGhee, K. Long-Term Accelerated Aging and Low Temperature BBR Testing of Sealants, Interim Report No. B5508-5, National Research Council of Canada, 2004.
Al-Qadi, I., Loulizi, A., Aref, S., Masson, J-F, and McGhee, K. Modification of Bending Beam Rheometer Specimen for Low-temperature Evaluation of Bituminous Crack Sealants.
Transportation Research Record: Journal of the Transportation Research Board, No.
Al-Qadi, I.L., Masson, J-F, Dessouky, S., Collins, P., Yang, S-H, Bundalo-Perc, S., Fini, E., Elseifi, M., and McGhee, K. Development of Performance Guidelines for Selection of
Hot-Poured Crack Sealants. Interim Report No. B5508-7, National Research Council of Canada, September 2005.
Al-Qadi, I.L., Fini, E., Elseifi, M., Masson, J-F, and McGhee, K. Procedure for Viscosity Determination of Hot-Poured Bituminous Sealants. Transportation Research Record:
Journal of the Transportation Research Board, No. 1958, 2006, pp. 74-81.
Al-Qadi, I., Yang, S-H, Elseifi, M., Masson, J-F, and McGhee, K. Specifications of
Bituminous-Based Crack Sealants Using Modified Bending Beam Rheometer, TRB Paper No. 06-1882. Annual Meeting of the Transportation Research Board, National Research Council, Washington D.C., 2006.
Al-Qadi, I.L, Yang, S-H., Dessouky, S., Masson, J-F, Loulizi, A., and Elseifi, M. Development of Crack Sealant Bending Beam Rheometer (CSBBR) Testing to Characterize Hot-Poured Bituminous Crack Sealant at Low Temperature. Journal of AAPT, Vol. 76, 2007, pp. 85-122.
Al-Qadi, I.L., Fini, E., and Masson, J-F. Prediction of Bituminous Sealant-Aggregate Bond
Strength and Curing Time Using a Newly Developed Blister Test. Proceedings of the International Conference on Advanced Characterisation of Pavement and Soil
Engineering Materials. A. Loizos, T. Scarpas, and I.L. Al-Qadi, Eds., Athens, Greece, June 2007, pp. 1253-1262.
Al-Qadi, I.L, Yang, S-H, Dessouky, S., and Masson, J-F. Low Temperature Characterization of Hot-Poured Crack Sealant Using Modified SHRP Direct Tensile Tester. Transportation
Research Record: Journal of the Transportation Research Board, No. 1991, October 2007, pp. 109-118.
Al-Qadi, I.L., E.H. Fini, H.D. Figueroa, J.-F. Masson, and K.K. McGhee, Adhesion Testing
Procedure for Hot-Poured Crack Sealants, Final Report, Illinois Center for Transportation, Report No. ICT-08-026, Rantoul, IL, December 2008(a).
Al-Qadi, I.L., E.H. Fini, J.-F. Masson, A. Loulizi, K.K. McGhee, and M.A. Elseifi, Development
of Apparent Viscosity Test for Hot-Poured Crack Sealants, Final Report, Illinois Center for Transportation, No. ICT-08-027, Rantoul, IL, December 2008(b).
Al-Qadi, I.L., S.-H. Yang, J.-F. Masson, and K.K. McGhee, Characterization of Low
Temperature Mechanical Properties of Crack Sealants Utilizing Direct Tension Test,
Final Report, Illinois Center for Transportation, No. ICT-08-028, Rantoul, IL, December 2008(c).
Al-Qadi, I.L., S.-H. Yang, M.A. Elseifi, S. Dessouky, A. Loulizi, J.-F. Masson, and K.K. McGhee, Characterization of Low Temperature Creep Properties of Crack Sealants