Publisher’s version / Version de l'éditeur: NeuroImage, 50, 2, pp. 616-621, 2010-01-04
READ THESE TERMS AND CONDITIONS CAREFULLY BEFORE USING THIS WEBSITE.
https://nrc-publications.canada.ca/eng/copyright
Vous avez des questions? Nous pouvons vous aider. Pour communiquer directement avec un auteur, consultez la première page de la revue dans laquelle son article a été publié afin de trouver ses coordonnées. Si vous n’arrivez pas à les repérer, communiquez avec nous à PublicationsArchive-ArchivesPublications@nrc-cnrc.gc.ca.
Questions? Contact the NRC Publications Archive team at
PublicationsArchive-ArchivesPublications@nrc-cnrc.gc.ca. If you wish to email the authors directly, please see the first page of the publication for their contact information.
NRC Publications Archive
Archives des publications du CNRC
This publication could be one of several versions: author’s original, accepted manuscript or the publisher’s version. / La version de cette publication peut être l’une des suivantes : la version prépublication de l’auteur, la version acceptée du manuscrit ou la version de l’éditeur.
For the publisher’s version, please access the DOI link below./ Pour consulter la version de l’éditeur, utilisez le lien DOI ci-dessous.
https://doi.org/10.1016/j.neuroimage.2009.12.102
Access and use of this website and the material on it are subject to the Terms and Conditions set forth at Confirming white matter fMRI activation in the corpus callosum : Co-localization with DTI tractography
Mazerolle, Erin L.; Beyea, Steven D.; Gawryluk, Jodie R.; Brewer, Kimberly D.; Bowen, Chris V.; D'Arcy, Ryan C. N.
https://publications-cnrc.canada.ca/fra/droits
L’accès à ce site Web et l’utilisation de son contenu sont assujettis aux conditions présentées dans le site LISEZ CES CONDITIONS ATTENTIVEMENT AVANT D’UTILISER CE SITE WEB.
NRC Publications Record / Notice d'Archives des publications de CNRC: https://nrc-publications.canada.ca/eng/view/object/?id=72f98f32-d06e-4b81-92e9-86f107cdf2e3 https://publications-cnrc.canada.ca/fra/voir/objet/?id=72f98f32-d06e-4b81-92e9-86f107cdf2e3
Confirming white matter fMRI activation in the corpus callosum:
Co-localization with DTI tractography
Mazerolle, Erin L.; Beyea, Steven D.; Gawryluk, Jodie R.; Brewer, Kimberly
D.; Bowen, Chris V.; D’Arcy, Ryan C. N.
Abstract
Recently, functional magnetic resonance imaging (fMRI) activation has been detected in white matter, despite the widely-held belief that fMRI activation is restricted to gray matter. The objective of the current study was to determine whether the regions of white matter fMRI activation were structurally connected to the functional network in gray matter. To do this, we used fMRI-guided tractography to evaluate whether tracts connecting regions of gray matter fMRI activation were co-localized with white matter fMRI activation. An established
interhemispheric transfer task was employed to elicit activation in the corpus callosum. Diffusion tensor imaging (DTI) tractography was used to determine the existence of tracts that connected regions of gray matter fMRI activation to regions of activation in the corpus callosum. Corpus callosum activation was detected in the majority of participants. While there was individual variability in the location of corpus callosum activation, activation was commonly observed in the callosal mid-body, isthmus/splenium, or both. Despite the variability, gray matter fMRI-guided tractography identified tracts that were co-localized with corpus callosum fMRI
activation in all instances. In addition, callosal activation had tracts to bilateral gray matter fMRI activation for 7/8 participants. The results confirmed that the activated regions of the corpus callosum were structurally connected to the functional network of gray matter regions involved in the task. These findings are an important step towards establishing the functional significance of white matter fMRI, and provide the foundation for future work combining white matter fMRI and DTI tractography to study brain connectivity.
Introduction
White matter activation in functional magnetic resonance imaging (fMRI) is controversial. Traditionally, it has been thought that fMRI is restricted to gray matter due to the relatively greater blood flow and volume in gray matter ([Helenius et al., 2003], [Preibisch and Haase, 2001], [Rostrup et al., 2000], [Van der Zande et al., 2005] and [Wise et al., 2004]). In addition, it is thought that the primary source of fMRI signals are hemodynamic responses to post-synaptic potentials, which mainly occur in gray matter (e.g., Logothetis et al., 2001. I deed, it has ee stated that a reaso a le i estigator a dou t the prese e of a lood o ge le el depe de t sig al i hite atter altogether Logothetis and Wandell, 2004, p. 755). Despite these issues, there is no direct evidence that precludes the possibility of detecting white matter fMRI activation. It has been suggested that the energy-dependent processes that take place in white matter may result in task-dependent changes, which could be measured with fMRI ([Mazerolle et al., 2008] and [Tettamanti et al., 2002]).
We have recently reported evidence for white matter fMRI activation at 4 Tesla using
interhemispheric transfer tasks that specifically target the corpus callosum. Such tasks, in which functionally lateralized stimuli (words and faces) are presented to the right and left visual
hemifields, have been used to study disconnection syndromes in split brain patients (Gazzaniga, Bogen, and Sperry, 1965) and have been previously developed for fMRI (D'Arcy et al., 2006). Mazerolle et al. (2008) reported activation in the isthmus of the corpus callosum in 21% of individuals. Group level activation was also observed in this region, but at relaxed statistical thresholds (p < 0.005, uncorrected). Using a visuo-motor interhemispheric transfer task
(lateralized light flashes; [Poffenberger, 1912] and [Iacoboni and Zaidel, 2004]), Gawryluk and colleagues (2009a) reported white matter fMRI activation in 100% of individuals (using standard statistical thresholds) by improving sensitivity to white matter fMRI activation through increased T2 weighting of the functional images. Further support for white matter fMRI comes from other groups that have reported fMRI activation in white matter structures ([Maldjian et al., 1999], [Mosier and Bereznaya, 2001], [Omura et al., 2004], [Tettamanti et al., 2002], [Weber et al., 2005], [Yarkoni et al., 2009] and [Zeffiro et al., 2007]).
With a growing number of reports of fMRI activation in white matter, it is important to determine how white matter fMRI activation is related to the functional gray matter network activated by a task. To do this, we have employed diffusion tensor imaging (DTI) tractography to evaluate whether regions of white matter fMRI activation have structural connections to
activated gray matter. Previous work has shown that fMRI-guided tractography can be successfully used in order to identify the structural connections within functional networks, including callosally-mediated networks (e.g., Lowe et al., 2006). Given this, it should be possible to use DTI tractography to determine whether the corpus callosum activation elicited during an interhemispheric transfer task is structurally connected to the functionally activated networks in gray matter.
In the current study, corpus callosum activation and corresponding tractography analyses were examined at the individual level. The objective was to determine whether the corpus callosum activation was co-localized with tracts seeded from activated clusters in gray matter. To test this hypothesis, a deterministic tractography algorithm was employed using the whole brain as a seed. Subsequently, regions-of-interest (ROIs) were defined within both the white matter activation of the corpus callosum (CC), as well as the cortical gray matter (GM) activation. The ROIs were used to identify whether a subset of fibres existed that tracked through both GM and CC activation.
Materials and methods Participants
Ten healthy participants (five females) took part in the study. The mean age of participants was 25.8 ± 6.0 years (range 19–40). The mean laterality quotient (measured using the Edinburgh Handedness Inventory; Oldfield, 1971) was 87.5 ± 15.6 (range 55–100), indicating that the participants were right-handed. The study was approved by local research ethics boards. Each participant provided written informed consent prior to participation and received compensation for participating.
Experimental design
The participants performed an established interhemispheric transfer task (Mazerolle et al., 2008). Stimuli consisted of faces (right hemisphere stimuli) and words (left hemisphere stimuli) that were presented to the left and right visual fields (i.e., either directly to the relatively specialized hemisphere, or to the opposite hemisphere) in order to elicit interhemispheric transfer. Stimuli were either real (i.e., intact faces or words) or scrambled (i.e., faces with the features rearranged or pseudowords). On each trial, participants were asked to evaluate whether the stimulus
presented was real or scrambled by pressing a button on an MR compatible response box (i.e., four button forced choice). Response hand was crossed for all trials (i.e., left hand for words and right hand for faces). All stimuli were presented laterally (> 2.3° from fixation) and rapidly (150 ms) in order to initially stimulate one hemisphere and avoid saccades. A ―+‖ was displayed at the centre of the screen for the duration of the experiment; participants were asked to
continually fixate on this point. E-Prime (Psychology Software Tools, Inc.) was used to present stimuli, which were displayed using back-projection to a screen mounted inside the bore, and viewed through a mirror mounted on the head coil. Prior to the experiment, each participant performed a short practice task (with feedback) to ensure compliance.
MRI acquisition
Data were acquired from a 4 T Varian INOVA whole body MRI system. Gradients were provided by a body coil (Tesla Engineering Ltd.) operating at a maximum of 35.5 mT/m at 120 T/m/s, and driven by 950 V amplifiers (PCI). A TEM head coil (Bioengineering Inc.) was employed.
FMRI acquisition
FMRI was conducted using an asymmetric spin echo (ASE) spiral sequence (Brewer et al., 2009). The ASE spiral sequence collects three images per slice per volume, one prior and two after a radiofrequency refocusing pulse. The T2′ weighting1
of these images is determined by the TE parameter (see below) and is constant across the three images. The T2 weighting of these images, however, increases across the three images (determined by TE). Seventeen axial slices (4 mm thick, no gap) were prescribed to cover the corpus callosum, as well as the region extending superiorly. Other parameters for functional imaging were: 64 × 64 matrix
(220 × 220 mm), 1 shot, 170 volumes, TR/TE/TE = 2000/68/27 ms (TE/TE are the spin-echo centre and asymmetric echo times, respectively; Brewer et al., 2009).
DTI acquisition
Diffusion tensor imaging data were acquired using a single shot spin echo spiral sequence. Twenty-four axial slices (3 mm thick, no gap) were collected, prescribed such that they were centred over the functional slab. A 64 × 64 matrix (220 × 220 mm) was used, with
TR/TE = 6000/100 ms and NEX = 2. Diffusion weighting was distributed along 30 directions (maximum b value = 1007 s/mm2). After every 10 diffusion weighted images, an image with a b value of 0 was acquired (for a total of three b = 0 images). Using these parameters, DTI data
were acquired in approximately eight minutes, which was necessary in order to ensure adequate time for the fMRI and structural image acquisitions.
Structural image acquisition
Following the functional MRI and DTI scans, a 3D MP FLASH whole brain anatomical image (72 2 mm axial slices) was collected, with TR/TI/TE = 10/500/5 ms.
Data analyses
FMRI analysis
In order to increase the overall T2 weighting of the combined image, the three ASE images were combined using an inverted signal weighted averaging algorithm (Gawryluk et al., 2009a). Statistical analyses were performed using the general linear model with fMRI expert analysis tool (FEAT) version 5.3 in FMRIB Software Library (FSL) (Smith et al., 2004). Pre-statistics processing included the following steps: motion correction using FSL's MCFLIRT2 (Jenkinson et al., 2002), non-brain removal using FSL's BET (Smith, 2002), spatial smoothing using a
Gaussian kernel of FWHM 6 mm, mean-based intensity normalisation, and highpass temporal filtering (100 s cutoff). Time-series statistical analyses were carried out using FILM with local autocorrelation correction (Woolrich et al., 2001). Motion parameters (output from the motion correction) were included in the model as regressors of no interest. Z statistic images were reported using a threshold for clusters determined by Z > 3.0 and a (corrected) cluster
significance threshold of p = 0.05 (Worsley et al., 1992). FSL's FLIRT was used to register the activation maps to structural space (seven degrees of freedom [DOF]).
DTI and tractography analysis
First, DTI data were resampled to a resolution of 1.7 × 1.7 × 2 mm voxels. These data were then corrected for motion using a six parameter registration3 (Jenkinson and Smith, 2001), which was followed by combining the two averages. A binary mask differentiating brain and non-brain matter was calculated with BET (Smith, 2002) from a volume with no diffusion weighting. This mask was applied to the entire DTI dataset. Deterministic tractography was then performed (using all voxels as seeds) in MedINRIA's DTI Track (Filliard et al., 2006). A fractional
anisotropy threshold of 0.2 was applied. The high resolution T1-weighted anatomical image was registered to a volume with no diffusion weighting using seven DOF in FSL's FLIRT
([Jenkinson et al., 2002] and [Jenkinson and Smith, 2001]).
FMRI-guided tractography analysis
The tractography analysis was guided by two functionally defined regions: (1) an ROI of CC activation, and (2) an ROI of cortical GM activation. First, activation maps were transformed into diffusion space. For the GM activation ROI, partial volume maps for gray matter, white matter, and cerebrospinal fluid (CSF) were created from the structural image automatically using FSL's FAST (Zhang et al., 2001). As has been previously noted, intensity-based segmentations can result in voxels at the interface of white matter and ventricles being misclassified as gray
matter (Ashburner and Friston, 2000). In order to reduce this problem, the gray matter partial volume maps were thresholded such that a voxel was only considered gray matter if the probability that it was gray matter was higher than white matter and CSF. The mask was then transformed into the diffusion-registered structural space. The resulting mask was applied to the activation maps for each participant in order to create GM activation ROIs. Any remaining subcortical voxels (i.e., voxels at the white matter-CSF interface that survived the threshold procedure or activation in subcortical gray matter structures) were manually removed. Due to the isotropic diffusion and subsequent tractography difficulties in gray matter, the GM activation ROI was dilated using a 6-mm spherical kernel in order to ensure that GM activation ROI on the gray matter-white matter borders extended into white matter. For each subject, the GM activation ROI was also divided into the right and left hemispheres in order to evaluate whether tracts reached bilateral gray matter activation.
The CC activation ROIs were manually defined. First, the activation maps were overlaid on the diffusion-registered structural space. To be included in the CC activation ROI, voxels had to appear to be on the CC in the axial, sagittal, and coronal views. In addition, the clusters had to have a local maximum on the CC. By ensuring the clusters had a local maximum on the CC as opposed to neighbouring gray matter, the potential contributions of partial volume effects were reduced. Fig. 1 shows the fMRI activation and resulting CC and GM activation ROIs used for the fMRI-guided tractography analysis in a representative subject.
Fig. 1.
(A) A single subject's fMRI activation (Z > 3), and (B) the corresponding ROIs for fMRI-guided tractography (green: gray matter activation ROI; red: corpus callosum activation ROI; post: posterior; ant: anterior; sup: superior; inf: inferior).
For each participant, the CC activation ROIs and GM activation ROIs were imported into MedINRIA's DTI Track to identify whether any fibres existed that passed through both regions. Fibres were identified using the criterion that they had to overlap with voxels in both the CC and
GM activation ROIs. Because the data were not transformed to standard space, brain regions were identified via visual inspection.
The results were further evaluated in two ways. First, percent signal change was calculated in order to allow comparisons between gray matter and white matter activation intensity, as well as with previous studies. The CC and GM activation ROIs from the fMRI-guided tractography analysis were used as masks to calculate percent signal change based on the parameter estimates using FSL's Featquery. Second, the selectivity of the tractography analysis was assessed by determining the number of activated gray matter voxels with tracts to contralateral gray matter activation (i.e., candidate voxels for having tracts to the CC activation ROI). The percentage of these voxels that were also associated with tracts passing through the CC activation ROI was then calculated. In addition, we calculated the percentage of midsagittal CC voxels that contained tracts connecting bilateral GM activation.
Results
Overview of corpus callosum activation
Group level fMRI activation results are reported elsewhere (Gawryluk et al., 2009b). Of the 10 subjects, eight4 had corpus callosum activation as defined above. Among these eight subjects, the location of the CC activation varied. Four subjects had both posterior and anterior CC activation (either one or two clusters in the splenium/isthmus and the mid-body of the corpus callosum). Two subjects had activation restricted to posterior CC regions. One subject had both mid-body and genu activation, and the remaining subject had activation in the genu only.
FMRI-guided tractography results
Of the eight subjects with CC activation, fMRI-guided tractography demonstrated that seven had fibres connecting regions of CC activation to bilateral GM activation. All seven subjects had tracts extending to premotor regions, parietal regions, or both. A representative subject with this pattern of results is presented in Fig. 2. Two other subjects had tracts to both premotor and parietal regions, with additional tracts to temporal regions (Supplementary Figs. 1 and 2). One subject had tracts to premotor regions only, despite a small posterior CC activation in addition to activation in the mid-body (Supplementary Fig. 3). One subject had a tract to prefrontal regions in addition to premotor regions (Supplementary Fig. 4). Two subjects did not have tracts to premotor regions; one had tracts extending to superior occipital/inferior parietal regions only (Supplementary Fig. 5), whereas the other had both parietal and medial temporal tractography targets (Supplementary Fig. 6).
Fig. 2.
FMRI-guided tractography results for a representative subject (subject 1; green: left hemisphere gray matter activation ROI; yellow: right hemisphere gray matter activation ROI; red: corpus callosum activation ROI; black: tracts passing through all three ROIs; P: posterior; A: anterior; S: superior; I: inferior; R: right; L: left). The top images show fibres passing through corpus callosum activation in the sagittal view (left) and axial views (centre: isthmus activation; right: mid-body activation; blue arrows). The bottom image shows an axial view of tracts reaching targets in premotor cortex (magenta arrows) and parietal cortex (white arrows).
The eighth subject with CC activation had tracts to prefrontal regions, but these tracts reached activation in the right hemisphere only (i.e., did not meet the criterion of tracking to bilateral gray matter activation targets). This subject is presented in Supplementary Fig. 7.
Percent signal change analysis
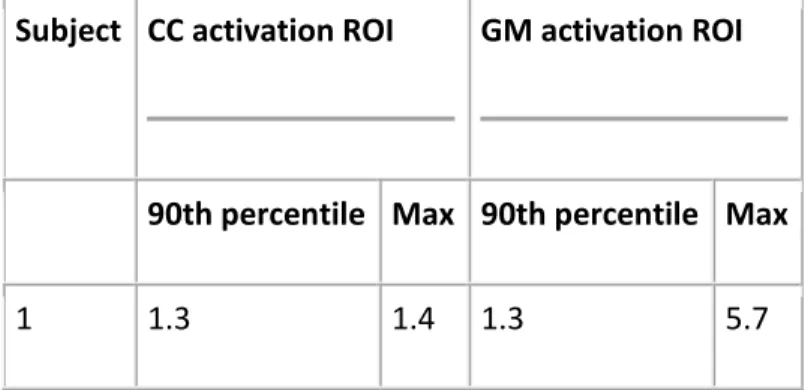
The percent signal change values (90th percentile and maximum) for the CC and GM activation ROIs can be found in Table 1. Note that the maximum percent signal change values were, on average, about 4.5 times larger in the gray matter than the corpus callosum.
Table 1. Percent signal change across CC and GM activation ROIs. The same ROIs were used for the tractography analysis.
Subject CC activation ROI GM activation ROI
90th percentile Max 90th percentile Max
Subject CC activation ROI GM activation ROI
90th percentile Max 90th percentile Max
2 0.6 0.6 1.1 4.2 3 0.6 1.2 1.6 5.3 4 0.8 1.1 1.4 4.0 5 0.9 1.0 1.1 4.5 6 0.3 0.3 0.8 2.1 7 0.4 0.7 1.0 3.3 8 0.7 1.0 1.4 6.1 9 - - 1.0 2.6 10 - - 1.3 4.5 Mean 0.70 0.91 1.20 4.23
The callosal activation did not track to bilateral gray matter targets for subject 8 (reached right hemisphere gray matter activation only).
Evaluating the selectivity of the fMRI guided tractography analysis
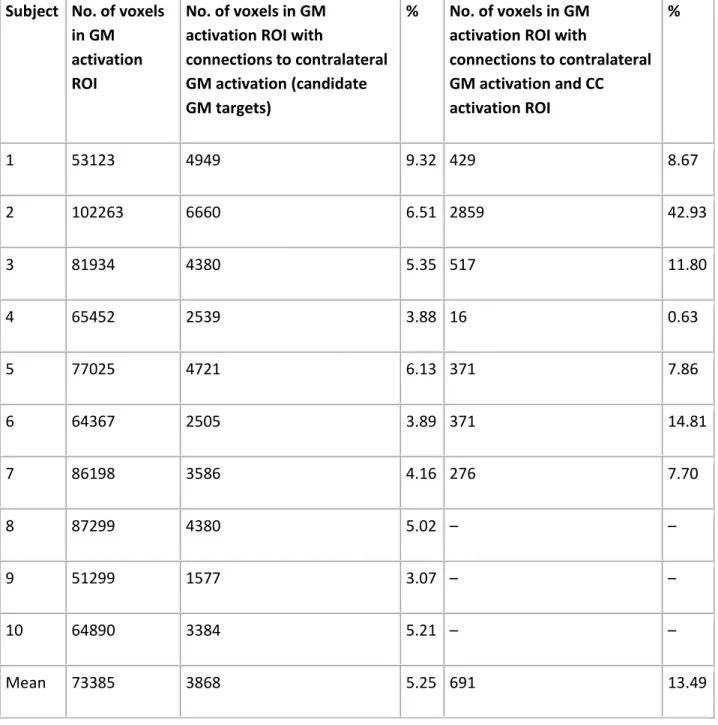
Given the distributed network of activated gray matter regions (see Fig. 2 and Supplementary Figs. 1–7), it was important to quantitatively evaluate the relationship between the activation in GM and CC regions. Table 2 shows that, on average, about 5% of activated GM voxels had connections to contralateral GM activation. Of these candidate GM activation voxels,
approximately 13% were structurally connected to the CC activation ROI. The mean percentage of midsagittal CC voxels with tracts connecting bilateral GM activation was 49 ± 11%.
Table 2. Analysis of the selectivity of the fMRI-guided tractography analysis. See text for details. Subject No. of voxels
in GM activation ROI
No. of voxels in GM activation ROI with
connections to contralateral GM activation (candidate GM targets)
% No. of voxels in GM activation ROI with
connections to contralateral GM activation and CC activation ROI % 1 53123 4949 9.32 429 8.67 2 102263 6660 6.51 2859 42.93 3 81934 4380 5.35 517 11.80 4 65452 2539 3.88 16 0.63 5 77025 4721 6.13 371 7.86 6 64367 2505 3.89 371 14.81 7 86198 3586 4.16 276 7.70 8 87299 4380 5.02 – – 9 51299 1577 3.07 – – 10 64890 3384 5.21 – – Mean 73385 3868 5.25 691 13.49 Discussion
Using fMRI-guided tractography, we confirmed that the white matter fMRI activation in the corpus callosum was structurally connected to the functional network in gray matter activated during the interhemispheric transfer task. This result occurred for eight out of 10 subjects, with seven subjects meeting the additional criterion of tracking to bilateral gray matter activation.
The analyses presented here were performed at the individual level, allowing an examination of the differences in terms of CC activation across individuals. The majority of subjects (six) had activation in posterior CC regions (isthmus or splenium), consistent with previous results (Mazerolle et al., 2008). However, four of these subjects also had anterior CC activation. Two additional subjects had CC activation that was restricted to more anterior regions (mid-body or genu). The variability in terms of the location of CC activation was also reflected in the fMRI-guided tractography analysis. In general, the CC activation described above was associated with tracts to GM activation in regions that are consistent with what is known about the anatomy of the CC (e.g., connections between the isthmus and parietal cortex; Zarei et al., 2006).
The increased variability in the location of CC activation relative to previous results might be explained by differences in white matter fMRI sensitivity between the two studies. The previous study employed a more typical T2 weighted fMRI acquisition and reported a considerably lower percentage of individuals with CC activation (21% versus the 80% reported here;
Mazerolle et al., 2008). It is possible that the increased sensitivity provided by ASE spiral fMRI acquisition and increased T2 weighting ([Brewer et al., 2009] and [Gawryluk et al., 2009a]) allowed detection of white matter activation not only in more subjects, but also across a larger region of the corpus callosum. Given what is known about inter-individual functional anatomy differences in gray matter (e.g., Brett, 2002), such variability in white matter fMRI activation is not surprising. However, the functional significance of this regional variability within the corpus callosum, as well as how this variability relates to the activated networks of gray matter regions, remains to be determined. Future work with a larger sample size is necessary to better evaluate the inter-individual variability and identify the white matter fMRI activation and tractography patterns that are common within the population.
The analysis of percent signal change in gray and white matter supports previous claims that white matter fMRI activation is weaker than that of gray matter ([Gawryluk et al., 2009a], [Mazerolle et al., 2008], [Tettamanti et al., 2002] and [Yarkoni et al., 2009]). Sensitivity remains a major hurdle to potential applications of white matter fMRI. Previous work has demonstrated improved sensitivity to white matter fMRI activation through increased T2 weighting of fMRI pulse sequences (Gawryluk et al., 2009a). Ongoing work investigating the mechanisms of the effect of T2 weighting may provide additional insight that can be applied to further optimize sensitivity to white matter fMRI activation.
Given the distributed nature of the gray matter fMRI activation elicited by our task, it was important to evaluate the selectivity of the fMRI-guided tractography analysis. In order to ensure adequate sensitivity to white matter fMRI activation, which is relatively weak (Table 1), we designed the task to elicit strong activation across a number of interhemispheric brain networks (e.g., both face and word processing). However, this approach also resulted in extensive gray matter activation. Some measure of confidence in the results can be obtained by noting that the tracts we identified were consistent with what is already known about the organization of the corpus callosum (e.g., Zarei et al., 2006). In general, fMRI-guided tractography studies do not provide an indication of the false positive rate (i.e., the likelihood that a structural connection between two activated regions was identified by chance). We quantified the relationship between the GM and CC activation by determining the number of activated GM voxels with structural connections to contralateral gray matter activation. Then, we found the percentage of those
voxels that also had tracts passing through the CC activation ROI (13%; Table 2). We also attempted to evaluate the specificity of the fMRI-guided tractography analysis by calculating the percentage of midsagittal CC voxels that contained tracts connecting bilateral GM activation. We found that 49% of midsagittal CC voxels had structural connections to bilateral GM activation. Ideally, the gray matter fMRI activation would be more specific, that is, most or all of the activated gray matter would be structurally connected to the CC activation. Ongoing work is aimed at improving the experimental task such that smaller networks of gray matter activation are elicited.
There are at least four caveats to consider when interpreting the relationship between the cortical gray matter and corpus callosum activation. First, due to relative insensitivity of the white matter fMRI technique (Table 1), it is possible that not all activated channels of the CC are detected. Thus, there may be activity in regions of the CC that is not observable using current acquisition and analysis techniques. Second, it is possible that some of the structural connections between bilateral gray matter activation are not functionally activated by the current task (i.e., true negatives). This issue highlights the fact that white matter fMRI may provide functional
information about brain networks that is not available using conventional measures of structural and functional brain connectivity (see below). Third, it is possible that some tracts are involved in inhibitory processes that result in CC activation without downstream activation in gray matter. This would prevent tracking to bilateral gray matter targets. Future work is needed to understand the physiological basis of white matter fMRI signals in order to evaluate this possibility. Fourth, structural connections between CC activation and gray matter activation may be difficult to detect in regions that have other large tracts coursing in different orientations. For example, fibres from the internal capsule and inferior longitude fasciculus may cross the callosal fibres that connect the temporal lobes (Park et al., 2008). This issue may be overcome by using advanced acquisition and analysis techniques (e.g., diffusion spectrum imaging; Wedeen et al., 2008).
The combination of white matter fMRI and DTI tractography is a novel multimodal approach to studying functional brain connectivity. Currently, studies of functional brain connectivity make inferences about brain connections using inter-regional correlations or causal modelling
approaches (e.g., dynamic causal modelling; Friston et al., 2003). Previous studies employing fMRI-guided tractography have focused on identifying the structural connections associated with gray matter fMRI activation (e.g., Lowe et al., 2006) or evaluating the relationships between functional and structural measures of connectivity (e.g., [Lowe et al., 2008], [Skudlarski et al., 2008] and [Greicius et al., 2009]). In contrast to these previous applications, our approach provides a more direct measure of the functional status of the structural connections involved in a particular task. While improved methods for evaluating the specificity of fMRI-guided
tractography remain to be developed, future studies may employ white matter fMRI to both identify the white matter region involved in a given task, as well as evaluate the region's functional dynamics (e.g., by measuring experimentally induced changes in the activation patterns within the white matter tissue itself).
By confirming white matter fMRI activation using fMRI-guided tractography, this work represents a significant advance for white matter fMRI, the existence of which has previously been doubted (e.g., Logothetis and Wandell, 2004). The co-localization of white matter fMRI
activation with tracts connected to regions of gray matter fMRI activation provides strong evidence that the white matter fMRI activation is not only functionally significant (e.g.,
[Gawryluk et al., 2009a], [Mazerolle et al., 2008], [Tettamanti et al., 2002] and [Yarkoni et al., 2009]), but also structurally connected to the activated gray matter network. White matter accounts for 40–45% of brain parenchyma (e.g., Black, 2007) and it is known that connections play a critical role in brain function. Furthermore, dysfunctions in brain connections have been implicated in numerous neurological and psychiatric diseases (e.g., [Bassett and Bullmore, 2009] and [Guye et al., 2008]). Given this, white matter fMRI has the potential be applied to answer highly relevant basic neuroscience questions (i.e., studying brain connectivity). In addition, fMRI activation in white matter may have future clinical applications. Indeed, fMRI investigations of neuropsychological tests for evaluating white matter diseases have shown (but not reported) group level activation in white matter ([Genova et al., 2009] and [Lazeron et al., 2003]). Given the variability observed in the current study, future work is needed to determine whether this concept can be meaningfully applied at the individual patient level.
Acknowledgments
The authors gratefully acknowledge the contributions of K. Dillen, C. Liu, and J. Marshall, who facilitated data collection. Thanks are also extended to Dr. T. Rolheiser for help with diffusion tensor imaging acquisition, and three anonymous reviewers for providing helpful feedback on an earlier version of this manuscript. This work was funded by the Natural Sciences and
Engineering Research Council of Canada, the National Research Council, the Killam Trusts, L'Oréal/UNESCO, Dalhousie University, the Scottish Rite Charitable Foundation, and the Nova Scotia Health Research Fund.
References
Ashburner and Friston, 2000 J. Ashburner and K.J. Friston, Voxel-based morphometry—the methods, NeuroImage 11 (2000), pp. 805–821.
Bassett and Bullmore, 2009 D.S. Bassett and E.T. Bullmore, Human brain networks in health and disease, Curr. Opin. Neurol. 22 (2009), pp. 340–347.
Black, 2007 S.E. Black, Imaging white matter and the burden of small vessel disease, Brain
Cogn. 63 (2007), pp. 191–196.
Brett, 2002 M. Brett, The problem of functional localization in the human brain, Nat. Rev.
Neurosci. 3 (2002), pp. 243–249.
Brewer et al., 2009 K.D. Brewer, J.A. Rioux, R.C.N. D'Arcy, C.V. Bowen and S.D. Beyea, Asymmetric spin-echo (ASE) spiral improves BOLD fMRI in inhomogeneous regions, NMR
Biomed. 22 (2009), pp. 654–662.
D'Arcy et al., 2006 R.C.N. D'Arcy, A. Hamilton, M. Jarmasz, S. Sullivan and G. Stroink, Exploratory data analysis reveals visuovisual interhemispheric transfer in functional magnetic resonance imaging, Mag. Reson. Med. 55 (2006), pp. 952–958.
Filliard et al., 2006 P. Filliard, N. Toussaint and X. Pennec, MedINRIA: DT-MRI processing and
visualization software, Similar NoE Tensor Workshop, Las Palmas (2006).
Friston et al., 2003 K.J. Friston, L. Harrison and W. Penny, Dynamic causal modelling,
NeuroImage 19 (2003), pp. 1273–1302.
Gawryluk et al., 2009a J.G. Gawryluk, K.D. Brewer, S.D. Beyea and R.C.N. D'Arcy, Optimizing the detection of white matter fMRI using asymmetric spin echo spiral, NeuroImage 45 (2009), pp. 83–88.
Gawryluk et al., 2009b Gawryluk, J.G., Dillen, K., Brewer, K.D., Mazerolle, E.L., Beyea, S.D., D'Arcy, R.C.N., 2009b. Exploring functional differentiation in the corpus callosum using white matter fMRI. In Proceedings of the 15th Annual Meeting of the Organization for Human Brain Mapping, San Francisco, USA.
Gazzaniga et al., 1965 M.S. Gazzaniga, J.E. Bogen and R.W. Sperry, Observations on visual perception after disconnexion of the cerebral hemispheres in man, Brain 88 (1965), pp. 221–236. Genova et al., 2009 H.M. Genova, F.G. Hillary, G. Wylie, B. Rypma and J. DeLuca,
Examination of processing speed deficits in multiple sclerosis using functional magnetic resonance imaging, J. Int. Neuropsychol. Soc. 15 (2009), pp. 383–393.
Greicius et al., 2009 M.D. Greicius, K. Supekar, V. Menon and R.F. Dougherty, Resting-state functional connectivity reflects structural connectivity in the default mode network, Cereb.
Cortex 19 (2009), pp. 72–78.
Guye et al., 2008 M. Guye, F. Bartolomei and J.P. Ranjeva, Imaging structural and functional connectivity: towards a unified definition of human brain organization?, Curr. Opin. Neurol. 21 (2008), pp. 393–403.
Helenius et al., 2003 J. Helenius, J. Perkiö, L. Soinne, L. Østergaard, R.A. Carano, O. Salonen, S. Savolainen, M. Kaste, H.J. Aronen and T. Tatlisumak, Cerebral hemodynamics in a healthy population measured by dynamic susceptibility contrast MR imaging, Acta Radiol. 44 (2003), pp. 538–546.
Iacoboni and Zaidel, 2004 M. Iacoboni and E. Zaidel, Interhemispheric visuo-motor integration in humans: the role of the superior parietal cortex, Neuropsychologia 42 (2004), pp. 419–425. Jenkinson and Smith, 2001 M. Jenkinson and S. Smith, A global optimisation method for robust affine registration of brain images, Med. Image Anal. 5 (2001), pp. 143–156.
Jenkinson et al., 2002 M. Jenkinson, P. Bannister, M. Brady and S. Smith, Improved optimization for the robust and accurate linear registration and motion correction of brain images, NeuroImage 17 (2002), pp. 825–841.
Lazeron et al., 2003 R.H.C. Lazeron, S.A.R.B. Rombouts, L. de Sonnevilee, F. Barkhof and P. Scheltens, A paced visual serial addition test for fMRI, J. Neurol. Sci. 213 (2003), pp. 29–34. Logothetis and Wandell, 2004 N.K. Logothetis and B.A. Wandell, Interpreting the BOLD signal,
Annu. Rev. Physiol. 66 (2004), pp. 735–769.
Logothetis et al., 2001 N.K. Logothetis, J. Pauls, M. Augath, T. Trinath and A. Oeltermann, Neurophysiological investigation of the basis of the fMRI signal, Nature 412 (2001), pp. 150– 157.
Lowe et al., 2006 M.J. Lowe, C. Horenstein, J.G. Hirsch, R.A. Marrie, L. Stone, P.K.
Bhattacharyya, A. Gass and M.D. Phillips, Functional pathway-defined MRI diffusion measures reveal increased transverse diffusivity of water in multiple sclerosis, NeuroImage 32 (2006), pp. 1127–1133.
Lowe et al., 2008 M.J. Lowe, E.B. Beall, K.E. Sakaie, K.A. Koenig, L. Stone, R.A. Marrie and M.D. Phillips, Resting state sensorimotor functional connectivity in multiple sclerosis inversely correlates with transcallosal motor pathways transverse diffusivity, Hum. Brain Mapp. 29 (2008), pp. 818–827.
Maldjian et al., 1999 Maldjian, J.A., Gottschalk, A., Detre, J.A., Alsop, D., 1999. Basal ganglia and white matter activation using functional MRI at 4 tesla. In Proceedings of the 7th Annual Meeting of the International Society of Magnetic Resonance in Medicine, Philadelphia, USA. Mazerolle et al., 2008 E.L. Mazerolle, R.C.N. D'Arcy and S.D. Beyea, Detecting fMRI
activation in white matter: interhemispheric transfer across the corpus callosum, BMC Neurosci.
9 (2008), p. 84.
Mosier and Bereznaya, 2001 K. Mosier and I. Bereznaya, Parallel cortical networks for volitional control of swallowing in humans, Exp. Brain Res. 140 (2001), pp. 280–289. . Oldfield, 1971 R.C. Oldfield, The assessment and analysis of handedness: the Edinburgh inventory, Neuropsychologia 9 (1971), pp. 97–113.
Omura et al., 2004 K. Omura, T. Tsukamoto, Y. Kontani, Y. Ohgami, M. Minami and Y. Inoue, Different mechanisms involved in interhemispheric transfer of visuomotor information,
NeuroReport 15 (2004), pp. 2707–2711.
Park et al., 2008 H.-J. Park, J.J. Kim, S.-K. Lee, J.H. Seok, J. Chun, D.I. Kim and J.D. Lee, Corpus callosum connection mapping using cortical gray matter parcellation and DT-MRI, Hum.
Brain Mapp. 29 (2008), pp. 503–516.
Poffenberger, 1912 A.T. Poffenberger, Reaction time to retinal stimulation with special reference to the time lost in conduction through nervous centers, Arch. Psychol. 23 (1912), pp. 1–73.
Preibisch and Haase, 2001 C. Preibisch and A. Haase, Perfusion imaging using spin-labeling methods: contrast-to-noise comparison in functional MRI applications, Magn. Reson. Med. 46 (2001), pp. 172–182.
Rostrup et al., 2000 E. Rostrup, I. Law, M. Blinkenburg, H.B. Larsson, A.P. Born, S. Holm and O.B. Paulson, Regional differences in the CBF and BOLD responses to hypercapnia: a combined PET and fMRI study, NeuroImage 11 (2000), pp. 87–97.
Skudlarski et al., 2008 P. Skudlarski, K. Jagannathan, V.D. Calhoun, M. Hampson, B.A. Skudlarska and G. Pearlson, Measuring brain connectivity: diffusion tensor imaging validates resting state temporal correlations, NeuroImage 15 (2008), pp. 554–561.
Smith, 2002 S.M. Smith, Fast robust automated brain extraction, Hum. Brain Mapp. 17 (2002), pp. 143–155.
Smith et al., 2004 S.M. Smith, M. Jenkinson, M.W. Woolrich, C.F. Beckmann, T.E.J. Behrens, H. Johansen-Berg, P.R. Bannister, M. De Luca, I. Drobnjak, D.E. Flitney, R. Niazy, J. Saunders, J. Vickers, Y. Zhang, N. De Stefano, J.M. Brady and P.M. Matthews, Advances in functional and structural MR image analysis and implementation as FSL, NeuroImage 23 (S1) (2004), pp. 208– 219.
Tettamanti et al., 2002 M. Tettamanti, E. Paulesu, P. Scifo, A. Maravita, F. Fazio, D. Perani and C.A. Marzi, Interhemispheric transfer of visuomotor information in humans: fMRI evidence, J.
Neurophysiol. 88 (2002), pp. 1051–1058.
Weber et al., 2005 B. Weber, V. Treyer, N. Oberholzer, T. Jaermann, P. Boesiger, P. Brugger, M. Regard, A. Buck, S. Savazzi and C.A. Marzi, Attention and interhemispheric transfer: a behavioural and fMRI study, J. Cogn. Neurosci. 17 (2005), pp. 113–123.
Wedeen et al., 2008 V.J. Wedeen, R.P. Wang, J.D. Schmahmann, T. Benner, W.Y. Tseng, D.N. Pandya, P. Hagmann, H. D'Arceuil and A.J. de Crespigny, Diffusion spectrum magnetic
resonance imaging (DSI) tractography of crossing fibers, NeuroImage 15 (2008), pp. 1267–1277. Wise et al., 2004 R.G. Wise, K. Ide, M.J. Poulin and I. Tracey, Resting fluctuations in arterial carbon dioxide induce significant low frequency variations in BOLD signal, NeuroImage 21 (2004), pp. 1652–1664.
Woolrich et al., 2001 M.W. Woolrich, B.D. Ripley, M. Brady and S.M. Smith, Temporal autocorrelation in univariate linear modeling of FMRI data, NeuroImage 14 (2001), pp. 1370– 1386.
Worsley et al., 1992 K.J. Worsley, A.C. Evans, S. Marrett and P. Neelin, A three-dimensional statistical analysis for CBF activation studies in human brain, Cereb. Blood Flow Metab. 12 (1992), pp. 900–918.
Van der Zande et al., 2005 F.H. Van der Zande, P.A. Hofman and W.H. Backes, Mapping hypercapnia-induced cerebrovascular reactivity using BOLD MRI, Neuroradiology 47 (2005), pp. 114–120.
Yarkoni et al., 2009 T. Yarkoni, D.M. Barch, J.R. Gray, T.E. Conturo and T.S. Braver, BOLD correlates of trial-by-trial reaction time variability in gray and white matter : a multi-study fMRI analysis, PLoS One 4 (2009), p. e4257.
Zarei et al., 2006 M. Zarei, H. Johansen-Berg, S. Smith, O. Ciccarelli, A.J. Thompson and P.M. Matthews, Functional anatomy of interhemispheric cortical connections in the human brain, J.
Anat. 209 (2006), pp. 311–320.
Zeffiro et al., 2007 Zeffiro, T., Vasios, C., Belliveau, J., 2007. Neural mechanisms of visuomotor interhemispheric transfer: the Poffenberger paradigm. In Proceedings of the 13th Annual
Meeting of the Organization for Human Brain Mapping, Chicago, USA.
Zhang et al., 2001 Y. Zhang, M. Brady and S. Smith, Segmentation of brain MR images through a hidden Markov random field model and the expectation maximization algorithm, IEEE Trans.
Med. Imaging 20 (2001), pp. 45–57.
Appendix A.
Supplementary Fig. 1. FMRI-guided tractography results for subject 2 (green: left hemisphere gray matter activation ROI; yellow: right hemisphere gray matter activation ROI; red: corpus callosum activation ROI; black: tracts passing through all three ROIs; P: posterior; A: anterior; S: superior; I: inferior; R: right; L: left). The top images show fibres passing through corpus callosum activation in the sagittal view (left) and axial views (centre: mid-body activation; right: splenium activation; blue arrows). The bottom images show axial views of tracts reaching targets in premotor cortex (magenta arrows), parietal cortex (white arrows), and right inferior temporal cortex (black arrow).
Supplementary Fig. 2.
FMRI-guided tractography results for subject 3. The top images show fibres passing through corpus callosum activation in the sagittal view (left) and coronal views (centre: mid-body
activation; right: isthmus activation; blue arrows). The bottom images show axial views of tracts reaching targets in premotor cortex (magenta arrows), parietal cortex (white arrows), and left temporal cortex (black arrow). All other details as in Supplementary Fig. 1.
Supplementary Fig. 3.
FMRI-guided tractography results for subject 4. The top images show fibres passing through the corpus callosum activation in sagittal (left) and axial (right) views (blue arrows). The bottom image shows the tracts reaching targets in premotor cortex (axial view, magenta arrows). All other details as in Supplementary Fig. 1.
Supplementary Fig. 4.
FMRI-guided tractography results for subject 5. The top images show fibres passing through corpus callosum activation in the sagittal view (left) and axial views (centre: mid-body
activation; right: genu activation; blue arrows). The bottom image shows tracts reaching targets in premotor cortex (axial view, magenta arrows). This subject also had tracts to prefrontal regions (top centre; cyan arrows). All other details as in Supplementary Fig. 1.
Supplementary Fig. 5.
FMRI-guided tractography results for subject 6. The top images show fibres passing through lateral, posterior corpus callosum activation in sagittal (left) and axial (right) views (blue arrows). The bottom images show axial views of tracts reaching targets in superior
Supplementary Fig. 6.
FMRI-guided tractography results for subject 7. The top images show fibres passing through splenium activation in sagittal (left) and axial (right) views (blue arrows). The bottom images show axial views of tracts reaching targets in parietal cortex (white arrows) and medial temporal cortex (black arrows). All other details as in Supplementary Fig. 1.
Supplementary Fig. 7.
FMRI-guided tractography results for subject 8. No tracts were identified that reach gray matter activation ROIs in both hemispheres for this subject; instead, the gray matter activation is
represented by a single ROI (green). The top images show fibres passing through genu activation in sagittal (left) and axial (right) views (blue arrows). The bottom images show an axial view of tracts reaching targets in right prefrontal cortex (cyan arrow). All other details as in Fig. 2. All other details as in Supplementary Fig. 1.
Supplementary Table 1. Maximum motion parameters output from the motion correction procedure (FSL's MCFLIRT) for each subject.
1
1/T2 = 1/T2 + /T ’. 2
Summaries of the motion parameters are reported in Supplementary Table 1. 3
We used a six DOF registration for correcting motion in the diffusion data as opposed to the standard 12 DOF for correcting for eddy currents. Six DOF was appropriate because our acquisition employed a spiral k-space trajectory, which manifests eddy current artifacts as image blurring as opposed to stretching (as is typical for EPI acquisitions).
4
A ninth subject had an activation maximum on the border of the corpus callosum and lateral ventricle. However, we could not be confident that this activation originated from the corpus callosum because of potential peri-ventricle motion artifacts; therefore, this subject was excluded from the fMRI-guided tractography analysis.