HAL Id: hal-00845120
https://hal.archives-ouvertes.fr/hal-00845120v2
Submitted on 24 Jul 2013HAL is a multi-disciplinary open access archive for the deposit and dissemination of sci-entific research documents, whether they are pub-lished or not. The documents may come from teaching and research institutions in France or abroad, or from public or private research centers.
L’archive ouverte pluridisciplinaire HAL, est destinée au dépôt et à la diffusion de documents scientifiques de niveau recherche, publiés ou non, émanant des établissements d’enseignement et de recherche français ou étrangers, des laboratoires publics ou privés.
Identification of harmonics and sidebands in a finite set
of spectral components
Timothée Gerber, Nadine Martin, Corinne Mailhes
To cite this version:
Timothée Gerber, Nadine Martin, Corinne Mailhes. Identification of harmonics and sidebands in a finite set of spectral components. CM 2013 - MFPT 2013 - 10th International Conference on Condition Monitoring and Machinery Failure Prevention Technologies, Jun 2013, Krakow, Poland. �hal-00845120v2�
Identification of harmonics and sidebands in a finite set of spectral
components
Timothée Gerber and Nadine Martin GIPSA-lab
Grenoble Campus, 11 rue des Mathématiques, 38402 Saint Martin D’Hères, France +33 (0)4 76 82 63 13
[email protected], [email protected] Corinne Mailhes
IRIT-TéSA
Université de Toulouse, 2 rue Charles Camichel, 31071 Toulouse, France
Abstract
Spectral analysis along with the detection of harmonics and modulation sidebands are key elements in condition monitoring systems. Several spectral analysis tools are already able to detect spectral components present in a signal. The challenge is therefore to complete this spectral analysis with a method able to identify harmonic series and modulation sidebands. Compared to the state of the art, the method proposed takes the uncertainty of the frequency estimation into account. The identification is automatically done without any a priori, the search of harmonics is exhaustive and moreover the identification of all the modulation sidebands of each harmonic is done regardless of their energy level. The identified series are characterized by criteria which reflect their relevance and which allow the association of series in families, characteristic of a same physical process. This method is applied on real-world current and vibration data, more or less rich in their spectral content. The identification of sidebands is a strong indicator of failures in mechanical systems. The detection and tracking of these modulations from a very low energy level is an asset for earlier detection of the failure. The proposed method is validated by comparison with expert diagnosis in the concerned fields.
1. Introduction
System monitoring is a key element in a predictive maintenance strategy (1). Vibration analysis is one of the oldest and most used techniques. It consists in computing the spectral density of vibration signals, recorded at sensitive points of the system (e.g., the bearings or gearboxes). The presence of harmonic or modulation series is then used as indicators of wear or damage of one or more mechanical parts of the system (2).
Few studies have focused on the problem of identifying harmonics at the output of a spectral analysis: (3) presented a method based on correlation but does not take the uncertainty due to the estimation of the frequencies into account, while (4) proposed a method based on statistical tests with the a priori hypothesis that the power of an harmonic series is a decisive criterion. A method developed in (5) and applied to the diagnosis of helicopter engines associates the detected peaks to known peaks from an underlying model, thus inducing an a priori model.
2 The main idea of this paper is to automatically identify the harmonic series and sidebands taking the uncertainty in frequency estimation into account and without introducing any a priori on the signal. If the number of system parts to be monitored is large, the number of signals to be analysed becomes sizeable. Therefore, there is a need to automatically perform spectral analysis and after that the reading of the achieved spectra. Many spectral analysis tools are already able to detect all spectral components of an analysed signal. Each detected component is usually characterized by some parameters, depending on the tool used. In general, these parameters include at least the central frequency of the detected peak and the estimation error of the central frequency, estimation strongly related to the spectral resolution. Assuming the knowledge of these two parameters, we propose a method based on spectral interval intersections, in order to identify the harmonic and modulation series from a finite set of spectral components.
2. Context
The context of our work takes place at the output of a spectral analysis tool which provides a set S of spectral components. Within this set, each component Ci is
characterized by at least its central frequency νi, the uncertainty ∆νi directly linked to
the spectral resolution and its amplitude Ai
(
)
(
)
(
)
{
1 1 1 1 2 2 2 2}
, , , , , , , F F, ,F F ,
S = C ν ∆ν A C ν ∆ν A … C ν ∆ν A (1) where F is the total number of spectral components detected.
In the present paper, we use the automatic spectrum analyser AStrion (6)(7). Thanks to its method of detection and automatic identification of noise, AStrion detects only the relevant components (sinusoids or narrowband). Moreover, a method implemented in
AStrion allows the estimation of the central frequency of components with a better
precision than the spectral resolution (8).
The purpose of this study consists then in identifying the harmonic series and sidebands in the set S of detected spectral components.
3. Harmonic series and modulation sideband identification
After the definitions of a harmonic series and a harmonic family, a method is proposed to identify the harmonic series. The same method is then extended around the detected harmonics to identify the modulation sidebands.
3.1 Definition of a harmonic series and of a harmonic family
Mathematically, a harmonic series is characterized by a fundamental frequency νi and
defined as a set of spectral components of frequencies r×νi, r∈ representing the *
harmonic order.
Two series of fundamental frequencies νi and νj belong to the same family if their ratio
( )
* * such as i j ν p p,q = ν q ∃ ∈ × . (2)In this case, the family is defined by all the components of both series and is characterized by a fundamental frequency equal to ν0 = νj / p = νi / q, even if this
frequency is not detected and may be not present in the spectrum. This definition implies that if two harmonic series of fundamental frequency νi and νj have a harmonic
νk in common, then the two series are part of the same family. Otherwise, if νi and νj are
incommensurable, each series belongs to a distinct harmonic family. It is worth noting that a signal containing more than one harmonic family cannot be periodic.
From a system maintenance point of view, it is interesting to identify all the harmonic series since each one may be associated with a different part of the system. Grouping harmonic series in family is an additional indicator to identify interrelated components.
3.2 Harmonic series detection
Harmonic series identification from estimated components is a nontrivial problem because of estimation errors. In fact, estimation errors do not preserve the accuracy of the relation between an estimated frequency and its harmonics. So, in order to find the harmonic frequency of order r of an estimated frequency νi, looking for a detected
component at a frequency exactly equal to r × νi will not be sufficient.
In this paper, we propose to use the uncertainty ∆νi of each detected component to
bypass the drawbacks of the non-exact frequency estimation. Each estimated frequency
νi is thus represented by a confidence interval of width ∆νi centred on νi. The harmonic
detection is then completed by intersection of these intervals, as detailed in what follows.
A component Ci(νi, ∆νi, Ai) of S is the fundamental of a harmonic series, referred to as
Hi, if Cj(νj, ∆νj , Aj) ∈ S exists such that
2 2 2 2 j j i i j j j j i i ν ν ν ν a ;b =ν ∆ ;ν +∆ r ν ∆ ;r ν +∆ − ∩ − ≠ ∅ , (3)
with (aj, bj) ∈ R², aj ≠ bj, and r∈*−{ }1 . The harmonic order r increases sequentially,
starting at 2 and stopping when the end of the spectrum is reached. The search for harmonic components is then performed in a sequential manner (r=2,3,…) looking for the components Cj which are harmonics of Ci.
However, this can raise a problem of harmonic identification when several detected peaks satisfy (3), for the same order r. Fig. 1 presents the case of two components of frequencies νj and νj+1 satisfying (3), the component νi being considered as a potential
fundamental frequency. Therefore a criterion has to be added to (2) in order to identify the successive harmonics of a series. We propose to use a criterion of minimum distance to select νi(r) the harmonic of order r of the fundamental frequency νi.
4 For a given order of harmonics, νi(r) has to satisfy the following complete criterion
( ) ( ) 2 / min . j r i j j i satisfying r ν ν =ν ν − ×ν (4)
In the case of Fig. 1, based on this second criterion, the component with frequency νj is
chosen as the harmonic of order r.
Figure 1. Harmonic search based on interval intersection: νi is considered as a
potential fundamental of a given series and νj and νj+1 are two candidates for the
harmonic of order r. Based on the distance criterion, νj will finally be retained.
This method raises a second problem: the search interval for harmonics grows linearly with the harmonic order r. Considering a fundamental νi with its estimation error ∆νi,
the uncertainty of its r order harmonic frequency is equal to r.∆νi. As a consequence, for
high order harmonics the probability of getting multiple candidates and selecting a wrong one increases.
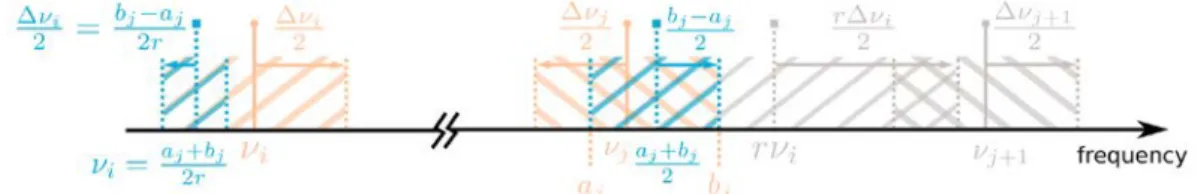
To prevent the search interval growing, each time a component is identified as a harmonic of Ci (satisfying (2) and (3)), the parameters νi and ∆νi are updated as
, 2 j j j j i i a + b b a ν = ν = r r − ∆ . (5)
This strategy is illustrated on Fig. 2. If r is the order of the last harmonic added in the series and no harmonics have been identified for the orders r+1, r+2, …, r+k, the search interval will not be updated and will continue to grow. To prevent the search interval to become large compare to spectral resolution, the search for harmonics in this series stops when no harmonics have been detected for k consecutive order. In our implementation, we choose k = 8.
Figure 2. Parameter updates: νi and ∆νi are updated to avoid the search interval
growing. In grey, the previous values of νi and ∆νi. Each time a harmonic is
In the proposed algorithm, the search of harmonic series is exhaustive. One by one, each detected spectral component is considered as a potential fundamental of a harmonic series. Further processing described in Section 3.5 has to be done to determine the final list of identified harmonic series.
Moreover, the fundamental frequency can be missing from a signal or it could have not been detected by the previous spectral analysis. To avoid the non-detection of the harmonic series because of the non-presence of the fundamental, we create an artificial component Ĉi for each real component Ci in S with frequency ˆν νi = i/ 2 and uncertainty
ˆi i/ 2
ν ν
∆ = ∆ . If the series detected from Ĉi and Ci are identical, we merge them and
consider only the component Ci as a fundamental of a harmonic series.
3.4 Modulation sideband detection
Sidebands are usually the result of an amplitude or frequency modulation process. In the spectrum, they take the form of spectral components equally spaced on both sides of the carrier frequency, symmetrically.
For computational time reason, each component of the spectrum is not considered as a potential carrier frequency. The search for sidebands is only made around the components belonging to the harmonic series Hi previously identified.
Assuming that νi is the fundamental frequency of the harmonic series Hi, for each
component Cj of order r in Hi, the search for modulation series is made in 3 steps,
illustrated in Fig. 3:
A - First, we look for sidebands above Cj, in the search interval [νj ; νj + νi] = [r νi ; (r+1)
νi]. To proceed, we identify all the harmonic series
M
k Cj+present in this interval, considering Cj as the new frequency reference, k representing the series index. In the
example of Fig. 3, two series are identified, in orange (with fundamental ν0) and purple
(with fundamental ν1).
B - Then, the same process is applied below Cj, in the search interval [νj - νi ; νj] = [(r –
1) νi ; r νi] to identify the harmonic series
M
kCj-. In the example of FigCj-. 3, two series are extracted from the set of detected frequencies, in red (same fundamental ν0) and in
green (with fundamental ν2).
C - Finally, we compare the fundamental frequencies from the
M
k Cj+series to the fundamental frequencies from
M
k
Cj-. If two series have the same fundamental frequency (with a possible error of maximum ∆νi), both series are merged and are now considered
as a modulation series. Thus, in the example of Fig. 3, the modulation series of fundamental ν0 is selected as a symmetrical series around frequency νj = r νj and two
6
Figure 3. Modulation sidebands detection: (A) Two harmonic series (in orange and
in purple) identified above the carrier frequency rνi. (B) Two harmonic series (in
red and in green) identified below the carrier frequency. (C) Search for symmetry and fusion: one modulation series (in orange) finally detected.
A modulation series is not always symmetric. There can be more components above the carrier frequency than below, and vice versa. The proposed method allows the identification of such non-exactly symmetric sidebands. An example is given in Fig. 4.C with 3 sidebands below the carrier frequency, and only 2 sidebands above.
3.5 Characterisation criteria
The proposed method is exhaustive and identifies every harmonic and modulation series present in the spectrum. As a consequence, the number of series detected is large and some of them are not always relevant. Nevertheless, in the literature, there is no precise definition of a harmonic series (apart from a mathematical point of view). Moreover, the relevancy of a series depends on the application and the physical context of the studied signals. That is the reason why keeping all the series detected is necessary. Rather than eliminating the “false” series, the proposed method classifies the detected series thanks to the following three characterisation criteria.
These criteria have been chosen as a comparison of each detected series to the corresponding “perfect” one. A “perfect” series is defined as a spectral comb going till the end of the spectrum with no harmonic missing.
The first criterion denoted Di, highlights the density of the series, in order to
differentiate series with several harmonics missing from series with almost all harmonics present
( )
card i i max i H D = r , (6)with rimax the rank of the last harmonic in the series Hi.
A series in which lots of harmonics are missing will have a small density whereas a “full” series including all harmonic orders will have a density equal to one.
The second criterion is based on Nimax which is the maximum size of the series based on
the frequency of its fundamental νi and of the highest frequency νF in the set S. This has
to be compared to rimax to define the second criterion, the richness Ri of the series
max max i F i max i i i r ν R = with N = N ν , (7)
with providing the integer part. This will help to consider in a different way two series with the same cardinal and the same harmonics orders. For example a series of fundamental frequency νi = 510 Hz including only harmonics of orders 2 and 3 for a
signal in which the maximum detected frequency is νF = 2000 Hz carries more weight
than a series including also the same harmonic orders but with a fundamental frequency
νj = 23 Hz. The first series will have a criterion equal to 1, which is the maximum
possible whereas the second series will only get a 0.035, which is a very low value. Classically used, the third criterion is the Total Harmonic Distortion THDi(9)
2 2 1 2 2 0 2 ... 1 Ni i A + A + A THD = A − . ... (7)
This criterion will be helpful in applications where amplitude behaviour in harmonic series is known a priori and awaited.
For modulation sidebands, these criteria are computed on the series below and above the carrier frequency.
The combination of the following criteria allows classifying the harmonic series and modulation sidebands by relevancy. In addition, the series are grouped in family as defined.
8
4. Results
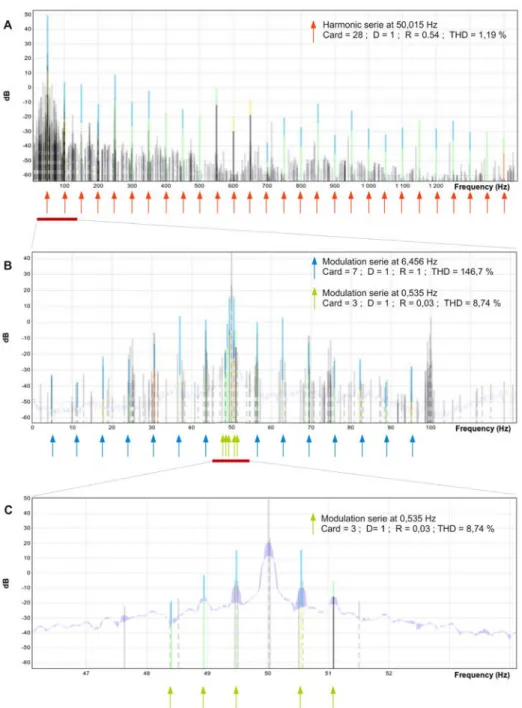
The method has been tested on synthetic and real-world signals. The results for a current signal of a fan are shown in Fig. 4, below the spectral analysis result, as a schematic representation of the detected series. The method identifies a series of 28 consecutive harmonics at the fundamental frequency 50.015 Hz and two modulation sidebands series around this carrier frequency with cardinal 3 and 7 and their respective frequencies 0.535 Hz and 6.456 Hz. All the detected series have high density, that is to say D = 1. Harmonic series near the fundamental 50 Hz was expected. Its THD is very low (1.19 %) and is under the maximum 2 % guaranteed by the energy supplier.
Figure 4. Series identification on the spectral component set from the current signal of a fan: (A) The 50 Hz harmonic series (B) A zoom on the two modulation
The presence of two series of sidebands is characteristic of two defects on the fan, identified by an expert in maintenance. The series of fundamental frequency 0.535 Hz is generated by a misalignment of the belt. Its richness is very low (R = 0.03), but its density is maximal (D = 1) and the THD is high (8.74 %). The second modulation series with fundamental frequency 6.456 Hz, is due to a broken shaft. Its criteria are very high: maximal density D = 1, maximal richness R = 1 and a very high TDH = 146 %. These two series of modulation are also present around the harmonics of 50 Hz, i.e. around 100 Hz, 150 Hz, 200 Hz, etc.
5. Conclusions
The method proposed in this article identifies harmonic series and modulation sidebands in a finite set of spectral components, and without any a priori on these series. On vibration signals, rich in spectral components, even the low-energy harmonic series are identified. The identification of modulation sidebands around these harmonics is an excellent indicator for the early detection of faults in condition monitoring systems.
References
1. P F G Marquez et al, ‘Condition monitoring of wind turbines: Techniques and methods’, Renewable Energy 46 (2012), p. 169–178.
2. A Boulenger et C Pachaud, ‘Analyse vibratoire en maintenance : surveillance et diagnostic des machines’, Dunod, 2003.
3. B Redortier et B Laget, ‘Détection des harmoniques dans un spectre de vibrations par des méthodes de traitement d’images’, TS (1989).
4. M Zeytinoglu et K M Wong, ‘Detection of harmonic sets’, IEEE Transactions on Signal Processing 43.11 (1995), p. 2618–2630.
5. L M Gelman et al, ‘Condition Monitoring Diagnosis Methods of Helicopter Units’, Mechanical Systems and Signal Processing 14.4 (juil. 2000).
6. N Martin et al, ‘Vers une carte d’identité spectrale’, GRETSI, 2005.
7. C Mailhes et al, ‘A spectral identity card’, EUropean SIgnal Processing COnference (EUSIPCO), 2006, p. 6–10.
8. M Durnerin, ‘Une stratégie pour l’interprétation en analyse spectrale. Détection et caractérisation des composantes d’un spectre’, Thèse INPG. 1999, Url: http://tel.archives-ouvertes.fr/tel-00789941.
9. G. R. Slone, ‘The audiophile's project sourcebook’, McGraw-Hill/TAB Electronics (2001), p. 10, ISBN 0-07-137929-0.