Assessing Environmental Benefits and Economic
Costs of Aviation Environmental Policy Measures
by
Anuja Mahashabde
B.S. Rutgers University, 2004
S.M. Massachusetts Institute of Technology, 2006
Submitted to the Department of Aeronautics and Astronautics
in partial fulfillment of the requirements for the degree of
Doctor of Philosophy in Aeronautics and Astronautics
at the
MASSACHUSETTS INSTITUTE OF TECHNOLOGY
September 2009
©
Massachusetts Institute of Technology 2009.
ASSACHUsETTS INSTITUTE OF TEH(> L
OCT
18
2
ARCHNES
All rights reserved.
A uthor
...
-. . ...Department of Aeronautics and Astronautics
I
/
4i
\
jAj~gwust
20, 2009
C ertified by ...
...
C7
Ian A. Waitz
Department Head and Professor of Aeronautics and Astronautics
C ertified by ...
Thesis Supervisor
H
....
Henry D.
acoby
Professor of Management, Woan School of Management
Certified by...
Karer
E.
Willcox
Associate Professor, Depart
of Acranfubics aid Atronautics
Accepted by ...
Dd
l L. Darmofal
Associate Department Head
Chair, Committee on Graduate Students
Assessing Environmental Benefits and Economic Costs of
Aviation Environmental Policy Measures
by
Anuja Mahashabde
Submitted to the Department of Aeronautics and Astronautics on August 20, 2009, in partial fulfillment of the
requirements for the degree of
Doctor of Philosophy in Aeronautics and Astronautics
Abstract
Despite the recent global economic downturn, longer term growth is anticipated for aviation with an increasing environmental impact, specifically in the areas of noise, air quality, and climate change. To ensure sustainable growth for aviation, decision-makers and stake-holders need to be armed with information on balancing environ-mental and economic interests. The main objective of this thesis is to address key shortcomings in current decision-making practices for aviation environmental poli-cies. This work demonstrates how the inclusion of environmental impact assessment and quantification of modeling uncertainties can enable a more comprehensive evalu-ation of avievalu-ation environmental policy measures. A comparison is presented between the conventional cost-effectiveness analysis and an illustrative cost-benefit analysis focused on assessing a subset of the engine NO, emissions certification stringency op-tions under consideration for the upcoming eighth meeting of the International Civil Aviation Organization's Committee on Aviation Environmental Protection.
The Aviation environmental Portfolio Management Tool (APMT) is employed to conduct the aforementioned policy assessments. Monte Carlo methods are adopted to explicitly quantify uncertainties in the modeling process. To enable the aviation climate impact assessment required by the policy analysis, a separate component of this work focuses on advancing the climate impact modeling capabilities within APMT. Major contributions towards assessing aviation climate impacts in APMT include: improved characterization of uncertainty for NO1-related effects and for
aviation climate damages, introduction of a reduced-order methodology for assessing climate impacts of methane emissions from the processing of alternative jet fuels, and comparison and validation of APMT results with external sources.
This work also discusses the importance of uncertainty assessment for understand-ing the sensitivity of policy analysis outcomes to input and model parameter vari-ability and identifying areas of future work. An uncertainty analysis for the APMT Climate Module is presented. Radiative forcing from short-lived effects, climate sen-sitivity, damage function, and discount rate are identified to be the model parameters with the greatest contribution to output variability for the Climate Module for any
given aviation scenario. Key contributors to uncertainty in the difference between pol-icy and baseline scenarios are determined by the nature of the polpol-icy. For the NO, stringency analysis, the NO. radiative forcing and associated efficacies are significant contributors to uncertainty in analysis outcomes. Information based on model uncer-tainty assessment is also used for distilling and communicating key analysis results to the relevant stake-holders and policy-makers through the development of the lens con-cept. The lens, defined as a combination of inputs and model parameters representing a particular perspective for conducting policy analysis, is applied in conducting the engine NO, stringency policy assessment.
Thesis Supervisor: Ian A. Waitz
Acknowledgments
The successful completion of this thesis is grounded in the support, guidance, and encouragement of many people both on the professional and personal fronts. First and foremost, I would like to express my sincere gratitude to my advisor, Prof. Ian Waitz; I have learned so much from him. He has been a great mentor over the past several years fostering my professional growth by encouraging me to shoulder increasing responsibility and always believing in my abilities. I also wish to thank Prof. Waitz for giving me the opportunity to experience first-hand how our work is received in the broader community. I would like to thank my committee members, Prof. Karen Willcox and Prof. Henry Jacoby for their guidance and critical evaluation of my work and my thesis readers Dr. Lourdes Maurice and Prof. Mort Webster for their valuable insights and recommendations.
Next, I want to acknowledge project team members I worked closely with from other organizations - Gregg Fleming and Sathya Balasubramanian from the Volpe Transportation Center, Richard Hancox and Caroline Sinclair from MVA consultancy, and Fabio Grandi from Wyle Labs. The CAEP analysis work presented in this thesis required constant coordination with the extended team and I wish to thank them for their help and for responding promptly to all my questions and requests. I would also like to thank Maryalice Locke who is the FAA project manager for APMT for her support and guidance.
Through this research, I have enjoyed working closely with many MIT colleagues.
I would like to thank Karen Marais and Mina Jun for helping me learn about aviation
climate impact modeling and have fun while doing that! Julien Rojo made sure that
I did not fall asleep at my desk and introduced me to the world of AQ. Chris Kish
helped me learn about noise impacts and I respect him for having survived GIS. Thank you Jianye Zhang and Chris Sequeira for being great lunch buddies and making the lab a fun place. I would like to thank Andrew March for dropping by every so often to make sure that I retained my sanity till the very end. Doug Allaire has not only been the assessment expert, but also a good venting companion, be it the quals or
the defense. Rhea Liem, Pearl Donohoo, Alice Fan, and Elza Brunelle-Yeung have been my lab support group, cheering me on always. I have had some very memorable times with you ranging from international travel, eccentric office decorations, and daily horoscopes to just fun dinners, shopping trips, and movies! I will miss you all lots.
I would like to thank Stephen Lukachko for many interesting and stimulating
conversations on a multitude of topics and his help with the climate work. Jim Hileman and Tom Reynolds have always given me excellent technical and career advice and I wish to thank them for their help and guidance on numerous occasions. It has been a pleasure working with the rest of the MIT-PARTNER team and I would like to thank Chris Dorbian, Stephen Kuhn, Chelsea He, Russ Stratton, Phil Wolfe, and Christoph Wollersheim for all the good times we have shared.
Several other individuals at MIT have been incredibly supportive and have ensured a smooth and enjoyable graduate experience for me. Thank you Robin Palazzolo, Sue Whitehead, Jennie Leith, Marie Stuppard, and Barbara Lechner for taking such good care of us students!
On the personal front, I have found deep and enriching friendships while at MIT that have shaped my entire graduate experience. These relationships have carried me through the tough times and taught me so much. I leave here with many fond memories and I will always cherish the time we spent together. Cecilia, I had to go quite an extreme to get you to be my friend, but that White Mountains experience was absolutely worth it! Thank you for being there for me through it all. I have really enjoyed all our travels together and look forward to many more. Tzu-Ching, while you've been away for a while now, you have been a constant presence in my life, thank you for being such a great friend. Mridula and Liang, I did not have a chance to see you both as often as I would have liked to in recent times, but I will never forget our old Tang days and your help especially during the quals, thank you so much. Hui, my parents still tell me that they were so happy when they saw that I would be staying with you in our first year. Thank you for taking such good care of
Anna has been my happiness fix, always there with her big smile! I cannot imagine having survived the past year without you, thank you so much for putting up with me, and for all those crazy conversations about anything and everything. Aruna, I don't think I will be able to enjoy a cup of tea or aloo paratha with the same excitement with anyone else; thank you for being such a great roommate! Krupa, I am so glad that we became such good friends over the past couple years, thank you for all the great times we have had together! Arvind, Karthik, and Murali, I have really enjoying hanging out with you all (not in the Murali sense), I just wish I had met you much earlier on.
Ganesh, I am very lucky to have you in my life. Thank you for being so kind, caring, and patient through good times and bad.
Finally, I would like to dedicate this work to my parents and my sister. Mom, and Dad, thank you for being my source of strength and support. None of this would have been possible without your love, encouragement, and blessings. Guddu, thank you for listening, caring, and always being there for me.
Contents
Acknowledgements 5 1 Introduction 17 1.1 Background... . . . . . . . . . . . . ... 17 1.2 Thesis Organization... . . . . . . . 20 1.3 Key Contributions... . . . . . . . . . . ... 222 Aviation Environmental Impacts and Current Decision-making Prac-tices 23 2.1 Aviation Environmental Impacts: an Overview . . . . 24
2.1.1 Noise Im pacts . . . . 24
2.1.2 Air Quality Impacts . . . . 26
2.1.3 Clim ate Impacts . . . . 30
2.2 Current Decision-making Practices for Aviation Environmental Policies 33 2.2.1 Common Approaches for Economic Policy Analysis . . . . 33
2.2.2 ICAO-CAEP Environmental Policy Analysis . . . . 34
3 Methods for Assessing Tradeoffs between Aviation Environmental and Economic Impacts 41 3.1 APMT-Impacts... . . . . . . . . . . . . . ... 44
3.1.1 APMT-Impacts: Noise Module . . . . 45
3.1.2 APMT-Impacts: Air Quality Module . . . . 46
4 Aviation and Climate Change
4.1 Overview of Aviation Climate Impact Modeling Methods
A 1 1 Ph) I l I ±. 1.1 4.1.2 4.2 APMT 4.2.1 4.2.2 4.2.3 4.2.4 4.2.5 4.2.6 4.2.7
5 Uncertainty Assessment and Communication of Results
5.1 Methods for Conducting Uncertainty Analysis... . . . . . ..
5.2 Uncertainty Analysis for the APMT-Impacts Climate Module . . . . 5.2.1 Global Sensitivity Analysis... . . .. 5.2.2 Local Sensitivity Analysis... . . ..
5.3 Communication of Results. ... . ..
5.3.1 Decision-making Framework - Lens... . . . . . . .. 5.3.2 Timescales... . . . . . . ..
6 NOx Stringency Policy Analysis
6.1 CAEP/8 NOx Stringency Options . . . . 89 91 95 95 97 100 101 106 109 111 Jys a m cts . . . . . . . . . . . . . . . . . . . . Monetary Impacts . . . . -Impacts: Clim ate . . . .
Radiative Forcing . . ...
4.2.1.1 CO2 Impacts . . . . 4.2.1.2 Other Short-lived Effects ...
4.2.1.3 NO, Impacts . . . .
4.2.1.4 CH4 Impacts from Well-to-tank Emissions .
Surface Temperature Change . . . .
Valuation. . ...
Characterization of Uncertainties... . . . . ..
Validation of Results. ...
4.2.5.1 Comparison with the IPCC MAGICC Model
4.2.5.2 Global Warming Potentials for NO2 . . . .
4.2.5.3 Comparison with Other Damage Functions . Limitations . . . ...
6.1.1 6.1.2
NO, Stringency Scenarios . . . . FESG Fleet and Traffic Forecast .
6.1.3 Noise and Emissions Modeling . . . . . . . . ..
6.1.4 Technology Response... . . ..
6.1.5 Costs of Stringency Options... . . . . . . . ..
6.2 APMT Modeling Assumptions... . . . . ..
6.2.1 APMT-Economics... . . . . . . . .. 6.2.2 APMT-Impacts... . . . . . . .. 6.3 AEDT Noise and Emission Inputs . . . .
6.4 R esults . . . .
6.4.1 APMT-Impacts Baseline Results... . . . ..
6.4.2 Cost-Benefit Analysis... . . . . . . ..
6.4.2.1 Lens Analysis . . . .
6.4.3 Cost-Effectiveness Analysis... . . . . . . ..
6.5 Key Policy Insights . . . .
7 Conclusions and Future Work
7.1 Summary and Conclusions... . . . . . . ..
7.2 Future Work... . . . . . . . . . . . . . .. 113 114 115 117 118 120 121 122 124 128 128 131 134 139 141 145 145 149
A The FAA-NASA-Transport Canada Aviation Environmental Tool
Suite 153
A.1 Aviation Environmental Design Tool... . . . . . . . . ... 154
List of Figures
2-1 Aircraft noise effects on residential areas . . . . 25
2-2 Aviation contribution to changes in annual PM2.5 . . . .. . 29
2-3 Radiative forcing from aircraft emissions in 2005 . . . . 33
2-4 CAEP/6 FESG economic analysis . . . . 37
2-5 Perspectives on uncertainty... . . . . . . . . ... 38
3-1 The FAA-NASA-Transport Canada Aviation Environmental Tool Suite 43 3-2 Overview of environmental impacts modeled in APMT... ... 44
4-1 Aviation climate change impacts pathway . . . . 52
4-2 APMT-Impacts Climate Module. . . . . . . . 61
4-3 APMT-Impacts Climate Module radiative forcing... . . . . ... 63
4-4 Comparison of CO2 results from APMT and MAGICC... ... 78
4-5 Comparison of CH4 results from APMT and MAGICC.. . . ... 78
4-6 Comparison of CH4 results from APMT and MAGICC with similar assum ptions... . . . . . . ... 80
4-7 Damage estimates from the literature... . . . . . . . 82
4-8 DICE-2007 implementation in APMT... . . . . ... 83
4-9 Global distribution of aviation 03 and contrails radiative forcing . . . 85
5-1 Paired sampling for Monte Carlo analysis . . . . 93
52 Global sensitivity analysis for the APMTImpacts Climate Module -total sensitivity indices for key model parameters . . . . 98
5-4 Mid-range lens. . ... . . . .. 104
5-5 Timescales in policy analysis . . . . 106
6-1 ICAO-CAEP NO, stringency standards... . . .. 110
6-2 AEDT noise inputs for the NO, stringency analysis . . . . 125
6-3 AEDT baseline air quality inputs for the NO, stringency analysis . . 126
6-4 AEDT policy air quality inputs for the NO. stringency analysis summed over 30 years... . . . .. 126
6-5 AEDT baseline climate inputs for the NO. stringency analysis . . . . 127
6-6 AEDT policy climate inputs for the NO. stringency analysis summed over 30 years. . ... . . . . .. 128
6-7 NO. stringency - baseline yearly noise physical impacts... . . .. 129
6-8 NO. stringency baseline yearly air quality physical impacts . . . . . 130
6-9 NO, stringency - baseline yearly climate physical impacts . . . . 131
6-10 NO, stringency Scenario 10 minus Baseline impacts, mid-range lens assumptions... . . . . .. 133
6-11 NO, stringency Scenario 10 minus Baseline impacts, low lens assumptions 135 6-12 NO, stringency Scenario 10 minus Baseline impacts, high lens assump-tion s . . . . 136
6-13 NO. stringency Scenario 10 minus Baseline impacts, mid-range lens with conservative upper bound assumptions for air quality and climate im pacts ... .. .... . .. .. .. . . . .. . . . .. . . .. . . . . 137
List of Tables
4.1 Simple climate models . . . . 55
4.2 Aviation short-lived effects radiative forcing and efficacies . . . . 65
4.3 Aviation NO, radiative forcing... . . . ... 68
4.4 APMT-Impacts Climate Module inputs . . . . 76
4.5 APMT-Impacts Climate Module parameters . . . ... 77
4.6 Aviation NO, Global Warming Potentials . . . . 80
5.1 Global sensitivity analysis for the APMTImpacts Climate Module -total sensitivity indices for model parameters with probability distri-butions . . . . 96
5.2 Local sensitivity analysis nominal model parameters.... . . ... 99
5.3 APMT lens inputs and model parameters.... . . . . . . . . 105
6.1 CAEP/8 NO, stringency scenarios . . . . 114
6.2 Costs of CAEP/8 NO, stringency options... . . . ... 119
6.3 APMT-Economics CAEP/8 NO, stringency assumptions . . . . 122
6.4 APMT-Impacts Noise assumptions for the CAEP/8 NO- stringency analysis. . ... . . . ... 123
6.5 APMT-Impacts Air Quality assumptions for the CAEP/8 NO, strin-gency analysis... . . . . . . . ... 124
6.6 APMT-Impacts Climate assumptions for the CAEP/8 NO, stringency analysis.... . . . . . . . . 124
6.7 APMT-Impacts results for the CAEP/8 NO, stringency analysis . . . 138 6.8 APMT-Economics results for the CAEP/8 NO, stringency analysis . 139
6.9 APMT cost-benefit results for the CAEP/8 NO. stringency analysis . 139 6.10 APMT cost-effectiveness results for the CAEP/8 NO, stringency analysis140
Chapter 1
Introduction
1.1
Background
Environmental impacts of aviation have become increasingly important over the last
50 years with the rapid growth of commercial jet aviation. Aircraft noise, with the
most distinctly perceived community impact, was the first area to be regulated in the 1960s by the International Civil Aviation Organization (ICAO). ICAO published the Annex 16: Environmental Protection, Volume I - International Noise Standards in
1971 which has subsequently been updated for newer technology aircraft [1].
Emis-sions standards were next to follow with the implementation of ICAO Standards and Recommended Practices for aircraft emissions in the 1980s to improve air quality in the vicinity of airports. ICAO emissions standards are summarized in the Annex 16: Environmental Protection, Volume II - Aircraft Engine Emissions [2] for nitrogen oxides (NO,), hydrocarbons (HC), carbon monoxide (CO) and smoke.
In response to growing concerns about aviation's impact on climate change, the
ICAO recently established the Group on International Aviation and Climate Change,
which is responsible for providing policy guidance to the ICAO for addressing inter-national commercial aviation's climate change impacts [3]. The United States Federal Aviation Administration (FAA) has recently developed the Aviation Climate Change Research Initiative with participation from the National Aeronautics and Space Ad-ministration (NASA), the National Oceanic and Atmospheric AdAd-ministration and
the United States Environmental Protection Agency (US EPA) with the aim of pro-moting aviation-related climate change research to support decision-making [4]. The European Commission has issued a directive that requires the inclusion of aviation in the EU emissions trading system as a part of a post-Kyoto agreement for the next commitment period starting in 2012 [5]. This new directive targets all flights arriving to and departing from airports located in EU Member States with some exceptions. The European Commission has published a list of expected participating aircraft op-erators along with guidelines for monitoring and reporting fuel usage, CO2 emissions, and distance flown in a given year with reporting set to begin in 2010 [6, 7]. Within the United States, the EPA has published an advance notice of proposed rule-making inviting public comments on the implications of regulating greenhouse gases under the Clean Air Act which also includes mobile sources [8]. The US EPA has also pro-posed a rule requiring mandatory reporting of greenhouse gas emissions from large sources including aircraft engines to collect data for informing future policy decisions with reporting to begin in 2011 [9].
While the IPCC cites a projected growth rate of about 5% [10] for aviation over the next 20-25 years, the recent global economic downturn is expected to dampen growth in the near future [11]. However, given that longer term growth is antici-pated for aviation as the world economy rebounds and continues to grow [11], what are the appropriate measures to ensure that this growth balances both economic and environmental interests? Which aircraft and engine technologies, air traffic manage-ment strategies, and governmanage-ment policies should be employed to satisfy the growing demand, while, at the same time, reducing significant environmental impacts in abso-lute terms? Answering these questions requires understanding the trade-offs among technologies, operations, policies, market conditions, manufacturer and airline eco-nomics, and environmental impacts including noise, air quality, and climate change.
Conventionally, the Committee on Aviation Environmental Protection (CAEP) within ICAO has addressed aircraft noise and emissions impacts independently of each other through measures such as engine NO, emissions certification standards or aircraft noise certification standards. Regulatory decisions have been based on
cost-effectiveness measures where reductions in aircraft noise or emissions are weighed relative to the expected implementation costs of a proposed policy. There has been no explicit estimation of the environmental benefits of proposed measures and un-certainties involved in regulatory analysis have been treated in a limited manner. The shortcomings of current decision-making practices have been recognized both within and beyond the ICAO-CAEP. The seventh meeting of ICAO-CAEP held in
2007 recognized the necessity for comprehensive analyses that assess the tradeoffs
be-tween noise and emissions impacts and economic costs to better inform policymaking decisions [12]. Policymakers need to be armed with information on balancing envi-ronmental and economic interests to better evaluate proposed envienvi-ronmental policy measures for aviation. Developing tools and metrics to assess and communicate avia-tion's environmental impacts is also one of the recommendations made in the Report to the U.S. Congress on aviation and the environment [13].
The main objective of this thesis is to address shortcomings in current decision-making practices and illustrate how the inclusion of environmental impact assessment can lead to different conclusions about selected environmental policy options for avi-ation. This work demonstrates interdependencies among the different environmental impacts of aviation and tradeoffs between environmental and economic performance through an assessment of some of the engine NO, emissions certification stringency options under consideration for the upcoming eighth meeting of the ICAO-CAEP.
The Aviation environmental Portfolio Management Tool (APMT) which is a com-ponent of the aviation environmental tool suite being developed by the Federal Avi-ation AdministrAvi-ation's Office of Environment and Energy (FAA-AEE) has been em-ployed to analyze the selected policy measures. To facilitate the climate impact assessment required by the aforementioned policy analysis, a separate component of the research effort contributes to advancing the aviation climate impact modeling capabilities within APMT. APMT Climate Module enhancements include improved characterization of uncertainties in aircraft NO-related impacts and uncertainties in estimating societal damages from climate change, a reduced-order methodology for estimating the climate impacts of the well-to-tank methane(CH4) emissions from
processing alternative jet fuels and comparison and validation of results with external sources. In addition to providing environmental and economic impact estimates, this work also quantifies uncertainties throughout the policy analysis process and explores the sensitivity of results to variability in model inputs and parameters. Finally, is-sues in communicating key results from a comprehensive policy analysis given various sources of uncertainty are also discussed.
1.2
Thesis Organization
This section provides a brief description of the organization and structure of the different chapters of the thesis. There are seven chapters; the contents of each chapter are outlined below.
Chapter 2:
Chapter 2 provides the motivation for this thesis work through a discussion of the key environmental impacts of commercial aviation and by highlighting the shortcom-ings in current decision-making practices. First, an overview of the different health and welfare impacts of aircraft noise and emissions is presented. Next, the chapter reviews recommended practices for economic analysis of environmental regulations and describes current practices within ICAO-CAEP for aviation-specific environmen-tal policies. Finally, the analysis developed by ICAO-CAEP to support consideration of increased engine NO, emissions certification stringency at the sixth meeting of the
CAEP is discussed to identify important shortcomings in current practices.
Chapter 3:
Chapter 3 discusses estimation methods for aviation environmental impacts em-ployed within APMT. This chapter also provides a brief overview of the aviation environmental tool suite being developed by the FAA-AEE in collaboration with the National Aeronautics and Space Administration and Transport Canada.
Chapter 4:
A literature review of the climate change impacts of commercial aviation is
pre-sented in Chapter 4 along with a discussion of the key issues in modeling physical and monetized climate impacts. Chapter 4 also highlights the contributions of this thesis in expanding the capabilities of the APMT Climate Module. More specifically, this chapter discusses the modified NO, and damage function uncertainty characteri-zation, the simplified modeling methodology adopted in APMT for assessing climate impacts of well-to-tank methane emissions and validation of APMT results with ex-ternal sources.
Chapter 5:
Chapter 5 discusses the role of model assessment and quantification of uncertain-ties in policy analysis, and highlights the issues concerning the communication of results from such a set of analysis. An uncertainty analysis of the APMT-Impacts Climate Module that ranks inputs and model parameters based on their contributions to output variability is presented in this chapter. Chapter 5 also introduces the anal-ysis framework designated as the lens concept for selecting a particular combination of input and model parameters for assessing proposed policy measures.
Chapter 6:
Chapter 6 is focused on the ICAO-CAEP engine NO, emissions stringency analysis with a comparison between the baseline - unregulated case and two policy scenarios. This chapter provides results that demonstrate improvements in the decision-making process in the aviation context when using the cost-benefit approach to assess the proposed policy measures as compared to the cost-effectiveness approach.
Chapter 7:
Finally, Chapter 7 provides a summary and key conclusions from the work de-scribed in this thesis.
1.3
Key Contributions
This research effort is one component of a large-scale initiative by the FAA-AEE for developing an integrated assessment capability to estimate the environmental impacts of aviation. Listed below are the contributions of this thesis work in the area of aviation-related environmental impacts and policy assessment.
" An assessment of selected aviation environmental policy measures that demon-strates an improvement in the current decision-making process by incorporating more information about both economic and environmental impacts of the pol-icy and associated uncertainties as compared to a conventional cost-effectiveness approach. The policy analysis presented in this thesis evaluates the economic costs and environmental benefits of a subset of the engine NO, emissions certifi-cation stringency options under consideration for the next ICAO-CAEP meeting to be held in 2010.
" Development of climate modeling capabilities within APMT to enable the afore-mentioned and anticipated policy assessments:
- Improved characterization of uncertainty associated with climate effects of aircraft NO, emissions
- Improved characterization of uncertainty for estimating societal damages attributed to aviation-related climate change
- Incorporation of a simplified methodology for assessing impacts of well-to-tank methane emissions from the processing of alternative jet fuels
- Comparison and validation of APMT results with external sources such as the Model for the Assessment of Greenhouse-Gas Induced Climate Change
Chapter 2
Aviation Environmental Impacts
and Current Decision-making
Practices
This chapter serves as the motivation for the remainder of the thesis by summarizing key environmental impacts of aircraft activity and illustrating the shortcomings in current approaches for evaluating proposed aviation environmental policies. First, an overview of the environmental and health impacts attributed to aviation in the areas of community noise, air quality, and climate change is provided. Water quality impacts associated with airport storm-water runoff are not addressed here. Methods for estimating aviation noise and air quality impacts in both physical and monetary metrics are discussed in Chapter 3. Climate impacts of aviation are discussed in de-tail in Chapter 4. Second, this chapter reviews common approaches for conducting economic analysis to better inform regulatory decisions. The economic analysis devel-oped by ICAO-CAEP for engine NO, emissions certification standards for the sixth meeting of the CAEP is discussed as an example of common practices for aviation environmental policies.
2.1
Aviation Environmental Impacts: an Overview
2.1.1
Noise Impacts
Being an easily perceived direct impact of aviation activity, aviation noise is the most significant objection of local communities to airport expansion projects [13]. While there are multiple noise sources at airports, this discussion is limited to aircraft-related noise. This section presents commonly-used noise scales and metrics first, followed
by a discussion of noise impacts. Noise is measured in decibels and is typically
scaled to reflect the sensitivity of human perception to different frequencies. Two widely-used frequency-weighted scales are the A-weighted scale and the tone-corrected perceived noise level. The A-weighted scale weights different frequencies with respect to the frequency sensitivity of the human ear and is the preferred scale for noise impact assessments and the generation of noise exposure area maps or contours. Tone-corrected perceived noise levels account for human perception of pure tones and other spectral irregularities and are used in aircraft design and ICAO noise certification standards [14].
Aircraft noise metrics are classified as either single-event or cumulative metrics. Single-event metrics measure the direct effects of a single aircraft movement and include metrics such as the Maximum A-weighted Sound Level, the Sound Exposure Level and the Effective Perceived Noise Level (EPNL). The Maximum A-weighted Sound Level is commonly used for airport noise monitoring while the EPNL metric is used by ICAO for its certification standards for new aircraft. Cumulative noise metrics are of interest when determining long-term exposure to aircraft noise based on an aggregation of all the single events indicating overall airport activity. The Equivalent Sound Level which indicates the average single-event noise level of all the single events experienced during a given time period is a common cumulative noise metric. The Day-Night-Level (DNL) derived from the Equivalent Sound Level averages noise over a 24-hour period and applies a 10 dB penalty for night-time events. The A-weighted DNL is used widely for noise impact assessments [14].
exposure to aircraft noise have been studied extensively. Behavioral impacts include general annoyance, sleep disturbance, disruption of work performance and learning, while physiological effects range from stress-related health effects from hypertension to hormone changes and mental health effects. Attributing behavioral impacts is difficult due to the confounding effects of both acoustical factors such as time variation in noise levels and ambient noise levels and non-acoustical effects such as lifestyle, attitude to noise, income-level, etc. Community annoyance and sleep disturbance are some of the better understood behavioral impacts of aircraft noise exposure with well-defined exposure-response relationships in literature. Figure 2-1 lists the varying impacts of aircraft noise on people in residential areas for different day-night average noise exposure levels [15].
Effects Hearing Loss Annoyance
Day-Night % of
Average Qualitative Population Avege General Community
Sound Level Description Highly Community Attitude Towards Area
in Decibels Annoyed Reaction
75 and May begin 37% Very severe Noise is likely to be the most important of all adverse
above to occur aspects of the community environment
70 Will not 22% Severe Noise is one of the most important adverse aspects
likely occur of the community environment
65 Will not 12% Significant Noise is one of the important adverse aspects of the
occur community environment
60 Will not 7% Moderate Noise may be considered an adverse aspect of the
occur to slight community environment
55 and Will not 3% Moderate Noise considered no more important than various
below occur to slight other environmental factors
Figure 2-1: Aircraft noise effects on residential areas [15]
Data obtained from annoyance surveys have been used to derive exposure-response functions for quantifying the number of people affected by a given noise level (for in-stance, see [16, 17, 18, 19]. Similarly for sleep disturbance, there have been several studies that assess impacts in terms of sleep awakenings from aircraft noise and pro-vide exposure-response functions. While there has been extensive research on sleep awakenings from single-events, few studies focus on awakenings from a full night of aircraft noise - which is a more relevant metric for policy analysis (see [20] and [21]). Aircraft noise has been strongly linked to learning disruption in students with effects such as lower reading comprehension and performance on tests, but there are
cur-rently no exposure-response functions to quantify this impact ([22], [23], [24], [25]).
Physiological impacts such as hypertension are better understood as compared to mental health effects and hormone changes, which currently lack conclusive evidence to establish a strong causal relationship with aircraft noise [26, 15]. Hypertension has been closely linked to aircraft noise as shown by several studies, but no exposure-response functions have been estimated ([27], [28]).
2.1.2
Air Quality Impacts
Emissions from aircraft jet engines include carbon dioxide (CO2), water vapor (H20), nitrogen oxides (NO,), carbon monoxide (CO), sulfur oxides (SO,), unburned hydro-carbons or volatile organic compounds (VOCs), particulates, and other trace com-pounds. Approximately 70% of aircraft emissions are CO2 emissions; H20 makes up
slightly less than 30% while the rest of the pollutant species amount to less than
1% each of the total emissions [29]. Aircraft emissions of NOT, CO, SOT, VOCs,
and particulates are of particular interest for air quality impacts in the vicinity of airports as most of them are designated as "criteria pollutants" by the US EPA and are associated with adverse health impacts. The US EPA under the Clean Air Act is required to set National Ambient Air Quality Standards for six principal pollutants which include
CO,
lead (Pb), nitrogen dioxide (NO2), 03, particulate matter (PM), and sulfur dioxide (SO 2). The following discussion provides a brief overview of each of the aviation pollutants linked to air quality impacts based on recent US EPA findings.e Nitrogen oxides (NOx):
The atmospheric modeling community defines oxides of nitrogen (NOx) as both
NO and NO2 which are by-products of high pressure and high temperature com-bustion such as in jet engines. Based on both epidemiological or observation data, and human and animal clinical studies, the recent US EPA integrated sci-ence assessment of NO2 concludes that there is a positive association between short-term exposure to gaseous NO2 and respiratory morbidity [30]. However, recent evidence does not clearly establish whether the association is solely due
to NO2 or whether NO2 is a surrogate for impacts related to a different pol-lutant. Additionally, a concentration-response relationship between NO2 and respiratory morbidity cannot be clearly defined based on current health data. However, NO, along with VOCs, hydrocarbons, and CO leads to the formation of ozone and NO, is also a precursor for other organic and inorganic oxidized nitrogen compounds contributing to ambient PM [30]. In the aviation context, ozone-related health impacts are insignificant as compared to PM impacts (less than 8%) and will not be discussed further here ([31], [32]).
* Carbon monoxide (CO):
CO emissions form as a result of incomplete combustion of fossil fuels. The EPA reports no significant health risks from CO based on current ambient
concentrations in the US [33].
" Sulfur oxides (SO,):
Combustion of sulfur containing fossil fuels leads to the formation of sulfur dioxide (SO 2), sulfur trioxide (SO3), and gas-phase sulfuric acid (H2SO4) which are referred to as sulfur oxides or SO,. SO2 is the dominant species with trace concentrations of SO3 and H2SO4. SO2 can also be transformed into secondary sulfate particles depending on atmospheric conditions thereby leading to PM formation. The recent US EPA integrated science assessment for SO, states that evidence from health studies points to a "causal relationship between res-piratory morbidity and short-term exposure to SO," and is "suggestive of a causal relationship between short-term exposure to SO, and mortality" [34]. However, uncertainties in the magnitude of health effect estimates and in deter-mining whether impacts are due to SO, alone or from a mixture of pollutants prevents a robust quantification of a concentration-response relationship [34].
" Particulate matter (PM):
Particulate matter emissions from aircraft are in the form of fine particles or PM2.5 where the aerodynamic diameter of the particles is less than 2.5pm
[32].
Aircraft PM2.5 emissions result from direct emissions of non-volatile PM as well as through secondary PM formation from precursor emissions of NOT, SOT, and hydrocarbons in the form of ammonium sulfates and ammonium nitrates
[35, 32]. Aircraft PM emissions largely comprise of secondary PM from
emis-sions of NO, and SO. with minor contributions from non-volatile PM. Fig-ure 2-2 shows the changes in annual PM2.5 concentrations in the US (in g/m 3) attributed to aircraft emissions taken from the forthcoming Energy Policy Act Study [36]. The US EPA sets the National Ambient Air Quality Standard for PM2.5 at 15 g/m 3. These results were obtained based on emissions below 3000 feet for aircraft operations from June 2005 to May 2006 at 325 US commercial airports representing 95% of US operations with filed flight plans. The changes in ambient PM2.5 concentrations were modeled with the high fidelity Commu-nity Multiscale Air Quality (CMAQ) simulation system used by the US EPA for its regulatory impact analyses. Aircraft emissions were found to increase av-erage annual PM2.5 concentrations by <0.1%. PM2.5 increases are also strongly
regional in nature with high impacts seen in California in Figure 2-2.
Changes in ambient PM2.5 concentrations can be related to health impacts
through concentration-response functions derived for different health end-points based on epidemiological studies. Exposure to PM2.5 has been linked to
prema-ture mortality and morbidity effects including cardiovascular and respiratory ailments [37]. The US EPA uses the Environmental Benefits Mapping Pro-gram (BenMAP) for performing health impact analyses to evaluate incidences and costs of different health effects [38]. The Energy Policy Act Study esti-mates aviation-related risk of premature mortality to be 64-270 yearly deaths using BenMAP [36]. Recent work by Brunelle-Yeung estimates 210 incidences of premature mortality attributable to aircraft PM emission in year 2005 (90% confidence interval of 130-340 yearly deaths). These premature mortality im-pacts are dominated by secondary PM formation from precursor NO, and SO, emissions, with relatively minor contributions from non-volatile PM and sec-ondary PM from hydrocarbons [39]. Several studies in literature indicate that
health impacts from aircraft PM emissions outweigh impacts from other aircraft pollutant species (see [32, 39, 31]).
With aircraf With aircraft
emissions emissions Percent
(pg/m3) removed Change Non-Attainment 17.76 17.75 -0.06% Areas All Counties 12.60 12.59 -0.08% Legend of Countie ( < .01 4ss 0g 0 oosoooo ae - 00510 0 13 010 2
Figure 2-2: Changes in annual PM2.5 concentrations attributed to aircraft emissions
[36]
Conventionally, air quality impact analysis for aviation has been focused on land-ing and takeoff emissions below 3000 feet. The ICAO-CAEP emissions certification standards are for landing and takeoff emissions owing to air quality concerns around airports. However, recent research indicates that aircraft cruise emissions (above
3000 feet) constitute a substantial portion of the total air quality health impacts of
aviation. Barrett et al. in a forthcoming: paper estimate that premature mortality impacts from global aircraft cruise emissions comprise 80-90% of the total health im-pacts of aviation [40]. With further research, future assessments of aviation air quality impacts may need to include both landing and takeoff as well as cruise emissions to
account for the full impact of aviation emissions.
2.1.3
Climate Impacts
The Intergovernmental Panel on Climate Change (IPCC) has published a comprehen-sive report on the climate impacts of aviation identifying the main pathways through which aviation perturbs the planetary radiative balance [41]. The IPCC defines ra-diative forcing (RF) as a "measure of the influence that a factor has in altering the balance of incoming and outgoing energy in the Earth-atmosphere system" [42]. A positive RF implies a warming effect, while a negative RF indicates a cooling ef-fect. The more recent IPCC Fourth Assessment Report estimates the total radiative forcing attributed to subsonic aviation in 2005 to be about 3% of the total anthro-pogenic radiative forcing not accounting for cirrus cloud enhancement (with a range of 2-9% skewed towards lower percentages) [42]. The aviation-specific climate im-pacts described here focus on commercial subsonic aviation where aircraft typically
fly in the upper troposphere and the lower stratosphere between an altitude range
of 9-13 km. Aviation emissions directly or indirectly perturb the planetary radiation balance through effects that are diverse in terms of time-scales and spatial variations involved. Next, a brief description of the characteristics of the different forcing agents associated with aviation emissions is provided. Chapter 4 presents a more detailed literature review of aviation climate impact assessment methods.
"
Carbon dioxide (C0 2):Aviation CO2 emissions have the same climate change impacts as CO2 emissions from any other sources given that CO2 is a long-lived, well-mixed greenhouse gas. CO2 emissions have a net warming effect with a positive radiative forcing.
CO2 emissions lead to spatially homogeneous impacts and have an atmospheric residence time on the order of centuries [41].
"
Water vapor (H20):H20 emissions have a direct warming effect with a lifetime on the order of days.
Water vapor emissions in the troposphere due to aviation do not have a major climate impact, however, for supersonic aircraft which fly in the stratosphere, H20 can be a significant greenhouse gas [41].
9 Nitrogen oxides (NO,):
NO, emissions have two indirect effects - warming from ozone production and
cooling from the destruction of methane. NO, emissions produce OH radi-cals which increase the oxidative capacity of the atmosphere; this decreases methane (CH4) concentrations and has an associated primary-mode reaction
that suppresses methane-related tropospheric ozone formation in the long run. NO-related radiative forcing perturbations strongly depend on seasonal varia-tions in solar insolation and background NOx and HOx concentravaria-tions and show large spatial variations in radiative impacts [41]. The short-lived 03 warming effect from NOx emissions lasts on the order of a few months while the longer-lived NOx-CH4-03 cooling effect has a decadal lifetime [43, 44]. At a
globally-averaged scale the short-lived NOx-0 3 and the long-lived NOX-CH4-0 3 are of
roughly equal magnitude with opposite signs with a net impact close to zero; however regional variations can be significant.
" Contrails and aviation-induced cirrus:
The formation of linear contrails and aviation induced cirrus from persisting linear contrails is a warming impact unique to aviation and depends on water vapor emissions, ambient conditions (pressure, temperature and relative humid-ity), and the overall propulsive efficiency of the aircraft. Linear contrails can persist for hours while cirrus can persist from several hours to days [41].
* Sulfate aerosols and particulate matter:
Sulfate aerosols from aircraft reflect sunlight with a cooling effect; black carbon or soot on the other hand absorbs sunlight and has a warming effect. Sulfates and black carbon have a residence time lasting from days to weeks. Aerosol emissions from aircraft may also serve as cloud condensation nuclei or alter the microphysical properties of cirrus clouds thereby modifying their radiative impact; this is an area of ongoing research [41].
CO emissions from aircraft are significantly smaller in magnitude as compared
to other sources of CO and are generally considered to have a negligible impact on tropospheric ozone chemistry. Aircraft unburned hydrocarbons or VOCs are also found to have a negligible climate perturbation [41].
Current scientific understanding of the different climate change mechanisms at-tributed to aviation varies across the different effects described. The most recent updates to radiative forcing estimates from the IPCC [41] are provided by Lee et al. [45], shown in Figure 2-3. Figure 2-3 identifies the main effects and indicates the un-certainties associated with each impact. CO2 has a relatively well understood impact while the aviation-induced cirrus effect has the highest uncertainties. Figure 2-3 does not provide a mean estimate for the cirrus effect but provides bounds on the radia-tive forcing reflecting the poorly understood processes that lead to cirrus formation and the resulting impacts. The indirect effect of aerosols on cirrus properties is not indicated on this chart. The level of understanding for NO-related effects is rated as medium to low while that of all other effects is rated as being low by Lee et al. [45].
RF Terms (W m) Spal
Carbon dioxide Global High
Ozone 0.0263 continental e
po co(0.219) hemispheric **
NO, reuto (0.0104) Global
d
Total NO, 0.018 Global
Water vapour I 0.0028 Hemispheric
W v(0.0020) to global
Best estimate -0.0048
Local to
Sulphate aerosol Estimate (-0.0035) global O
flf
(IPCC AR4 values)Soot aerosol @,I-- 90% confidence 1 (0.0025) 0.0034 to globalLocal
Linear contrails Linarcotril (0.010) continental ltoLO
Induced cirrus. Local to Very
cloudiness I I hemispheric Low
Total aviation 0.055 Global LOW
(Excl. induced cirrus) (0.0478)
Total aviation 0.078 Global Low
(Inc. induced cirrus) .
-0.08 -0.04 0 0.04 0.08 0.12 Radiative Forcing (W m-2
)
Figure 2-3: Radiative forcing from aircraft emissions in 2005
[45]
2.2
Current Decision-making Practices for
Avia-tion Environmental Policies
2.2.1
Common Approaches for Economic Policy Analysis
Regulatory agencies in many world regions use economic analysis to guide policy decisions through an explicit accounting of the costs and benefits associated with a regulatory change. Economic policy evaluation approaches commonly used in pol-icy assessments include cost-benefit, costieffectiveness, and distributional analyses.
A cost-benefit analysis (CBA) requires that the effect of a policy relative to a
well-defined baseline scenario be calculated in c<nsistent units, typically monetary, making costs and benefits directly comparable. The cost-benefit approach is aimed at max-imizing the net social benefit of regulation, where the net benefit is defined as the benefits of the regulation (e.g. number of people removed from a certain noise level) minus the costs of the regulation (e.g. the additional costs of technology) [46, 47].
Cost-effectiveness analysis (CEA) is meant to be used for evaluating policies with very similar expected benefits; a policy that achieves the expected benefits with the least costs is the preferred policy [47]. Finally, a distributional analysis is meant to address the question of who benefits and who bears the costs of the proposed policies
[48].
Within the United States, all federal agencies are mandated to evaluate costs and benefits of regulatory measures including environmental measures as issued by executive orders and directives from the Office of Budget and Management [48, 49]
. Although CBA is the recommended basis for assessing policy alternatives in many
governments (see, for example: [50], p59; [51], p2-3; [49], p11; [52], p23; and [53], p22), other forms of economic analysis are used in the absence of adequate information to quantify costs and/or benefits. A common method is CEA, where policies are compared on the basis of cost when similar benefit outcomes are expected. In practice within the ICAO-CAEP for example, some analysis is carried out under the heading of CEA where benefits are quantified in terms of a physical measure, such as tons of NO, reduced, or number of people removed from a certain noise level even when similar benefit outcomes are not expected. The next section discusses the methods adopted by the ICAO-CAEP and illustrates the shortcomings in adopting the CEA approach for aviation environmental policy analysis.
2.2.2
ICAO-CAEP Environmental Policy Analysis
The International Civil Aviation Organization (ICAO) established under the Chicago Convention in 1944, is a specialized agency within the United Nations charged with fostering a safe and orderly development of the technical and operational aspects of international civil aviation [54]. The ICAO establishes Standards and Recommended Practices which not only include the environment but also focus on safety, personnel licensing, operation of aircraft, airports, air traffic services, and accident investiga-tion. Within ICAO, the Committee on Aviation Environmental Protection, CAEP, oversees the technical work in the environmental area for aircraft noise and emissions.
groups deal with aircraft noise issues, while the remaining three focus on the technical and operational aspects of aircraft engine emissions; the support group provides in-formation on economic costs and environmental benefits of proposed regulations [55]. Next, an overview of conventional ICAO practices for conducting economic policy analysis is presented through considering the most recent NO. stringency analysis.
The NO. stringency analysis refers to a consideration of technology changes nec-essary and additional costs incurred for lowering the current allowable level of NO, emission from aircraft engines. All aircraft engines are required to be tested and certified to have NO. emissions below the latest CAEP standard expressed in terms of grams of NO, emissions during the landing-takeoff cycle normalized by the maxi-mum engine takeoff thrust rating. The new increased NO stringency level is typically applicable to new engines being introduced into the fleet, but may also lead to an early retirement of non-compliant engines. Chapter 6 provides a brief overview of aircraft engine NO emissions standards. In support of the CAEP standards on NO, emissions for the sixth meeting of the CAEP, the Forecasting and Economic Analysis
Support Group (FESG) within CAEP presented a cost-effectiveness analysis of NO, emission stringency options (to be referred to as CAEP/6 -IP/13) [56]. The CAEP/6
NO, stringency analysis considered lowering the allowable level of NO, emissions by
increments of between 5% and 35% with implementation in 2008 or 2012. Outcomes of this analysis as well as negotiations with stakeholder resulted in the decision to reduce certified emissions levels for new engines by 12% starting in 2008.
The CAEP/6-IP/13 analysis conducted a comprehensive costs analysis that ac-counted for both non-recurring and recurring manufacturer and operator costs and loss in value of the existing fleet. Non-recurring manufacturer costs varied by the level of technology change necessary for different non-compliant engine families while recurring manufacturing costs accounted for higher production costs resulting from increased complexity and the use of more expensive materials. Recurring operator costs included the cost of additional fuel and the cost of additional maximum take-off weight to preserve mission capability for those engine families that incurred a fuel burn penalty from technology change. Additionally, recurring operator costs also
in-cluded increased landing fees from additional take-off weight of aircraft, changes in maintenance costs, and increases in maintaining spare engine inventories due to loss of fleet commonality from stringency compliance. The loss in fleet value accounted for costs of retrofitting existing engine types to make them compliant with the new stringency standards. The analysis did not pass costs on to passengers through in-creased fares as the impacts of inin-creased fares on consumer demand were assumed to be negligible.
On the benefits side, the FESG estimated reductions in NO, emissions over the landing and take-off cycle resulting from technology changes. The analysis also re-ported changes in CO2 emissions resulting from a fuel burn penalty for some engine
families. Impacts of the fuel burn penalty were accounted for on the costs side, but not on the benefits side. The benefits or reductions in NO, emissions were not mone-tized for a direct comparison with the costs. The analysis did not explicitly evaluate the health and welfare impacts of changes in air quality and climate that would be associated with increased NO, certification stringency. The fuel burn penalty for the lower NO, technology engines was assumed to lead to increases in aircraft weight in order to preserve aircraft payload-range capabilities; these increases in aircraft weight may result in increased noise levels. The FESG study did not account for in-terdependencies between noise and emissions stringency standards. Figure 2-4 shows the results from the CAEP/6 IP/13 analysis; stringency levels ranging from 5% to
35% relative to CAEP/4 standards for two implementation years 2008 and 2012 were
assessed.
Based on the assumptions described previously, for a 3% discount rate, the 10% stringency option implemented in year 2008 was found to be the most cost-effective scenario at $30,000/tonne-NO,. However, the conclusions from the cost-effectiveness analysis can be misleading if there is a non-linear relationship between the interme-diate physical measure of the benefits (in this case reductions in NO, emissions) and the ultimate health and welfare benefits. Additionally, the cost-effectiveness ranking of a policy measure does not indicate whether the net benefits of the policy measure exceed the anticipated benefits. The US EPA guidelines for economic analysis state
that "Cost-effectiveness analysis does not: necessarily reveal what level of control is reasonable, nor can it be used to directly compare situations with different benefit streams" [50]. In the case of a NO. stringency analysis, reductions in NO- emissions alone do not provide an estimate of the resulting impacts on air quality and climate nor an assessment of whether or not the $30,000/tonne-NO, costs are justified.
Cost-effectiveness estimates
2002-2020
450000
Most cost-effective scenario 2012
400000 - $30,000/tonne-NOx 350000 10% stringency 300000 2008 implementation Discount Rate - 3% ()250000 2008 b 200000 I 150000 100000 50000 * 0-0% 5% 10% 15% 20% 25% 30% 35%
Certification Stringency Level
Figure 2-4: CAEP/6 FESG economic analysis [56]
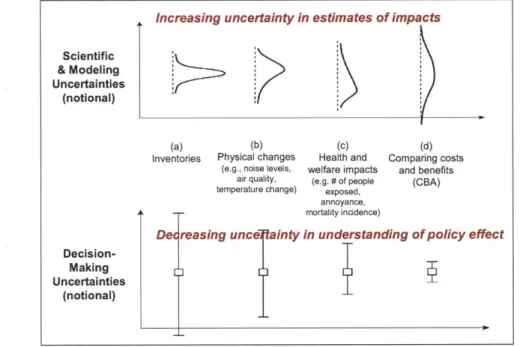
Growing uncertainty in estimating policy impacts is the reason commonly cited for not including environmental impact assessment in the policy analysis process. As policy impacts are estimated further along the impact pathway (e.g. going from emissions inventories, to physical changes in the atmosphere, to health impacts, to monetary estimates), uncertainty in the estimated impacts increases. Moving further down the impact pathway involves incorporating knowledge from several disciplines which in turn brings along uncertainties f om different fields. Evaluating monetized environmental impacts not only includes uncertainties associated with estimating emissions inventories but also related to the current understanding of atmospheric processes and associated health impacts as well as valuation approaches. However, when considering uncertainties, it is impo tant to recognize the distinction between uncertainties in the modeling methods and uncertainties in the decision-making
![Figure 2-1: Aircraft noise effects on residential areas [15]](https://thumb-eu.123doks.com/thumbv2/123doknet/14099103.465385/25.918.152.788.484.734/figure-aircraft-noise-effects-residential-areas.webp)
![Figure 2-2: Changes in annual PM 2 . 5 concentrations attributed to aircraft emissions [36]](https://thumb-eu.123doks.com/thumbv2/123doknet/14099103.465385/29.918.250.739.177.646/figure-changes-annual-pm-concentrations-attributed-aircraft-emissions.webp)
![Figure 2-3: Radiative forcing from aircraft emissions in 2005 [45]](https://thumb-eu.123doks.com/thumbv2/123doknet/14099103.465385/33.918.200.735.113.565/figure-radiative-forcing-aircraft-emissions.webp)

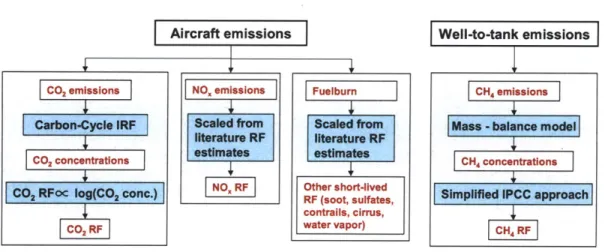
![Figure 4-2: APMT-Impacts Climate Module (adapted from Marais et al. [86])](https://thumb-eu.123doks.com/thumbv2/123doknet/14099103.465385/61.918.273.742.484.940/figure-apmt-impacts-climate-module-adapted-marais-et.webp)
![Figure 4-4: Comparison of CO 2 results from APMT and MAGICC (a) CO 2 Concen- Concen-trations [ppm], (b) CO 2 radiative forcing [W/m 2 ]](https://thumb-eu.123doks.com/thumbv2/123doknet/14099103.465385/78.918.162.792.159.397/figure-comparison-results-magicc-concen-concen-trations-radiative.webp)
![Figure 4-6: Comparison of CH 4 results from APMT and MAGICC with similar as- as-sumptions (a) CH 4 Concentrations [ppb], (b) CH 4 radiative forcing [W/m 2 ]](https://thumb-eu.123doks.com/thumbv2/123doknet/14099103.465385/80.918.167.794.158.416/figure-comparison-results-magicc-similar-sumptions-concentrations-radiative.webp)

