HAL Id: hal-03033240
https://hal.archives-ouvertes.fr/hal-03033240
Preprint submitted on 1 Dec 2020
HAL is a multi-disciplinary open access archive for the deposit and dissemination of sci-entific research documents, whether they are pub-lished or not. The documents may come from teaching and research institutions in France or abroad, or from public or private research centers.
L’archive ouverte pluridisciplinaire HAL, est destinée au dépôt et à la diffusion de documents scientifiques de niveau recherche, publiés ou non, émanant des établissements d’enseignement et de recherche français ou étrangers, des laboratoires publics ou privés.
Corronc, Pascal Branchereau, Yulia Timofeeva, François Xavier Lejeune,
Christine Mouffle, Hervé Arulkandarajah, et al.
To cite this version:
François Lejeune, Jean Mangin, Juliette Boeri, Claude Meunier, Hervé Le Corronc, et al.. Two voltage-dependent currents can explain the functional diversity of embryonic Renshaw cells. 2020. �hal-03033240�
Two voltage-dependent currents can explain the functional
1diversity of embryonic Renshaw cells.
23
Juliette Boeri1¶, Claude Meunier2 ¶, Hervé Le Corronc1,3 ¶, Pascal Branchereau4, Yulia 4
Timofeeva2,5,6, François Xavier Lejeune7, Christine Mouffle1, Hervé Arulkandarajah1, Jean
5
Marie Mangin1, Pascal Legendre1&*, Antonny Czarnecki1&* 6
7
1 INSERM, UMR_S 1130, CNRS, UMR 8246, Neuroscience Paris Seine, Institute of Biology
8
Paris Seine, Sorbonne Univ, Paris, France. 9
10
2 Centre de Neurosciences Intégratives et Cognition, CNRS UMR 8002, Institut
11
Neurosciences et Cognition, Université de Paris, Paris, France. 12
13
3 Univ Angers, Angers, France.
14 15
4 Univ Bordeaux, INCIA, UMR 5287, Bordeaux, France.
16 17
5 Department of Computer Science and Centre for Complexity Science, University of
18
Warwick, Coventry, UK. 19
20
6 Department of Clinical and Experimental Epilepsy, UCL Queen Square Institute of
21
Neurology, University College London, London, UK. 22
23
7 Institut du Cerveau et de la Moelle Epinière, Centre de Recherche CHU Pitié-Salpétrière,
24
INSERM, U975, CNRS, UMR 7225, Sorbonne Univ, Paris, France. 25 26 * Corresponding authors 27 Email: [email protected] (PL) 28
Email: [email protected] (AC) 29
30 31
¶These authors contributed equally to this work.
32 33
&These authors also contributed equally to this work.
1
Abstract
35
Spontaneous neuronal activity occurs at the onset of the synaptogenesis in the central Nervous 36
System and plays a major role in shaping developing neural networks. How intrinsic 37
properties of neurons evolve during this critical developmental period remains largely 38
unknown. We studied the Renshaw cells because they participate to the early-synchronized 39
neuronal activity in the embryonic spinal cord. We found that these interneurons are 40
subdivided into several functional clusters at the onset of the synaptogenesis and then display 41
a transitory involution process during which they lose their ability to sustain tonic firing. This 42
complex developmental trajectory results from the synergy between a persistent sodium 43
inward current and a delayed rectifier potassium outward current, which are present in most 44
neurons during development and in the adult. Taken together, our results reveal a core 45
mechanism producing functional hetereogeneity in embryonic neurons and likely shaping the 46
ongoing of early spontaneous neuronal activity. 47
48
Keywords: development, spinal cord, embryo, Renshaw cell, firing pattern, functional 49
involution, electrophysiology, biophysical modeling. 50
2
Introduction
52
The development of the central nervous system (CNS) follows complex steps, which 53
depend on genetic and environmental factors and involve interactions between multiple 54
elements of the neural tissue. Remarkably, emergent neurons begin to synchronize soon after 55
the onset of synapse formation, generating long episodes of low frequency (<0.01 Hz) 56
correlated spontaneous network activity (SNA) (Blankenship & Feller 2010, Hanson & 57
Landmesser 2003, Khazipov & Luhmann 2006, Milner & Landmesser 1999, Momose-Sato & 58
Sato 2013, Myers et al 2005, O'Donovan 1999, Saint-Amant 2010). In the mouse embryonic 59
spinal cord (SC), SNA is driven by an excitatory cholinergic-GABAergic loop between 60
motoneurons (MNs) and interneurons (INs), GABA being depolarizing before embryonic day 61
16.5 (E16.5) (Allain et al 2011). SNA emerges around E12.5 (Branchereau et al 2002, 62
Czarnecki et al 2014, Hanson & Landmesser 2003, Myers et al 2005, Yvert et al 2004), at a 63
time when functional neuromuscular junctions are not yet established (Pun et al 2002) and 64
sensory and supraspinal inputs have not yet reached the spinal motor networks (Angelim et al 65
2018, Ballion et al 2002, Marmigere & Ernfors 2007, Ozaki & Snider 1997). 66
Several studies pointed out that SNA is an essential component in neuronal networks 67
formation. (Hanson et al 2008, Katz & Shatz 1996, Moody & Bosma 2005, Spitzer 2006). In 68
the SC, pharmacologically-induced disturbances of SNA between E12.5 and E14.5 induce 69
defects in the formation of motor pools, in motor axon guidance to their target muscles and in 70
the development of motor networks (Hanson & Landmesser 2004, Hanson & Landmesser 71
2006, Hanson et al 2008, Myers et al 2005). During SNA episodes, long lasting giant 72
depolarization potentials (GDPs) are evoked in the SC, mainly by the massive release of 73
GABA onto MNs (Czarnecki et al 2014). Renshaw cells (V1R) are likely the first GABAergic
74
partners of MNs in the mouse embryo (Benito-Gonzalez & Alvarez 2012, Boeri et al 2018), 75
3 and the massive release of GABA during SNA probably requires that many of them display 76
repetitive action potential firing or plateau potential activity (Boeri et al 2018). 77
However, little is known about the maturation of the intrinsic properties and the firing 78
pattern of embryonic V1R. We recently found that V1R exhibit heterogeneous excitability 79
properties when SNA emerges in the SC (Boeri et al 2018) in contrast to adult Renshaw cells 80
that constitute a functionally homogeneous population (Bikoff et al 2016, Perry et al 2015). 81
Whether this early functional diversity really reflects distinct functional classes of embryonic 82
V1R, how this diversity evolves during development, and what are the underlying biophysical 83
mechanisms remain open questions. The impact of the functional diversity of V1R on MN 84
activity during SNA episodes is also unknown. The present study addresses these issues using 85
multiple approaches, including patch-clamp recordings, cluster analysis, biophysical 86
modeling and dynamical systems theory. The firing patterns of V1R and the mechanisms 87
underlying their functional diversity are analyzed during a developmental period covering the 88
initial phase of development of SC activity in the mouse embryo (E11.5-E14.5), when SNA is 89
present, and during the critical period (E14.5-E16.5), when GABAergic neurotransmission 90
gradually shifts from excitation to inhibition and locomotor-like activity emerges 91
(Branchereau et al 2002, Myers et al 2005, Yvert et al 2004). 92
We discover that the balance between the slowly inactivating subthreshold persistent 93
sodium inward current (𝐼!"#) (Crill 1996) and the delayed rectifier potassium outward current 94
(𝐼!"#), accounts for the heterogeneity of embryonic V1R and the changes in firing pattern
95
during development. The heterogeneity of V1R at E12.5 arises from the existence of distinct
96
functional groups. Surprisingly, and in opposition to the classically accepted development 97
scheme (Gao & Ziskind-Conhaim 1998, Gao & Lu 2008, Liu et al 2016, McKay & Turner 98
2005, Pineda & Ribera 2010, Sillar et al 1992), we show that the embryonic V1R population 99
loses its ability to support tonic firing from E13.5 to E15.5, exhibiting a transient functional 100
4 involution during its development. Our experimental and theoretical results provide a global 101
view of the developmental trajectories of embryonic V1R. They demonstrate how a simple 102
mechanism, based on the synergy of two major opposing voltage-dependent currents that are 103
ubiquitous in neurons, can produce functional diversity. 104
5
Results
106
The delayed potassium rectifier current 𝐼!"# is a key partner of the persistent sodium 107
current 𝐼!"# in controlling embryonic V1R firing patterns during development
108
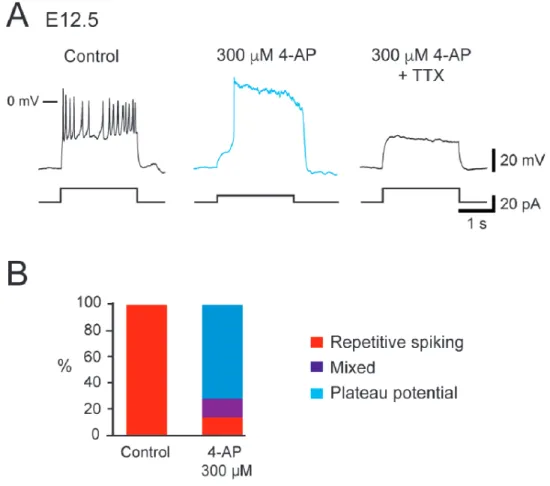
We previously highlighted that V1R are spontaneously active at E12.5. Their response to a 109
2 s suprathreshold depolarizing current steps revealed four main patterns, depending of the 110
recorded interneuron (Boeri et al 2018): V1R firing only 1-3 APs at the onset depolarizing 111
pulse, which were named single spiking (SS) V1R, repetitive spiking (RS) V1R (Figure 1A), 112
long-lasting sodium-dependent plateau potentials (PP) V1R and mixed events (ME) V1R that
113
shows an alternation of action potentials (APs) and plateau potentials (Boeri et al 2018). 114
We also uncovered a relationship between 𝐼!"# and the ability of embryonic V1R to sustain
115
repetitive firing (Boeri et al 2018). However, the heterogeneous firing patterns of V1R
116
observed at E12.5 could not be fully explained by variations in 𝐼!"# (Boeri et al 2018) 117
suggesting the involvement of other voltage-gated channels, in particular potassium channels, 118
known to control firing and AP repolarization, play a role in controlling the firing pattern of 119
V1R. Our voltage clamp protocol did not reveal any inward rectifying current 120
(hyperpolarizing voltage steps to -100 mV from 𝑉! = -20 mV, data not shown), but we found
121
two voltage-dependent outward potassium currents, a delayed rectifier current (𝐼!"#) and a
122
transient potassiumcurrent (𝐼!) in embryonic V1R,whatever the firing pattern (Figures 1 B1,
123
B2 and B3). These two currents are known to control AP duration and/or firing pattern 124
(Coetzee et al 1999). The activation threshold of 𝐼!"# lied between -30 mV and -20 mV and 125
the threshold of 𝐼! between -60 mV and -50 mV, (n = 27) (Figures 1 C1, C2 and C3). 126
It was unlikely that the heterogeneity of V1R firing patterns resulted from variations in the 127
intensity of 𝐼!. Indeed its voltage-dependent inactivation (time constant: 23.3 ± 2.6 ms, n = 8), 128
which occurs during the depolarizing phase of an AP, makes it ineffective to control AP or 129
plateau potential durations. This was confirmed by our theoretical analysis (see Figure 10-130
6 figure supplemental 1). We thus focused on 𝐼!"#. At E12.5, PP V1R had a significantly lower 131
𝐺!"# (2.12 ± 0.44 nS, n = 6) than SS V1R (5.57 ± 0.56 nS, n = 9) and RS V1R (6.39 ± 0.83 nS,
132
n = 7) (Figure 2A). In the same manner, PP V1R at E12.5 had a significantly lower 𝐺!"# than
133
SS V1R at E14.5 (11.11 ± 1.12 nS, n = 10). However, there was no significant difference
134
in 𝐺!"# between SS V1R and RS V1R at E12.5 (Figure 2A), which indicated that variations in
135
𝐺!"# alone could not explain all the firing patterns observed at E12.5. Similarly, there was no 136
significant difference in 𝐺!"# between RS V1R (0.91 ± 0.08 nS, n = 8) and PP V1R (1.24 ±
137
0.19 nS, n = 6) at E12.5 (Figure 2B), indicating that variations in 𝐺!"# alone could not
138
explain all the firing patterns of V1R at E12.5 (Boeri et al 2018). In contrast 𝐺!"# measured in 139
SS V1R at E12.5 (0.21 ± 0.06 nS, n = 9) were significantly lower compared to 𝐺!"# measured
140
in RS V1R and in PP V1R at E12.5 (Figure 2B). 141
Because the firing pattern of a neuron depends on the balance between outward currents 142
and inward voltage-dependent currents (Coetzee et al 1999), we then hypothesized that the 143
different firing patterns of V1R observed at E12.5were related to the 𝐺!"# / 𝐺!"# ratio. We 144
found that this ratio was significantly lower for SS V1R recorded at E12.5 (𝐺
!"# / 𝐺!"# =
145
0.043 ± 0.015, n = 9) or at E14.5 (0.012 ± 0.004, n = 10) compared to RS V1R (0.154 ± 0.022,
146
n = 8) and PP V1R (0.66 ± 0.132, n = 6) recorded at the same age (Figure 2C). We also found 147
that the 𝐺!"# / 𝐺!"# ratio was significantly lower for RS V1R compared to PP V1R (Figure
148
2C). 149
Altogether, these results strongly suggest that, although the presence of 𝐼!"# is required 150
for embryonic V1R to fire repetitively or to generate plateau potentials (Boeri et al 2018), the 151
heterogeneity of the firing pattern observed between E12.5 is not determined by 𝐼!"# per se 152
but likely by a synergy between 𝐼!"# and 𝐼!"#. 153
154
Manipulating the balance between GNap and GKdr changes embryonic V1R firing patterns.
7 We previously showed that blocking 𝐼!"# with riluzole converted PP V1R or RS V1R into
156
SS V1R (Boeri et al 2018). To confirm further that the balance between 𝐺
!"# and 𝐺!"# was
157
the key factor in the heterogeneity of V1R firing patterns, we assessed to what extent a given 158
SS V1R cell could change its firing pattern when 𝐼!"# was gradually blocked by 4-159
aminopiridine (4-AP). We found that 𝐼!"# could be blocked by µM concentrations of 4-AP
160
(Figure 3) without affecting IA (Figure 3-Figure supplement 1). 4-AP, applied at
161
concentrations ranging from 0.3 µM to 300 µM, specifically inhibited 𝐼!"# (Figures 3 A1 and
162
A2) with an IC50 of 2.9 µM (Figure 3B). These results favor the presence of the potassium
163
channel subunit KV3.1 (Gutman et al 2005, Liu & Kaczmarek 1998), which is known to be
164
also present at postnatal stages in V1R (Song et al 2006). 165
We then determined to what extent increasing the concentration of 4-AP modified the 166
firing pattern of V1R at E12.5. Applying 4-AP at concentrations ranging from 3 µM to 300
167
µM changed the firing pattern of SS V1R recorded at E12.5 (n = 10) in a concentration-168
dependent manner (Figures 4 A1, A2 and A3). In 50% of the recorded V1R, increasing 4-AP 169
concentrations successfully transformed SS V1R into PP V1R with the following sequence: SS 170
à RS à ME à PP (Figure 4A1). In a second group of embryonic V1R (25%), 4-AP 171
application only evoked mixed activity, with the same sequence as aforementioned (SS à RS 172
à ME). In the remaining SS V1R (25%), increasing 4-AP concentration only led to sustained 173
AP firing (Figure 4A2). Application of 300 µM 4-AP on RS V1R at E12.5 evoked mixed 174
events or plateau potentials(Figure 4-figure supplement 1). Plateau potentials and repetitive 175
spiking evoked in the presence of 300 µM 4-AP were fully blocked by 0.5-1 µM TTX, 176
indicating that they were generated by voltage-gated Na+ channels (Figures 4 B and C and 177
Figure 4-figure supplement 1). It should be noted that the application of 300 µM of 4-AP 178
induced a significant 30.5 ± 12.4 % increase (P = 0.0137; Wilcoxon test) of the input 179
resistance (1.11 ± 0.08 GΩ versus 1.41 ± 0.12 GΩ; n = 11). 180
8 181
These results show that, in addition to 𝐼!"#, the delayed rectifier potassium current is also a 182
major determinant of the firing pattern of embryonic V1R. They suggest that the firing pattern
183
depends on a synergy between 𝐼!"# and 𝐼!"# and that the different patterns can be ordered 184
along the following sequence SS à RS à ME àPP when the ratio 𝐺!"#/ 𝐺!"# is increased. 185
186
The heterogeneity of the V1R firing patterns decreases during embryonic development 187
It was unclear whether these different firing patterns corresponded to well separated 188
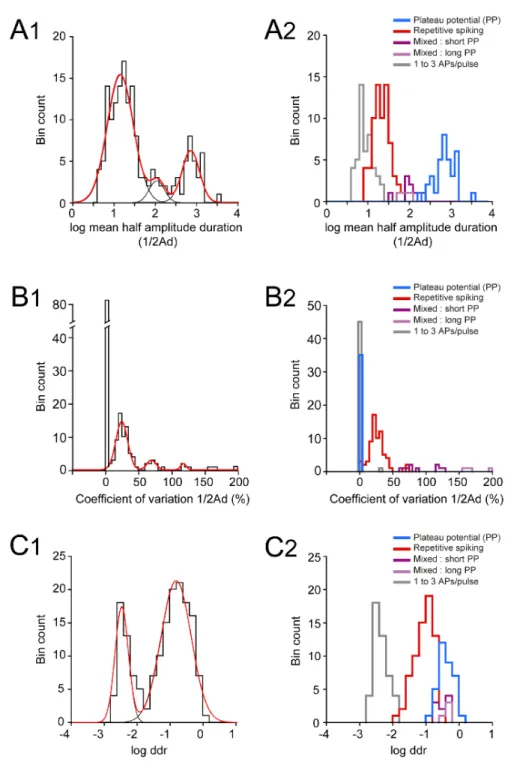
classes within the E12.5 V1R population. To address this issue, we performed a hierarchical 189
cluster analysis on 163 embryonic V1R, based on three quantitative parameters describing the 190
firing pattern evoked by the depolarizing pulse: the mean duration of evoked APs or plateau 191
potentials measured at half-amplitude (mean ½Ad), the variability of the event duration 192
during repetitive firing (coefficient of variation of ½Ad: CV ½Ad) and the total duration of all 193
events, expressed in percentage of the pulse duration (depolarizing duration ratio: ddr) (Figure 194
5A inserts). In view of the large dispersion of mean ½Ad and ddr values, cluster analysis was 195
performed using the (decimal) logarithm of these two quantities (Sigworth & Sine 1987). The 196
analysis of the distribution of log mean ½Ad, CV ½Adand log ddr revealed multimodal 197
histograms that could be fitted with several Gaussians (Figure 5-Figure supplement 1 A1, B1 198
and C1). Cluster analysis based on these three parameters showed that the most likely number 199
of clusters was 5 (Figures 5 A and B), as determined by the silhouette width measurement 200
(Figure 5B). Two clearly separated embryonic V1R groups with CV½Ad= 0 stood out, as
201
shown in the 3D plot in figure 5C. The cluster with the largest ½Ad (mean ½Ad = 833.5 ± 202
89.99 ms) and the largest ddr (0.441 ± 0.044) contained all PP V1R (n = 35) (Figures 5C and 203
D and Figure 5-Figure supplement 1 A2, B2 and C2). Similarly, the cluster with the shortest 204
9 ½Ad (9.73 ± 0.66 ms) and the lowest ddr (0.0051 ± 0.0004) contained all SS V1R (n = 46) 205
(Figures 5 C and D and Figure 5-Figure supplement 1 A2, B2 and C2). 206
The three other clusters corresponded to V1R with nonzero values of CV ½Ad(Figure 5C). 207
A first cluster regrouping all RS V1R (n = 69) was characterized by smaller values of ½Ad 208
(23.91 ± 1.43 ms), CV½Ad(27.36 ± 1.64%) and ddr (0.11 ± 0.01) (Figures 5C and D and 209
figure 5-figure supplement 1 A2, B2 and C2). The last two clusters corresponded to ME V1R 210
(Figures 1C and 1D). The smaller cluster, characterized by a larger CV½Ad (170.9 ± 8.9%; 211
n= 4), displayed a mix of APs and short plateau potentials, while the second cluster, with 212
smaller CV½Ad (87.61 ± 7.37%; n = 9), displayed a mix of APs and long-lasting plateau 213
potentials (Figure 5D and figure 5-figure supplement 1 B2). Their ½Ad and ddr values were 214
not significantly different (Figure 5-figure supplement 1 A2 and C2). 215
It must be noted that three embryonic V1R (1.8%) were apparently misclassified since they 216
were aggregated within the RS cluster although having zero CV½Ad (Figure 5C; arrows). 217
Examination of their firing pattern revealed that this was because they generated only two 218
APs, although their ddr (0.16 to 0.2) and ½ Ad values (31.6 to 40.3 ms) were well in the range 219
corresponding of the RS cluster. 220
These different firing patterns of V1R might reflect different states of neuronal 221
development (Belleau & Warren 2000, Gao & Ziskind-Conhaim 1998, Picken Bahrey & 222
Moody 2003, Ramoa & McCormick 1994). Single spiking and/or plateau potentials are 223
generally believed to be the most immature forms of firing pattern, repetitive spiking 224
constituting the most mature form (Spitzer 2006, Tong & McDearmid 2012). If it were so, the 225
firing patterns of embryonic V1R would evolve during embryonic development from single 226
spiking or plateau potential to repetitive spiking, this latter firing pattern becoming the only 227
one in neonates (Perry et al 2015) and at early postnatal stages (Bikoff et al 2016). However, 228
RS neurons already represent 41% of V1R at E12.5. We therefore analyzed the development
10 of firing patterns from E11.5, when V1R terminate their migration and reach their final 230
position (Alvarez et al 2013), to E16.5. This developmental period covers a first phase of 231
development (E11.5-E14.5), where lumbar spinal networks exhibit SNA, and a second phase 232
(E14.5-E16.5), where locomotor-like activity emerges (Allain et al 2010, Branchereau et al 233
2000, Myers et al 2005, Yvert et al 2004). We first analyzed changes in the intrinsic 234
properties (input capacitance 𝐶!" , input resistance 𝑅!" = 1/𝐺!" and spike voltage threshold) 235
of V1R. 𝐶!" did not change significantly from E11.5 to E13.5 (Figure 6A), remaining of the 236
order of 12 pF, in agreement with our previous work (Boeri et al 2018). However, it increased 237
significantly at the transition between the two developmental periods (E13.5-E15.5) to reach 238
about 23.5 pF at E15.5 (Figure 6A). A similar developmental pattern was observed for 𝑅!" , 239
which remained stable during the first phase from E11.5 to E14.5 (𝑅!" ≈ 1-1.2 GΩ) but
240
decreased significantly after E14.5 to reach about 0.7 GΩ at E15.5 (Figure 2B). Spike 241
threshold also decreased significantly between the first and the second developmental phases, 242
dropping from about -34 mV at E12.5 to about -41 mV at E16.5 (Figure 2C). Interestingly, 243
this developmental transition around E14.5 correspond to the critical stage at which SNA 244
gives way to a locomotor-like activity (Allain et al 2010, Branchereau et al 2000, Yvert et al 245
2004) and rhythmic activity becomes dominated by glutamate release rather than 246
acetylcholine release (Myers et al 2005). 247
This led us to hypothesize that this developmental transition could be also critical for the 248
maturation of V1R firing patterns. The distinct firing patterns observed at E12.5 were already 249
present at E11.5 (Figures 7 A and F), but the percentage of RS V1R strongly increased from 250
E11.5 to E12.5, while the percentage of ME V1R decreased significantly (Figure 7F). The 251
heterogeneity of V1R firing patterns then substantially diminished. Plateau potentials were no
252
longer observed at E13.5, and ME V1R disappeared at E14.5 (Figures 7 C and F). 253
Interestingly, the proportion of SS V1R remained high from E13.5 to E15.5 and even slightly 254
11 increased (91.23% at E14.5 and 93.33% at E15.5; Figure 7F). This trend was partially 255
reversed at E16.5, as the percentage of RS V1R increased at the expense of SS V1R (67.86 % 256
SS V1R and 32.34% RS V1R; Figures 7 E and F). This decrease in repetitive firing capability 257
after E13.5 was surprising in view of what is classically admitted on the developmental 258
pattern of neuronal excitability (Moody & Bosma 2005, Spitzer et al 2000). Therefore, we 259
verified that it did not reflect the death of some V1R after E13.5. Our data did not reveal any 260
activated caspase3 (aCaspase3) staining in V1R (FoxD3 staining) at E14.5 (n = 10 SCs) 261
(Figure 8), in agreement with previous reports showing that developmental cell death of V1R 262
does not occur before birth (Prasad et al 2008). 263
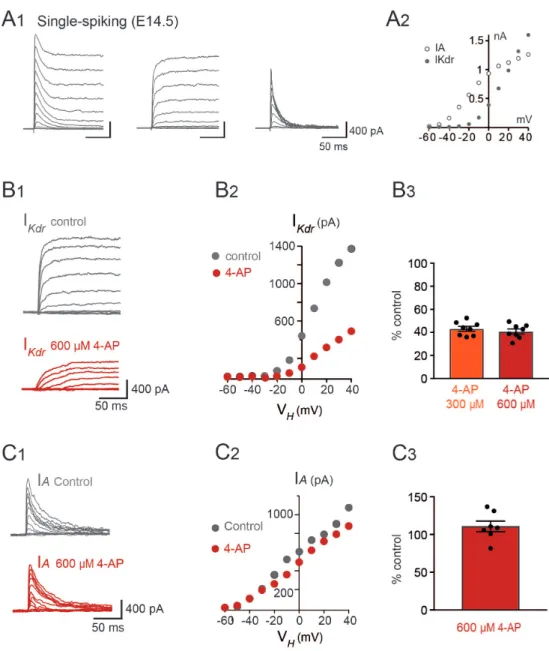
To determine to what extent the balance between 𝐺!"# and 𝐺!"# was the key factor that
264
also determined the V1R firing patterns at E14.5 (Figures 7 C and F), we tested the effect of 4-265
AP on single spiking V1R at this embryonic age. 𝐺
!"#in SS V1R at E14.5 (11.11 ± 1.12 nS, n
266
= 10) was significantly high when compared to 𝐺!"# measured at E12.5 in SS V1R (Figure 267
2A). INaP can still be observed in V1R at E14.5 (Figure 9-Figure supplement 1). 𝐺!"#
268
measured in SS V1R at E14.5 (0.13 ± 0.05 nS, n = 10) was similar to the 𝐺!"#measured at 269
E12.5 in SS V1R (Figure 2B). At E14.5, 300 µM 4-AP inhibited only 59.2% of 𝐼!"#.
270
Increasing 4-AP concentration to 600 µM did not inhibit 𝐼!"# significantly more (60.2%)
271
(Figure 9-Figure supplement 2), indicating that inhibition of 𝐼!"# by 4-AP reached a plateau
272
at around 300 µM. 600 µM 4-AP application had no significant effect on 𝐼! (Figure 9-Figure
273
supplement 2). The application of the maximal concentration of 4-AP tested (600 µM) 274
converted SS V1R (n = 13) to PP V1R (23.1%; Figures 9 A1 and B), RS V1R (38.5%; Figure 9 275
A2 and B) or ME V1R (38.4%; Figure 9B), as was observed at E12.5, thus indicating that the 276
firing pattern of V1R depends on the balance between 𝐼!"# and 𝐼!"# also at E14.5. Plateau 277
potential and repetitive spiking recorded in the presence of 4-AP at E14.5 were fully blocked 278
12 by 0.5-1 µM TTX indicating that they were generated by voltage-gated Na+ channels (Figures 279
9 A1 and A2), as observed at E12.5. 280
281
Theoretical analysis: basic model 282
As shown in Figure 10A for 26 cells, in which both 𝐺!"# and 𝐺!"# were measured, the
283
three largest clusters revealed by the hierarchical clustering analysis (SS, RS and PP, which 284
account together for the discharge of more than 95% of cells, see Figure 5) correspond to well 285
defined regions of the 𝐺!"#- 𝐺!"# plane. Single spiking is observed only when 𝐺!"# is
286
smaller than 0.6 nS. For larger values of 𝐺!"#, repetitive spiking occurs when 𝐺!"# is larger 287
than 3.5 nS, and V1R display plateau potentials when𝐺
!"# is smaller than 3.5 nS. Mixed
288
events (ME, 4.5% of the 163 cells used in the cluster analysis), where plateaus and spiking 289
episodes alternate, are observed at the boundary of RS and PP clusters. This suggested to us 290
that a conductance-based model incorporating only the leak current, 𝐼!"#, 𝐼!"# and 𝐼!"# (see 291
Materials and Methods) could account for the experimental observations, the observed 292
zonation being explained in terms of bifurcations between the different stable states of the 293
model. 294
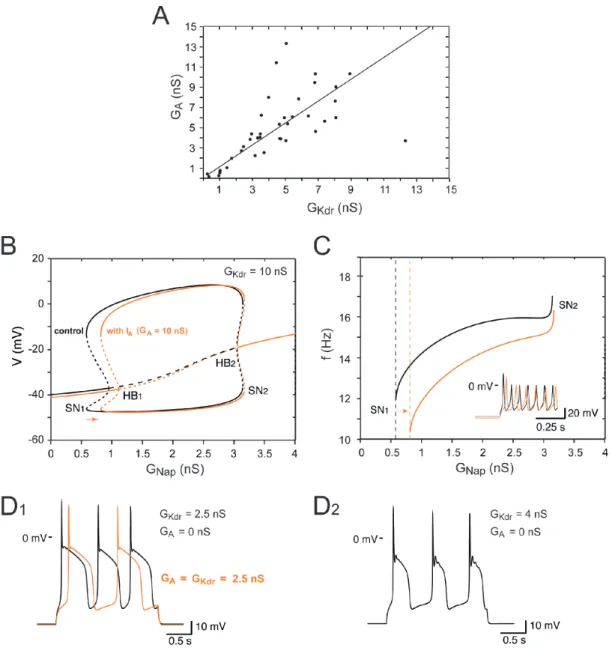
A one-parameter bifurcation diagram of the model is shown in Figure 10B for two values 295
of 𝐺!"# (2.5 nS and 10 nS) and a constant injected current 𝐼 = 20 pA. The slow inactivation of 296
𝐼!"# was not taken into account at this stage of our analysis. For 𝐺!"# = 10 nS, the
steady-297
state membrane voltage progressively increases (in gray) with 𝐺!"#, but repetitive spiking (in 298
red, see voltage trace for 𝐺!"#= 1.5 nS) is not achieved until 𝐺!"# reaches point SN , where a 1
299
saddle node (SN) bifurcation of limit cycles occurs. This fits with the experimental data, 300
where a minimal value of 𝐺!"# is required for repetitive spiking (see also (Boeri et al 2018)), 301
and is in agreement with the known role of 𝐼!"# in promoting repetitive discharge (Kuo et al 302
13 2006, Taddese & Bean 2002). Below SN the model responds to the onset of a current pulse 1,
303
by firing only one spike before returning to quiescence (see voltage trace for 𝐺!"#= 0.1 nS), 304
or a few spikes when close to SN (not shown) before returning to quiescence. The quiescent 1
305
state becomes unstable through a subcritical Hopf bifurcation (HB) at point HB , bistability 1
306
between quiescence and spiking occurring between SN1 to HB . Repetitive firing persists 1
307
when 𝐺!"# is increased further and eventually disappears at point SN2. The firing rate does
308
not change much throughout the RS range (Figure 10-Figure supplement 1 B), remaining 309
between 11.9 Hz (at SN1) and 17.1 Hz (at SN2). A stable plateau appears at point HB through 2
310
a subcritical HB. The model is bistable between HB and SN2 2, plateau and large amplitude
311
APs coexisting in this range. 312
The model behaves very differently when 𝐺!"# is reduced to 2.5 nS (gray-blue curve in 313
Figure 10B). It exhibits a unique stable fixed point whatever the value of 𝐺!"# is, and the 314
transition from quiescence to plateau is gradual as 𝐺!"# is increased. No repetitive spiking is 315
ever observed. This indicates that the activity pattern is controlled not only by 𝐺!"# but also 316
by 𝐺!"#. This is demonstrated further in Figure 10C, where 𝐺!"# was fixed at 1.5 nS while 317
𝐺!"# was increased from 0 to 25 nS. The model exhibits a plateau potential until 𝐺!"# is 318
increased past point HB2. Repetitive spiking then sets in, via a supercritical HB (in contrast to
319
the subcritical bifurcation in Figure 10B for 𝐺!"# = 10 nS, see legend of Figure 10). The 320
amplitude of AP decays to zero at HB2, and no bistability occurs. When 𝐺!"# is further
321
increased, repetitive firing eventually disappears through a SN bifurcation of limit cycles at 322
point SN1, the quiescent state becomes stable through a subcritical HB at point HB1, and
323
bistability occurs between these two points. This behavior is in agreement with Figure 10A. 324
Since both 𝐺!"# and 𝐺!"# control the firing pattern of embryonic V1R cells, we computed a
325
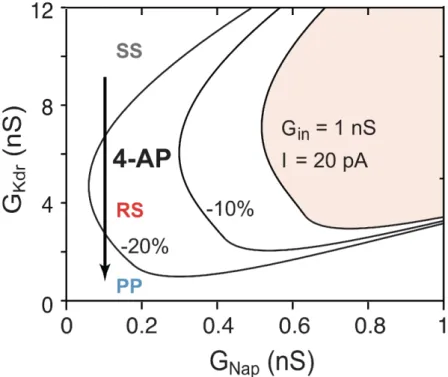
two-parameters bifurcation diagram (Figure 10D), where the different possible activity states 326
and the transitions between them are plotted in the 𝐺!"# - 𝐺!"# plane. The black lines 327
14 correspond to the bifurcations HB1 and HB2 and delimit a region where only repetitive firing
328
occurs. The red lines correspond to the SN bifurcations of periodic orbits associated with the 329
transition from quiescence to firing (SN1) and the transition from plateau to firing (SN2). They
330
encompass a region (shaded area) where repetitive firing can be achieved but may coexist 331
with quiescence (between the HB1 and SN1 lines) or plateau potential (in the narrow region
332
between the HB2 and SN2 lines). We note that the SN1 and SN2 lines merge with the HB1 and
333
HB2 lines at points B1 andB2, respectively. There, codimension-two Bautin bifurcations occur,
334
and the bifurcations HB1 andHB2 switch from subcritical to supercritical case.
335
Some important features of the diagram must be emphasized: 1) minimal values of both 336
𝐺!"# (to ensure sufficient excitability) and 𝐺!"# (to ensure proper spike repolarization) are
337
required for repetitive spiking, 2) quiescence and plateau can be clearly distinguished only 338
when they are separated by a region of repetitive spiking (see also Figure 10B for 𝐺!"#= 10 339
nS), otherwise the transition is gradual (Figure 9B for 𝐺!"#= 2.5 nS), 3) only oblique lines 340
with an intermediate slope cross the bifurcation curve and enter the RS region (see, for 341
example, the red line in Figure 10D). This means that repetitive spiking requires an 342
appropriate balance between 𝐼!"# and 𝐼!"#. If the ratio 𝐺!"#/𝐺!"# is too large (blue line) or
343
too small (gray line), only plateau potentials or quiescence will be observed at steady state. 344
he cumulative distribution This is exactly what is observed in experiments, as shown by t
345
function of the ratio 𝐺!"#/𝐺!"# for the different clusters of embryonic V1R in Figure 10E 346
(same cells as in Figure 9A). The ratio increases according to the sequence SS à RS à ME 347
à PP, with an overlap of the distributions for SS V1R and RS V1R. Note also that the ratio for 348
ME cells (around 0.25) matches the transition between repetitive spiking and plateau 349
potentials in Figure 10D (more on this below). 350
Embryonic V1R cells display voltage fluctuations of up to 5 mV, presumably due to
351
channel noise. The relatively low number of sodium and potassium channels (of the order of a 352
15 few thousands) led to voltage fluctuations in the stochastic version of our model comparable 353
to those seen experimentally when the cell was quiescent (top voltage trace in Figure 10D) or 354
when a voltage plateau occurred (bottom trace). Channel noise caused some jitter during 355
repetitive spiking (middle trace), with some occasionally missing spikes (not shown), and 356
induced clearly visible variations in the amplitude of APs. However, repetitive firing proved 357
to be very robust and was not disrupted by voltage fluctuations. Altogether, channel noise 358
little alters the dynamics (compare the deterministic voltage traces in Figure 10B and the 359
noisy traces in Figure 10D). This is likely because channel noise has a broad power spectrum 360
and displays no resonance with the deterministic solutions of the model. 361
The one-parameter bifurcation diagram of our model was not substantially modified when 362
we took 𝐼! into account, as shown in Figure 10-Figure supplement 1. It just elicited a slight 363
membrane hyperpolarization, a rightward shift of the firing threshold and a decrease of the 364
firing frequency. The transition from repetitive firing to plateau was not affected because 𝐼! is
365
inactivated by depolarization. 366
The bifurcation diagram of Figure 10D accounts qualitatively for the physiological data on 367
V1R at E12.5 presented in Figure 10A, as shown in Figure 10E where the conductance data of 368
Figure 10A were superimposed on it. Its exact position in the 𝐺!"# - 𝐺!"# plane actually 369
depends on the values of the passive parameters and it was computed in Figure 10D and F for 370
𝐺!"= 1 nS and 𝐶!"= 13 pF, the median values of the input capacitance and conductance at 371
E12.5. Between E12.5 and E14.5, 𝐶!", which provides an estimate of the cell size, increases 372
by 38% in average, whereas 𝐺!" is not significantly modified (see Figure 6). As illustrated in 373
Figure 9G the two-parameters bifurcation diagram is then shifted upward and rightward 374
compared to Figure 10F, because larger conductances are required to obtain the same firing 375
pattern. The observed regression of excitability from E12.5 to E14.5-E15.5 (see Figure 3) thus 376
comes from a decrease in 𝐺!"# density (see presumable developmental trajectories indicated 377
16 by arrow in Figure 10F) together with a shift of the RS region as cell size increases. As a 378
result, all 9 cells shown in Figure 10G are deeply inside the SS region at E14.5. 379
It is a bit trickier to explain the experiments where 4-AP changed the firing pattern of SS 380
V1R (Figure 4). This is because 4-AP decreases not only 𝐺!"# but also 𝐺!" and therefore the 381
rheobase current. If we take these modifications of the input conductance and rheobase into 382
account (Figure 10-Figure supplement 2), the bifurcation diagram remains qualitatively the 383
same, but it is shifted toward the origin in the 𝐺!"#- 𝐺!"# plane. The bifurcation lines 384
between SS and RS (SN1) and between RS and PP (SN2) are then successively crossed when 385
𝐺!"# is reduced, in accordance with experimental results. 386
387
Theoretical analysis: extended model with slow inactivation of INap
388
Our basic model accounts for the firing pattern of 73% of the 163 cells used in the cluster 389
analysis. However, bursting, under the form of recurring plateaus separated by brief 390
repolarization episodes (see a typical trace in Figure 11A left), was experimentally observed 391
in half of PP V1R (24 out of 46) and plateaus intertwined with spiking episodes were recorded 392
in the 13 cells of the ME cluster (8% of the total sample, see Figure 11A right for an example). 393
Recurrent plateaus indicate membrane bistability. This requires that the 𝐼 − 𝑉 curve be S-394
shaped, which occurs when anomalous rectification is large (large 𝐺!"# and small 𝐺!"#, 395
Figures 11B1 and 11B2). However, our basic model lacks a mechanism for switching 396
between quiescent state and plateau. Channel noise might induce such transitions, but our 397
numerical simulations showed that this is too infrequent to account for bursting (see voltage 398
trace in Figure 11B1 where the plateau state is maintained despite channel noise). 399
To explain recurrent plateaus, we incorporated a slow dynamical process, namely the 400
experimentally observed slow inactivation of 𝐼!"#, in our model. The one-parameter 401
bifurcation diagram of the basic model for 𝐺!"# = 2.5 nS is shown in Figure 11C. The
17 injected current was reduced from the value of 20 pA used in the previous section to 8 pA, so 403
as to allow for bistability (Figure 10B2). The 𝐺!"#− 𝑉 curve is then S-shaped, as shown in 404
Figure 11B1, with a bistability region for 𝐺!"# between 1.48 and 1.87 nS. This is in contrast
405
with Figure 10B where the 𝐺!"#− 𝑉 curve was monotonic. Adding the slow (de)inactivation 406
of 𝐼!"# caused periodic transitions between up (plateau) and down (quiescent) states, and the 407
model then displayed a stable limit cycle (shown in black in Figure 11C), as illustrated by the 408
top voltage trace on the right. This mechanism is known as pseudo-plateau or plateau-like 409
bursting (a.k.a. fold-subcritical HB bursting) (Teka et al 2011). It is akin to square wave 410
bursting (Bertram et al 1995, Borisyuk & Rinzel 2005, Izhikevich 2000a, Rinzel 1985), but 411
the up-state is a stable fixed point rather than a limit cycle (Osinga et al 2012, Osinga & 412
Tsaneva-Atanasova 2010, Stern et al 2008), which is why recurrent plateaus are obtained 413
rather than bursts of APs. The duration of the plateaus and repolarization episodes depends on 414
the values of 𝐺!"#, 𝐺!"# and 𝐼, but it is also largely controlled by the inactivation kinetics. A 415
voltage-independent time constant 𝜏! leads to up and down states of comparable durations
416
(see top voltage trace in Figure 11C), the duration of which increases with 𝜏!. Making 417
𝜏! voltage-dependent changes the relative durations of plateaus and repolarization episodes. If 418
𝜏! decreases with membrane voltage, for instance, repolarization episodes are shortened 419
(bottom voltage trace). Adding channel noise preserves bursting but introduces substantial 420
randomness in the duration of plateaus and repolarization episodes (middle voltage trace). We 421
also noted that adding the 𝐼! current lengthened the repolarizing phase (Figure 10-Figure 422
supplement 1). 423
inactivation of INap also provides an explanation for mixed patterns, where plateaus
Slow 424
alternate with spiking episodes (Figure 11A, right). They take place in our model near the 425
transition between repetitive spiking and plateau, as in experiments (Figure 10A). Slow 426
18 inactivation (𝑉! = -30 mV, 𝑘! = -5 mV) can lead to elliptic bursting (Izhikevich 2000b, Su et 427
al 2004) when the bifurcation HB2 is subcritical and located near the Bautin bifurcation B2,
428
which is the case here (Figure 10D). The model then displays a stable limit cycle with 429
alternating plateaus and spiking episodes, arising from crossing the bifurcation points HB2
430
and SN2 back and forth (see bifurcation diagram in Figure 11D and top voltage trace). We
431
note that sufficient deinactivation of 𝐼!"# for triggering a new plateau is difficult to be 432
achieved during spiking episodes, because voltage oscillates over a large range and variations 433
of the inactivation level are largely averaged out. Therefore, we had to choose a shallower 434
inactivation curve than for pseudo-plateau bursting together with a more depolarized half-435
inactivation voltage to achieve elliptic bursting. Otherwise, the model keeps on spiking 436
repetitively without returning to the plateau state. This is probably why it is difficult in many 437
recorded cells to elicit plateaus by increasing the injected current, an experimental 438
observation that was not explained by our basic model. 439
When 𝜏! is voltage-dependent and small enough in the subthreshold voltage range, there is 440
not enough time for APs to be fired between plateaus (see bottom voltage trace in Figure 441
11D). One then observes successive plateaus with superimposed voltage oscillations that 442
decay at plateau onset and grow at offset. Both types of plateaus, with voltage oscillations 443
(elliptic bursting) and without (pseudo-plateau bursting) were observed in the embryonic V1R 444
we recorded. Finally, we note that bistability between plateau and repetitive spiking is not 445
necessary for elliptic bursting, which may also be due to the slow passage through HB2 when
446
this Hopf bifurcation is supercritical (Baer et al 1989, Holden & Erneux 1993). Slow 447
inactivation of 𝐼!"# then leads to a delayed destabilization of the plateau after HB2 is crossed,
448
while deinactivation during repetitive spiking leads to the crossing of HB2 in the opposite
449
direction and a delayed restabilization of the plateau (not shown). 450
19 Altogether, our study shows that a model incorporating the slow inactivation of 451
𝐼!"# accounts for all the firing patterns displayed by cells of the PP and ME clusters. 452
453
4-AP increased GABAergic inputs on MNs at E12.5 454
During SNA, MNs receive massive inputs from GABAergic INs and, to a lesser extent, 455
from glutamatergic INs. This leads to the occurrence of Giant Depolarizing Potential (GDPs) 456
(Czarnecki et al 2014). V1R are likely the first INs to release GABA at E12.5 (Boeri et al 457
2018). However, it is unclear how the heterogeneity of the activity patterns observed in V1R
458
shapes GABA-evoked current in MNs, even though 𝐼!"# appears essential for the occurrence 459
of GDPs and SNA in the SC at E12.5 (Boeri et al 2018). To address this issue, we took 460
advantage of the ability of 4-AP to change the activity pattern of V1R. We focused our 461
analysis on the evoked GABAergic Giant Inward Currents (GICs) (voltage clamp recordings; 462
𝐸!" = -30 mV) and GABAergic GDPs (current clamp recordings). GICs and GDPs were
463
induced by a 1 ms stimulation applied at the cervical level of the SC while recording lumbar 464
MNs (Figure 12A) in the presence of the broad-spectrum glutamate receptor antagonist 465
kynurenic acid (4 mM). At E12.5, 4-AP increased the amplitude of GABAergic GICs (155 ± 466
86 pA vs 191 ± 112 at 30 µM, and 206 ± 115 pA at 300 µM, n = 6) and the GICs half-width 467
(0.57 ± 0.28 s vs 1.01 ± 0.34 s at 30 µM, and 1.32 ± 0.34 s at 300 µM, n = 6) (Figures 12 B1 468
and B2). When analyzing GDPs, we observed a strong increase of their half-width in the 469
presence of 4-AP (1.9 ± 0.4 s vs 3.8 ± 1.3 s at 30 µM, and 3.6 ± 1.1 s at 300 µM, n = 8) but no 470
significant change in their amplitude (30.5 ± 7.2 mV vs 32.6 ± 6.4 mV at 30 µM and 33.4 ± 471
7.2 mV at 300 µM, n = 8), nor in the firing rate of MNs (Figures 12 C1 and C2). Increasing 472
the proportion of GABAergic INs that sustain repetitive firing or plateau potential activity 473
likely enhances the release of GABA on MNs as exemplified by the increased evoked 474
GABAergic current on MNs. However, the lack of effects on GDP amplitude and on MN 475
20 firing indicates that the biophysical properties of MNs buffer variations in the intensity of 476
their GABAergic inputs. This is likely due to a combination of the depolarized equilibrium 477
potential of chloride at this embryonic age (ECl = -30 mV; (Allain et al 2011)) and the 478
relatively high input resistance of E12.5 MNs (0.3-1 GΩ) (Czarnecki et al 2014)), allowing 479
relatively small changes in GABAergic conductance to evoke a voltage response with 480
maximum amplitude. Such a process probably contributes to the robustness of MN activity 481
during episodes of SNA. 482
21
Discussion
483
V1R constitute a homogeneous population in terms of their transcription factor program 484
during development (Benito-Gonzalez & Alvarez 2012, Stam et al 2012), their physiological 485
function (Eccles et al 1956) and their firing pattern at postnatal stages (Bikoff et al 2016). 486
Surprisingly, our electrophysiological recordings and our cluster analysis clearly indicate that 487
distinct functional classes of V1R are transiently present during development at the onset of 488
the SNA (E11.5-E12.5). Five different groups of embryonic V1R were defined using cluster 489
analysis, according to their firing properties. 490
491
Development of the firing pattern of embryonic V1R during SNA 492
It is generally assumed that, during early development, newborn neurons cannot sustain 493
repetitive firing (Pineda & Ribera 2010, Spitzer et al 2000). Later on, neurons progressively 494
acquire the ability to fire repetitively, APs become sharper, and neurons eventually reach their 495
mature firing pattern, due to the progressive appearance of a panoply of voltage-gated 496
channels with different kinetics (Moody & Bosma 2005, Pineda & Ribera 2010, Spitzer et al 497
2000). Our results challenge the general view that single spiking is a more immature form of 498
excitability (Pineda & Ribera 2010). Indeed, we show that repetitive firing and plateau 499
potentials dominated at early stages (E11.5-E12.5), single spiking prevailing only later 500
(E13.5- E16.5). 501
The different V1R firing patterns observed at E11.5-E12.5 might reflect variability in the 502
maturation level between V1R at a given developmental stage, as suggested for developing 503
MNs (Durand et al 2015, Vinay et al 2000). However, this is unlikely since V1R transiently 504
lose their ability to sustain tonic firing or plateau potential after E13.5. The heterogeneous 505
discharge patterns of V1R observed before E13.5 contrasts with the unique firing pattern of 506
V1R at postnatal age (Bikoff et al 2016). Accordingly, the transient functional heterogeneity 507
22 of V1R rather reflects an early initial developmental stage (E11.5-E13.5) of intrinsic 508
excitability. 509
The physiological meaning of the transient functional involution of V1R that follows, after 510
E12.5, is puzzling. To our knowledge, such a phenomenon was never described in vertebrates 511
during CNS development. So far, a functional involution was described only for inner hair 512
cells between E16 and P12 (Marcotti et al 2003a, Marcotti et al 2003b) and cultured 513
oligodendrocytes (Sontheimer et al 1989), and it was irreversible. Because most V1R cannot 514
sustain tonic firing after E12.5, it is likely that their participation to SNA is limited to the 515
developmental period before other GABAergic interneuron subtypes mature and start to 516
produce GABA and glycine (Allain et al 2004). Interestingly, embryonic V1R begin to
517
recover their capability to sustain tonic firing when locomotor-like activity emerges (Myers et 518
al 2005, Yvert et al 2004), a few days before they form their recurrent synaptic loop with 519
MNs (around E18.5 in the mouse embryos, (Sapir et al 2004)). One possible function of the 520
transient involution between E12.5 and E15.5 could be to regulate the growth of V1R axons 521
toward their targets. It is indeed known that low calcium fluctuations within growth cones are 522
required for axon growth while high calcium fluctuations stop axon growth and promote 523
growth cone differentiation (Henley & Poo 2004). 524
525
Ion channels mechanisms underlying the functional heterogeneity of embryonic V1R 526
Blockade of 𝐼!"# leads to single spiking (Boeri et al 2018), which emphasizes the
527
importance of this current for the occurrence of repetitive firing and plateau potentials in V1R 528
at early development stages. But these neurons can also switch from one firing pattern to 529
another, when 𝐺!"# is decreased by 4-AP, which emphasizes the importance of 𝐼!"#. We
530
found that the main determinant of embryonic V1R firing pattern is the balance between 531
𝐺!"# and 𝐺!"#. 532
23 A Hodgkin-Huxley-like model incorporating a persistent sodium current 𝐼!"# provided a 533
parsimonious explanation of all the firing patterns recorded in the V1R population at E12.5, 534
even in details. It provided a mathematical interpretation for the clustering of embryonic V1R
535
shown by the hierarchical analysis and accounted for the effect of 4-AP and riluzole (Boeri et 536
al 2018) on the discharge. Remarkably, it highlights how a simple mechanism involving only 537
the two opposing currents 𝐼!"# and 𝐼!"# can produce functional diversity in a population of 538
developing neurons. The model explains why minimal 𝐺!"# and 𝐺!"# are required for firing, 539
how a synergy between 𝐺!"# and 𝐺!"# controls the firing pattern, and it accounts for the 540
zonation of the 𝐺!"#− 𝐺!"# plane that is observedexperimentally. 541
Adding the slow inactivation of 𝐼!"# to the model allowed us to account for the bursting 542
patterns displayed by cells of the PP and ME clusters. We showed, in particular, that mixed 543
events arose from elliptic bursting at the repetitive spiking-plateau transition and that smooth 544
repetitive plateaus could be explained by a pseudo-plateau bursting mechanism (Osinga & 545
Tsaneva-Atanasova 2010, Teka et al 2011). Such bursting scenario has been previously 546
studied in models of endocrine cells (Stern et al 2008, Tagliavini et al 2016, Tsaneva-547
Atanasova et al 2010) and adult neurons (Oster et al 2015), but rarely observed in experiments. 548
Heterogeneity of the discharge pattern of pacemaker neurons has also been observed in the 549
embryonic pre-Bötzinger network (Chevalier et al 2016). However, it is related there to the 550
gradual change of balance between two inward currents, 𝐼!"# and the calcium-activated
551
nonselective cationic current 𝐼!"#, during neuronal maturation, which leads to the progressive 552
replacement of pseudo-plateau bursting by elliptic bursting. Such a scenario cannot account 553
for the variety of discharge patterns observed in embryonic V1R at the E11.5-12.5 stage of
554
development (Boeri et al 2018). Our theoretical analysis and our experimental data clearly 555
indicate that competition and synergy between two opposing currents are necessary to explain 556
all the firing patterns of V1R. We also note that our model is not restricted to embryonic V1R, 557
24 but may also apply to any electrically compact cell, the firing activity of which is dominated 558
by sodium and delayed rectifier potassium currents. This is the case of many classes of 559
embryonic cells in mammals at an early stage of their development. 560
Altogether our experimental and theoretical results provide a global view of the 561
developmental trajectories of embryonic V1R (see Figures 9F and 9G). At E12.5,
562
conductances of embryonic V1R are widely spread in the 𝐺!"#− 𝐺!"# plane, which explains 563
the heterogeneity of their firing patterns. This likely results from the random and uncorrelated 564
expression of sodium and potassium channels from cell to cell at this early stage. Between 565
E12.5 and E14.5-15.5 cell size increases, and 𝐺!"# with it, while the density of sodium 566
channels decreases (see Figures 6 and 9). The functional involution displayed by V1R between 567
E12.5 and E15.5 thus mainly results from a decrease of 𝐺!"# coordinated with an increase of
568
𝐺!"#. How these synergistic processes are controlled during this developmental period 569
remains an open issue. 570
571
Physiological implications of the 𝑮𝑵𝒂𝒑 - 𝑮𝑲𝒅𝒓 synergy in V1R at the onset of the SNA 572
The increase in GABA-ergic GIC amplitude and duration in the presence of 4-AP suggests 573
that 4-AP, by changing the 𝐺!"# /𝐺!"# ratio and the input conductance increases embryonic 574
V1R excitability, which in turn augments GABA release onto MNs. This fits with the view 575
according to which repetitive firing is more efficient than single spiking at evoking calcium 576
entry and promoting vesicular release at presynaptic terminals, plateau potentials being even 577
more efficient (Hallermann & Silver 2013, Tibbs et al 1989, Wang & Kaczmarek 1998). It 578
must however be noted that although 4-AP increased GDP duration, this potassium blocker 579
had little effect on GDP amplitude and on MN firing, indicating that MN activity is poorly 580
affected by variations in GABA release. This can be explained by the depolarized equilibrium 581
potential of chloride ions at this developmental age (-30 mV) (Delpy et al 2008) and by the 582
25 high input resistance of MNs, which limits the number of activated GABAA receptors needed
583
for generating a GDP of maximal amplitude. In addition, most MNs are not able to sustain 584
tonic firing during a GDP at E12.5 (Czarnecki et al 2014), which prevents increase in GDP 585
duration from increasing MN firing rate. 586
Due to their functional involution V1R must become less efficient to generate GABAergic
587
GICs on MNs after E12.5. However, this is unlikely to impact SNA on MNs since V1R loose 588
their ability to sustain tonic firing at a time when other interneurons begin to produce GABA 589
(Allain et al 2011). We cannot completely rule out that some other INs than V1R were also 590
affected by 4-AP application already at E12.5, but it is important to note that V1R are the first 591
INs contacting MNs and producing GABA at this age in the embryonic SC (Boeri et al 2018), 592
which makes them the best candidates to explain the effect of 4-AP. 593
Our model is not restricted to embryonic V1R. It may also apply to any electrically 594
compact cell or to the axon initial segment where 𝐺!"# and 𝐺!"# play a major role in the 595
occurrence of repetitive firing (Kole & Stuart 2012). It is noteworthy that, even though the 596
nature of the firing pattern is determined only by the synergy of 𝐺!"# and 𝐺!"# in our model,
597
its quantitative features also depend on the input conductance. This implies that changes in 598
Ginput evoked by local synaptic activity may alter the firing pattern of the postsynaptic neurons.
599
Interestingly, the initial segment of cortical and hippocampal pyramidal neurons receive 600
GABAergic inputs (Kole & Stuart 2012). 601
602
Conclusions 603
In conclusion, our results indicate for the first time that a single mechanism involving two 604
classes of ubiquitous voltage-gated channels with opposite functions that are ubiquitous in 605
neurons is sufficient to produce functional diversity between neurons. It accounts for the 606
26 unusual developmental pattern of immature V1R during the important time window where 607
SNA is expressed in the embryonic spinal cord. 608
27 609
Materials and Methods
610Isolated spinal cord preparation. 611
Experiments were performed in accordance with European Community guiding principles 612
on the care and use of animals (86/609/CEE, CE Off J no. L358, 18 December 1986), French 613
decree no. 97/748 of October 19, 1987 (J Off République Française, 20 October 1987, pp. 614
12245-12248). All procedures were carried out in accordance with the local ethics committee 615
of local Universities and recommendations from the CNRS. We used GAD67eGFP knock-in 616
mice to visualize putative GABAergic INs (Tamamaki et al 2003), as in our previous study 617
(Boeri et al 2018). To obtain E12.5-E16.5 transgenic GAD67-eGFP embryos, 8 to 12 weeks 618
old wild-type Swiss female mice were crossed with GAD67-eGFP Swiss male mice. 619
Isolated mouse SCs from 420 embryos were used in this work and obtained as previously 620
described (Delpy et al 2008, Scain et al 2010). Briefly, pregnant mice were anesthetized by 621
intramuscular injection of a mix of ketamine and xylazine and sacrificed using a lethal dose of 622
CO2 after embryos of either sex were removed. Whole SCs were isolated from eGFP-positive
623
embryos and maintained in an artificial cerebrospinal fluid (ACSF) containing 135 mM NaCl, 624
25 mM NaHCO3, 1 mM NaH2PO4, 3 mM KCl, 11 mM glucose, 2 mM CaCl2, and 1 mM
625
MgCl2 (307 mOsm/kg H2O), continuously bubbled with a 95% O2-5% CO2 gas mixture.
626
In the lumbar SC of GAD67eGFP mouse embryos, eGFP neurons were detected using 488 627
nm UV light. They were localized in the ventro-lateral marginal zone between the motor 628
columns and the ventral funiculi (Stam et al 2012). Embryonic V1R identity was confirmed by 629
the expression of the forkhead transcription factor Foxd3 (Boeri et al 2018). 630
631
Whole-cell recordings and analysis 632
The isolated SC was placed in a recording chamber and was continuously perfused (2 633
28 ml/min) at room temperature (22-26°C) with oxygenated ACSF. Whole-cell patch-clamp 634
recordings of lumbar spinal embryonic V1R were carried out under direct visualization using 635
an infrared-sensitive CCD video camera. Whole-cell patch-clamp electrodes with a resistance 636
of 4-7 MΩ were pulled from thick-wall borosilicate glass using a P-97 horizontal puller 637
(Sutter Instrument Co., USA). They were filled with a solution containing (in mM): 96.4 K 638
methanesulfonate, 33.6 KCl, 4 MgCl2, 4 Na2ATP, 0.3 Na3GTP, 10 EGTA, and 10 HEPES
639
(pH 7.2; 290 mOsm/kg-H2O). This intracellular solution led to an equilibrium potential of
640
chloride ions, 𝐸!", of about -30 mV, close to the physiological values measured at E12.5 in 641
spinal MNs (Delpy et al 2008). The junction potential (6.6 mV) was systematically corrected 642
offline. 643
Signals were recorded using Multiclamp 700B amplifiers (Molecular Devices, USA). Data 644
were low-pass filtered (2 kHz), digitized (20 kHz) online using Digidata 1440A or 1550B 645
interfaces and acquired using pCLAMP 10.5 software (Molecular Devices, USA). Analyses 646
were performed off-line using pCLAMP 10.5 and Axograph 1.7.2 (Molecular devices; 647
RRID:SCR_014284) software packages. 648
In voltage-clamp mode, voltage-dependent K+ currents (𝐼!") were elicited by 500 ms 649
depolarizing voltage steps (10 mV increments, 10 s interval) after a prepulse of 300 ms at 𝑉! 650
= -100 mV. To isolate 𝐼!"#, voltage steps were applied after a 300 ms prepulse at 𝑉! = -30 651
mV that inactivated the low threshold transient potassium current 𝐼!. 𝐼! was then obtained by 652
subtracting offline 𝐼!"# from the total potassium current 𝐼!". Capacitance and leak current
653
were subtracted using on-line P/4 protocol provided by pCLAMP 10.5. 654
In current-clamp mode, V1R discharge was elicited using 2 s depolarizing current steps 655
(from 0 to ≈ 50 pA in 5-10 pA increments, depending on the input resistance of the cell) with 656
an 8 s interval to ensure that the membrane potential returned to 𝑉!. When a cell generated a 657
29 sustained discharge, the intensity of the depolarizing pulse was reduced to the minimal value 658
compatible with repetitive firing. 659
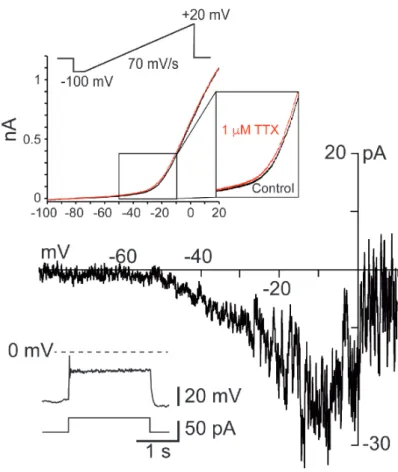
𝐼!"# was measured in voltage-clamp mode using a 70 mV/s depolarizing voltage ramp 660
(Huang & Trussell 2008). This speed was slow enough to preclude substantial contamination 661
by the inactivating transient current and fast enough to avoid substantial inactivation of 𝐼!"#.
662
Subtraction of the current evoked by the voltage ramp in the presence of 1 µM tetrodotoxin 663
(TTX) from the control voltage ramp-evoked current revealed 𝐼!"#. 664
665
Pharmacological reagents 666
During patch-clamp recordings, bath application of TTX (1 µM, Alomone, Israel) or 4-AP 667
(0.3 - 600 µM, Sigma) was done using 0.5 mm diameter quartz tubing positioned, under direct 668
visual control, 50 µm away from the recording area. The quartz tubing was connected to 6 669
solenoid valves linked with 6 reservoirs via a manifold. Solutions were gravity-fed into the 670
quartz tubing. Their application was controlled using a VC-8 valve controller (Warner 671
Instruments, USA). 672
4-aminopyridine (4-AP; Sigma Aldrich, USA) was used to block 𝐼!"#. To determine the
673
concentration–response curve, 𝐼 − 𝑉 curves of 𝐼!"# for different concentrations of 4-AP (0.3
674
to 300 µM) were compared to the control curve obtained in the absence of 4-AP. The 675
percentage of inhibition for a given concentration was calculated by dividing the peak 676
intensity of 𝐼!"# by the peak value obtained in control condition. The obtained normalized 677
concentration–response curves were fitted using the Hill equation: 678
!""!!!"#
!!([!!!"]/!"!")!!+ 𝐼!"# ,
679
where [4-AP] is the 4-AP concentration, 𝐼!"# is the residual current (in percentage of the peak 680
𝐼!"#), 100 − 𝐼!"# is the maximal inhibition achieved for saturating concentration of 4-AP, 681
30 𝐼𝐶!" is the 4-AP concentration producing half of the maximal inhibition, and 𝑛! is the Hill 682
coefficient. Curve fitting was performed using KaleidaGraph 4.5 (Synergy Software, USA). 683
684
Immunohistochemistry and confocal microscopy 685
E14.5 embryos were collected from pregnant females. Once dissected out of their yolk sac, 686
SCs were dissected and immediately immersion-fixed in phosphate buffer (PB 0.1 M) 687
containing 4% paraformaldehyde (PFA; freshly prepared in PB, pH 7.4) for 1 h at 4°C. Whole 688
SCs were then rinsed out in 0.12 M PB at 4°C, thawed at room temperature, washed in PBS, 689
incubated in NH4Cl (50 mM), diluted in PBS for 20 min and then permeabilized for 30 min in
690
a blocking solution (10% goat serum in PBS) with 0.2% Triton X-100. They were incubated 691
for 48 h at 4°C in the presence of the following primary antibodies: guinea pig anti-FoxD3 692
(1:5000, gift from Carmen Birchmeier and Thomas Müller of the Max Delbrück Center for 693
Molecular Medicine in Berlin) and rabbit anti-cleaved Caspase-3 (1:1000, Cell Signaling 694
Technology Cat# 9661, RRID:AB_2341188). SCs were then washed in PBS and incubated 695
for 2 h at RT with secondary fluorescent antibodies (goat anti-rabbit-conjugated 649; donkey 696
anti-guinea pig-conjugated Alexa Fluor 405 [1:1000, ThermoFisher]) diluted in 0.2% Triton 697
X-100 blocking solution. After washing in PBS, SCs were dried and mounted in Mowiol 698
medium (Millipore, Molsheim, France). Preparations were then imaged using a Leica SP5 699
confocal microscope. Immunostaining was observed using a 40X oil-immersion objective 700
with a numerical aperture of 1.25, as well as with a 63X oil-immersion objective with a 701
numerical aperture of 1.32. Serial optical sections were obtained with a Z-step of 1 µm (40X) 702
and 0.2-0.3 µm (63X). Images (1024x1024; 12-bit color scale) were stored using Leica 703
software LAS-AF and analyzed using ImageJ 1.5 (N.I.H., USA; http//rsb.info.nih.gov/ij/) and 704
Adobe Photoshop CS6 (Adobe, USA) software. 705