Biophysical Characterization of Fluorotyrosine
Probes Site-Specifically Incorporated into Enzymes:
The MIT Faculty has made this article openly available.
Please share
how this access benefits you. Your story matters.
Citation
Oyala, Paul H. et al. “Biophysical Characterization of Fluorotyrosine
Probes Site-Specifically Incorporated into Enzymes: E. Coli
Ribonucleotide Reductase As an Example.” Journal of the American
Chemical Society 138, 25 (June 2016): 7951–7964 © 2016 American
Chemical Society
As Published
http://dx.doi.org/10.1021/JACS.6B03605
Publisher
American Chemical Society (ACS)
Version
Final published version
Citable link
http://hdl.handle.net/1721.1/116383
Terms of Use
Article is made available in accordance with the publisher's
policy and may be subject to US copyright law. Please refer to the
publisher's site for terms of use.
Biophysical Characterization of Fluorotyrosine Probes
Site-Speci
fically Incorporated into Enzymes: E. coli Ribonucleotide
Reductase As an Example
Paul H. Oyala,
†Kanchana R. Ravichandran,
‡Michael A. Funk,
‡Paul A. Stucky,
†Troy A. Stich,
†Catherine L. Drennan,
*
,‡,§,∥R. David Britt,
*
,†and JoAnne Stubbe
*
,‡,§†Department of Chemistry, University of California, Davis, One Shields Avenue, Davis, California 95616, United States
‡Department of Chemistry and§Department of Biology, Massachusetts Institute of Technology, 77 Massachusetts Avenue,
Cambridge, Massachusetts 02139, United States
∥Howard Hughes Medical Institute, Massachusetts Institute of Technology, 77 Massachusetts Avenue, Cambridge, Massachusetts
02139, United States
*
S Supporting InformationABSTRACT: Fluorinated tyrosines (FnY’s, n = 2 and 3) have
been site-specifically incorporated into E. coli class Ia
ribonucleotide reductase (RNR) using the recently evolved M. jannaschii Y-tRNA synthetase/tRNA pair. Class Ia RNRs
require four redox active Y’s, a stable Y radical (Y·) in the β
subunit (position 122 in E. coli), and three transiently oxidized
Y’s (356 in β and 731 and 730 in α) to initiate the
radical-dependent nucleotide reduction process. FnY (3,5; 2,3; 2,3,5;
and 2,3,6) incorporation in place of Y122-β and the X-ray
structures of each resultingβ with a diferric cluster are reported
and compared with wt-β2 crystallized under the same
conditions. The essential diferric-FnY· cofactor is self-assembled
from apo FnY-β2, Fe2+, and O
2to produce∼1 Y·/β2 and ∼3 Fe3+/β2. The FnY· are stable and active in nucleotide reduction with
activities that vary from 5% to 85% that of wt-β2. Each FnY·-β2 has been characterized by 9 and 130 GHz electron paramagnetic
resonance and high-field electron nuclear double resonance spectroscopies. The hyperfine interactions associated with the19F
nucleus provide unique signatures of each FnY· that are readily distinguishable from unlabeled Y·’s. The variability of the abiotic
FnY pKa’s (6.4 to 7.8) and reduction potentials (−30 to +130 mV relative to Y at pH 7.5) provide probes of enzymatic reactions
proposed to involve Y·’s in catalysis and to investigate the importance and identity of hopping Y·’s within redox active proteins
proposed to protect them from uncoupled radical chemistry.
■
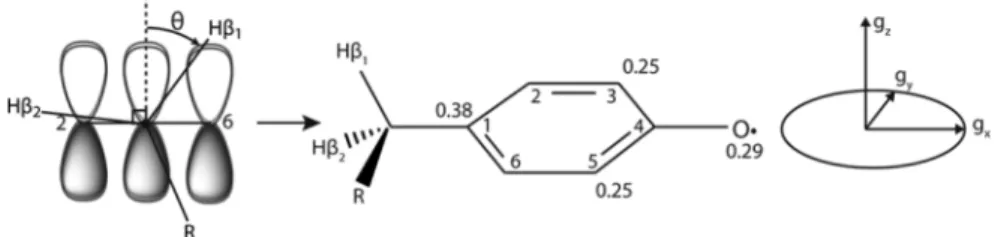
INTRODUCTIONFnY’s (Figure 1) have long been used to probe enzyme reaction
mechanisms, protein environmental perturbation of pKa’s, and
protein structures in biology.1−3Prime examples of the former
can be found in recent studies on ketosteroid isomerase, which
has three Y’s and conserved waters in its active site
environment with one Y with a pKa of 6.3,4,5 and protein Y
kinases in which the Y pKa within a polypeptide substrate is
perturbed and the rate of its phosphorylation is examined.6
3-Fluorotyrosine (3-FY) has been incorporated into the oxygen evolving core complex of photosystem II to probe the mechanism of proton-coupled electron transfer (PCET)
operative in YZoxidation to YZ· over a broad pH range.7 The
high sensitivity of NMR analysis to the 19F nucleus, in
conjunction with its large window and sensitivity to
environ-ment,8 have been used extensively to study conformational
changes in proteins and the interaction of proteins with other
biological molecules.9 Recent technology has allowed
site-specific incorporation of FnY (n = 2 or 3,Figure 1) into any
protein of interest.10−12 In our case, an evolved polyspecific
Received: April 7, 2016
Published: June 8, 2016 Figure 1.Unnatural amino acids (UAAs) utilized in this study.ΔEp
represents the potential difference vs the Y·/Y couple at pH 7.5 as determined by differential pulse voltammetry (DPV) studies performed on the N-acetylfluoro-L-tyrosinamides.8
Article
pubs.acs.org/JACS
copying and redistribution of the article or any adaptations for non-commercial purposes.
Downloaded via 18.101.8.129 on June 15, 2018 at 17:14:06 (UTC).
tRNA synthetase (RS) was used.10These FnY’s have played an important role in studying the mechanism of the 35 Å radical transfer in the E. coli ribonucleotide reductase (RNR), a process
which involves one stable and three transient Y·’s (Figure
S1).13−17In this manuscript we report the general method of
FnY insertion into proteins using the smallβ2 subunit of RNR
as an example and the characterization of each FnY-β2 by X-ray
crystallography and of each oxidized FnY· by multifrequency
electron paramagnetic resonance (EPR) and electron nuclear double resonance (ENDOR) spectroscopy methods. This work provides the foundation for others to use these tools to investigate enzyme mechanisms proposed to involve stable or
transient Y·’s in their catalytic mechanism18−23or to determine
if hole hopping through Y and W chains protect redox active
proteins from oxidative damage.24−26
RNRs catalyze the conversion of nucleotides to
deoxynu-cleotides in all organisms (Scheme 1).27−29 Although the
mechanism of nucleotide reduction is conserved, the mechanism by which the complex radical reaction is initiated
is dependent on the metallo-cofactor.30The class I RNRs are
composed of two subunits,α and β, which in E. coli form an
activeα2β2 complex. A Y· in the β subunit is used to oxidize
the active site cysteine to a thiyl radical in theα subunit. This
oxidation occurs over a very long distance and involves a
specific pathway (Figure S1).13,16,31Since in the best studied E.
coli RNR, the rate-limiting step is a conformational change that
masks all the chemistry,32 altering this step by a variety of
methods has been crucial to our current understanding of this process. The most successful approach has been to use the suppressor tRNA/RS methodology to incorporate Y analogs in
place of four Y’s in the pathway.10,17,33−36Recently we evolved
an RS to incorporate (2,3,5)F3Y and found that it was
polyspecific; i.e., it was able to incorporate a variety of FnY’s
(Figure 1).10 These FnY’s have been shown to have peak
potentials (Ep’s) that range from 30 mV easier to oxidize than Y
to 130 mV harder to oxidize at pH 7.5 in addition to having
altered pKa’s. These perturbations are ideal for investigating the
multistep redox chemistry that involves a number of PCET steps, required to initiate nucleotide reduction. In the original
paper, we also demonstrated that when the stable Y122· in β2 is
replaced with (2,3,5)F3Y, it could be oxidized to the
(2,3,5)F3Y·.10 The electron paramagnetic resonance (EPR)
spectrum of this radical exhibited hyperfine features at the
low-field and high-low-field sides of the spectrum associated with the19F
(I = 1/2) nucleus that allowed detection of this radical even in
the presence of overlapping unlabeled Y· signals. From these
early studies and the chemical properties of the FnY’s
themselves,8 it was clear that these compounds (Figure 1)
might provide a useful tool to study enzymatic mechanisms
involving stable and transient Y·’s.
In this paper we report the general optimized methodology
for incorporation of these FnY’s in place of Y122inβ2. We also
report the methodology used to generate each FnY· at this
position, taking advantage of self-assembly of the essential
diferric-Y· cofactor subsequent to the addition of Fe2+, O2and
reductant to apo-β2 or its assembly during recombinant
expression. A potential issue with the asymmetric FnY’s (2, 3,
4,Figure 1) is whether they adopt multiple conformations inβ2 either during the folding process or due to rotation around the
Cβ-Cγ bond. The structures of FnY-β2 and FnY· have been
determined by X-ray crystallography and multifrequency EPR and ENDOR methods, respectively. The results support a
model where the fluorine substitution minimally perturbs the
overall protein conformation ofβ2, although in several cases,
multiple conformers of the FnY itself are observed by both
paramagnetic and crystallographic methods. The EPR spectra of each of the radicals, the simulation of these spectra, and the
calculated spin density are reported and reveal the detailed19F
hyperfine parameters. In conjunction with the range of
reduction potentials spanned by these analogs (Figure 1),8,37
this information will be generally useful to investigate redox
active Y’s reported in a number of metabolically important
enzymes.
■
MATERIALS AND METHODSMaterials. (His)6 wt-α2 (specific activity −2600 nmol/min/mg)
was expressed from pET28a-nrdA and purified using the standard laboratory protocol.34 Tyrosine phenol lyase38 and FnY’s39 were
isolated as previously described. E. coli thioredoxin (TR, 40 U/mg) and thioredoxin reductase (TRR, 1400 U/mg) were purified following previously published methods.40,41 [3H] CDP was obtained from
ViTrax (Placentia, CA). Roche provided the calf alkaline phosphatase (20 U).
General Method for Incorporation of FnY’s into β2 of E. coli RNR. Expression and Purification of FnY-β2. E. coli TOP10
chemically competent cells were transformed with pBAD-nrdB122TAG
and pEVOL-FnYRS-E310 and grown at 37 °C on LB-agar plates
containing 100μg/mL ampicillin (Amp) and 35 μg/mL chloramphe-nicol (Cm). A single colony was used to inoculate a starter culture (5 mL) that was grown until saturation (37°C, 12−16 h). This culture was diluted 100-fold into fresh 2xYT medium supplemented with Amp and Cm. After 16 h at 37°C, the culture was diluted 100-fold into 4 × 2 L of 2xYT containing the antibiotics and variable concentrations of FnY (0.5 mM (3,5)F2Y, 0.7 mM (2,3,5)F3Y, 1.5 mM (2,3)F2Y, or 1.5
mM (2,3,6)F3Y). FnYRS and nrdB were both induced at an OD600of
0.6 with 0.05% (w/v)L-arabinose. In the case of (2,3,5)F3Y-β2 and
(2,3,6)F3Y-β2, 100 μM o-phenanthroline was added to chelate the iron
30 min prior to induction withL-arabinose. In all cases, growth was continued for an additional 5 h and the cells were harvested by centrifugation (3500g, 15 min). Apo (2,3,5)F3Y-β2 and (2,3,6)F3Y-β2
and holo (3,5)F2Y-β2 and (2,3)F2Y-β2 constructs were isolated by
anion-exchange chromatography as previously described.42
General Methods To Assemble the Diferric-FnY· Cofactor in β2. Chelation of Iron from Holo (3,5)F2Y-β2 and (2,3)F2Y-β2.
As-isolated (3,5)F2Y-β2 and (2,3)F2Y-β2 were deoxygenated and taken
into an anaerobic chamber (4°C). Solid sodium dithionite (Na2S2O4)
and methyl viologen (MV) were also taken into the chamber where stock solutions of each (400 mM and 11 mM respectively) were prepared in 50 mM N-2-hydroxyethylpiperazine-N′-ethanesulfonic acid (HEPES) pH 7.6, 5% glycerol. Na2S2O4and MV were added to
the protein atfinal concentrations of 20 mM and 110 μM, respectively. The resulting blue solution was stirred in the anaerobic chamber for 1 h prior to addition of ferrozine (final concentration 20 mM). The purple mixture was taken out of the chamber, and the (ferrozine)3Fe
Scheme 1. Reaction Catalyzed by RNRa
aA pair of cysteines in the active site ofα2 are oxidized to a disulfide
on each turnover. Multiple turnovers require re-reduction of the disulfide by the thioredoxin (TR), thioredoxin reductase (TRR), NADPH system.
complex was removed by Sephadex G-25 chromatography to obtain apo (3,5)F2Y-β2 and (2,3)F2Y-β2.
Reconstitution of the Diferric-FnY· Cofactors. Apo FnY-β2s (either
isolated or generated using the protocol described above) were reconstituted as previously described.17,35After a 15 min incubation period with 5 equiv of ferrous ammonium sulfate, the iron-loaded proteins were treated with 3.5 equiv of O2in the form of O2saturated
50 mM HEPES pH 7.6, 5% glycerol. The reconstituted proteins (FnY
·-β2s) were analyzed by X-band EPR spectroscopy to quantitate the radical yield.
Kinetics of Diferric-(2,3,6)F3Y· Cluster Assembly Measured
by Rapid Freeze−Quench (RFQ) EPR Spectroscopy. The methods followed previous protocols43,44 to study Y122· formation
with wt-β2 and are described in more detail in the Supporting Information(SI).
Steady-State Activity Assays of FnY·-β2s. The specific activities of FnY·-β2s were determined by the spectrophotometric and
radioactive assays utilized for wt RNR.45,46For the spectrophotometric assay, 0.5μM FnY·-β2, 2.5 μM wt-α2, 1 mM CDP, 3 mM ATP, 30 μM
TR, 0.5μM TRR, and 0.2 mM NADPH in 50 mM HEPES pH 7.6, 15 mM MgSO4, and 1 mM EDTA were combined in a total volume of
300μL. In the case of (3,5)F2Y·-β2, the concentrations of β2 and α2
were 0.15μM and 0.75 μM respectively. The reaction was monitored for 1 min at 340 nm for consumption of NADPH. For the radioactive assays, [3H]-CDP was utilized (0.5 mM, 2000−4000 cpm/nmol) and
the amount of NADPH was increased to 1 mM. The reactions were performed in a total volume of 170μL, aliquots were quenched at different time points by heat denaturation, and the samples were worked up as previously described.46
Crystallization of FnY-β2. All β2s were prepared at 250 μM (∼21 mg/mL) in assay buffer (50 mM HEPES pH 7.6, 15 mM MgCl2, 1
mM EDTA) for crystallization. Wt-β2 was reduced with hydroxyurea47 in order to ensure all of the protein was in the met state (Y·-reduced diferric state). Initial crystallization conditions were identified for wt-β2 in 96-well, sitting drop, sparse matrix screens (Hampton Research, Qiagen) dispensed by a Phoenix pipetting robot (Art Robbins) at room temperature (∼23 °C). Optimization of the initial conditions was carried out in 24-well, hanging or sitting drop, vapor diffusion trays at room temperature. All crystallization reagents were from Hampton Research. Thefinal, optimized conditions contained 1.1 M (NH4)2SO4, 0.9−1.2 M KCl, and 0.1 M Tris pH 8.0. Protein and
precipitant were mixed in a 1:1 ratio with afinal drop volume of 2 μL. Crystals of each of the FnY-β2 variants grew in the same conditions as
identified for wt-β2 and typically appeared after 24−48 h and grew to maximum size over 1−2 weeks. Most crystals appeared as pale green hexagons or pyramids, but crystal size and morphology did not greatly influence the quality of the resulting data set. All crystals were transferred to a cryoprotection solution containing 60% saturated Li2SO4, 0.4 M KCl, 0.1 M bicine pH 8.5−9.5 for 1−3 h prior to
cryocooling by plunging in liquid N2. The length of the soak did not
alter the quality of the data set.
Data sets for FnY-β2 variants were collected at the Advanced
Photon Source beamline 24ID-C on a Pilatus 6 M detector (Dectris) or 24ID-E on a Q315 CCD detector (ASDC). The raw diffraction images for each data set have been deposited in the SBGrid Data Bank. Data were indexed in space group P6122, integrated, and scaled in
HKL200048with cell dimensions of a = b = 91 Å, c = 206 Å. A similar crystal form has been reported for the dimanganese(II)-containing E. coli β2 (PDB ID 2ALX);49 the structure was solved by molecular replacement in the Phenix implementation of Phaser50 using this structure as the search model. A singleβ monomer is found in the asymmetric unit of this crystal form with the physiological dimer generated by crystallographic symmetry. The highest resolution structure, (3,5)F2Y-β2, was rebuilt and refined first using
reciprocal-and real-space positional refinement in phenix.refine.51 Atomic displacement parameters (B factors) were optimized for each chain with translation/libration/screw refinement. Water molecules were added automatically in Coot52 and checked manually against composite omit electron density maps. The entire model was checked for geometry andfit to the density in Coot. This completed model was
used as the basis for refining the other FnY- and wt-β2 structures after
removal of the UAA.
Restraints for each FnY residue were generated in Phenix eLBOW,
and the residues were placed in Fo− Fcomit density. For (3,5)F2Y-β2,
this residue was placed into unambiguous omit density in a single conformation. The (2,3), (2,3,6), and (2,3,5)F3Y models contain some
fraction of a second orientation of the FnY, as described below. For
angle measurements, hydrogen atoms were added in PyMOL, and the dihedral angle to the ring plane (Hβ−Cβ−C1−C2/6) was measured.θ
was calculated by subtracting the dihedral to the ring plane from 90°. The final structures for all of the models were verified with composite omit electron density maps. In each case thefinal model contains residues 2−349 out of 375 and residue 1, the N-terminal methionine, is not visible in any structure. Thefinal models have been deposited in the Protein Data Bank (5CI0, 5CI1, 5CI2, 5CI3, and 5CI4). All software used for crystallographic data processing and refinement was compiled and maintained by the SBGrid consortium.53 Structuralfigures were created in PyMol (Schrödinger).
CW EPR Spectroscopy. All reconstituted FnY·-β2s were
trans-ferred to the appropriate EPR tubes and frozen in liquid N2prior to
EPR spectroscopy at a specific observation temperature. In the case of (2,3,6)F3Y·-β2 only, the sample was aged for 2 min following addition
of O2during reconstitution of the active cofactor and then frozen in
liquid N2. The reason for this aging procedure is detailed in the Results. All 9 GHz (X-band) continuous-wave (CW) EPR spectra were collected at a temperature of 80 K under slow-passage, nonsaturating conditions using a Bruker (Billerica, MA) ELEXSYS E500 X-band spectrometer equipped with an Oxford Instruments ESR900 cryostat and an ITC-503 temperature controller.
High-Field EPR Spectroscopy. All pulsed EPR and ENDOR spectroscopic studies were performed at a temperature of 30 K using a recently redesigned home-built 130 GHz EPR spectrometer (vide infra) equipped with an Oxford-CF935 liquid helium cryostat and an ITC-503 temperature controller. The spectrometer is also equipped with an 8 T cryogen-free magnet (Cryogenic Limited, UK), and all data were acquired using a TE011 mode cylindrical resonant cavity
designed and manufactured by HF EPR Instruments, Inc. (V. Krymov, New York) equipped with radio frequency (RF) coils for ENDOR.54 Spectrometer control is achieved using the SpecMan software.55 Magneticfield-swept echo-detected EPR spectra were acquired using the Hahn echo pulse sequence:π/2−τ−π−echo. The magnetic field axis for eachfield-swept spectrum was calibrated using MgO with an Mn2+ impurity (95+% fused MgO, Aldrich) with a g-value of
2.00100(5) and a 55Mn hyperfine coupling constant of −243.6(5)
MHz, as determined previously.56,57 Eachfield swept echo-detected EPR absorption spectrum was modified using a pseudomodulation function (modulation amplitude = 0.3 G) to approximate the effect of field modulation and produce the CW-like first derivative spectrum.58 RFs for Davies ENDOR experiments were generated by an HP 8656B signal generator under GPIB control, and pulses were formed by a TTL-driven Mini-Circuits (Brooklyn, NY) ZASWA-2-50DR+ RF switch. The RF pulses were then amplified by either a 300 W Bruker Blax300 RF amplifier (6−250 MHz dynamic range) or a 500 W Kalmus RF amplifier (200−330 MHz dynamic range). ENDOR spectra were acquired using the pulse sequence π−tRF−πRF−tRF−π/
2−τ−π−echo, where πRFis the optimized RF pulse length and tRFis a
fixed delay separating MW and RF pulses. ENDOR spectra spanning 80 to 250 MHz were acquired using the Blax300 amplifier with πRF=
24μs, and those spanning from 200 to 330 MHz were acquired using the Kalmus amplifier with πRF = 18 μs. The resultant spectra were
stitched together byfirst normalizing each to the most intense β-1H signal near 220 MHz and then splicing them together at 212.5 MHz to give the resultant ENDOR spectrum shown in eachfigure. The specific parameters forfield positions, microwave frequencies, and pulse and delay lengths are given in the captions of eachfigure.
The transmitter section of the microwave bridge (HF EPR Instruments, Inc., V. Krymov, New York) of our laboratory-built 130 GHz spectrometer59 was heavily modified in order to increase microwave pulse power and operational stability (Figures S2 and S3). The topology of our upgraded 130 GHz microwave transmitter is very Journal of the American Chemical Society
similar to that described in Smith et al.60As in the original bridge, a single phase-locked dielectric resonator oscillator at 7.647 GHz (output power = 20 dBm, Nexyn, Inc.) serves as the base frequency, preserving the CW EPR functionality. This base frequency is then mixed and multiplied up to 32.5 GHz and provides 0 dBm (1 mW) input power to the high-power side of the transmitter arm. The dual-channel IMPATT diode (cascaded) amplifiers of the original bridge were replaced with a single channel amplifier−multiplier chain (AMC) fabricated by Virginia Diodes, Inc., (VDI) of Charlottesville, VA. The AMC consists of a set of cascaded varactor multipliers, in our case an x2× 2 design, with a Spacek Laboratories input preamplifier and a separate power supply module. The AMC pulse output power is 23.2 dBm (210 mW) as measured by VDI at 130 GHz. A synthesizer channel (Herley-CTI XS-7314) was added so that two-frequency experiments such as DEER and EDNMR could also be conducted. Further details on these modifications to the bridge can be found in theSI(Figure S2 and Table S1).
Dealing with the Hole in the ENDOR Spectrum: Simulations and the Importance of the Suppression Effect. All spectral simulations were performed in the MATLAB 8.1.0 (R2013a) software package (The Mathworks Inc., Natick, MA) using the EasySpin 5.0.0 toolbox.61,62 A nucleus exhibiting a large anisotropic hyperfine interaction (A) will have an orientation relative to the static B0-field
at which the isotropic and anisotropic contributions to the hyperfine tensor are of equal magnitude and opposite sign. This condition leads to a cancellation of the hyperfine field for this nucleus, i.e., A = 0 for this orientation. The theoretical ENDOR spectrum of such a nucleus would possess spectral intensity at the corresponding Larmor frequency. In practice, however, the Davies ENDOR spectrum suffers from a lack of ENDOR response as the hyperfine interaction approaches zero, A→ 0. Fortunately, this behavior is easily modeled by convolving simulated ENDOR spectra by the detectability function:63 ∝ + ENDOR A t At At ( , ) 1.4( ) 0.7 ( ) p p p 2 2 (1)
where A is the hyperfine coupling in MHz and tpis the duration of the
initial microwaveπ-pulse in the Davies sequence in μs. The breadth of this blind spot is inversely proportional to the length of the initial preparation pulse.
In the case of each of the FnY· species investigated here, this
suppression effect must be taken into account in order to accurately simulate the ENDOR intensities arising from all hyperfine-coupled19F
nuclei whose A-tensors are highly anisotropic owing to the unpaired spin populating thefluorine 2pzorbital (vide infra).
Electronic Structure Calculations. All DFT calculations were performed on a desktop computer using the ORCA 2.9.1 suite of software.64 Y and FnY derivatives were approximated as the
corresponding phenol (i.e., a methyl group replaced theβ-methine and amino acid). The atomic positions were optimized for each Y· model using the unrestricted Kohn−Sham method with Becke’s three-parameter hybrid functional for exchange65,66combined with the Lee− Yang−Parr correlation functional67(B3LYP/G) using the default 20% Hartree−Fock exchange. All atoms were treated with the 6-31G*(d,p) basis set,68and all computations were completed using a polarizable solvent dielectricfield (ε = 10 D).69,70The size of the integration grid used in all cases was 5.
Single-point calculations on the converged geometries were performed with the hybrid functional B3LYP using Barone’s EPRII basis set71on all atoms. EPR properties were computed using coupled-perturbed self-consistentfield (CP-SCF) theory with the origin of the gauge dependence set at the center of electronic charge.72
■
RESULTSExpression and Purification of FnY-β2. FnY-β2s were
expressed from the pBAD-nrdB122TAG and pEVOL-FnYRS-E3
plasmids.10The effect of the concentration of FnY and media
pH to optimize FnY uptake into cells, and the induction time
for protein production were examined in an effort to maximize
the yield of each full length FnY-β2. The optimized yields for
(3,5) and (2,3,5)F3Y-β2 were obtained with 0.5−0.7 mM FnY,
whereas for (2,3) and (2,3,6)F3Y-β2, the concentrations were
1.5 mM. The pH had minimal effect in all cases and induction
of FnY-β2 at an OD600 of 0.6 followed by 4−5 h of growth,
proved optimal for protein expression.
Isolation of FnY·-β2 with high yields of FnY· required
extensive experimentation and the results are summarized in
Table S2. In the case of (2,3,5) and (2,3,6)F3Y-β2 expression
was carried out in the presence of 100μM o-phenanthroline in
the growth media prior to protein induction17 as well as
inclusion of o-phenanthroline in the lysis buffer prior to
purification of the apo protein. On the other hand, (3,5) and
(2,3)F2Y-β2 were expressed and purified in the holo form, with
addition of ferrous ammonium sulfate to crude cell extracts. By
this protocol, the concentrations of the (3,5) and (2,3)-F2Y·
were low and consequently, subsequent to purification, the iron
was removed from these proteins with dithionite, MV and
ferrozine.73,74In each case, the resulting apo protein was then
reconstituted with 5 equiv of FeIIand 3.5 equiv. O2(at 4°C),
the standard protocol for wt-β2.44Although the basis for the
requirement for distinct optimization procedures remains
unclear, in all cases the FnY·-β2 had ∼3 Fe/β2 and ∼1 FnY·/
β2 (Table S2).
Stability of FnY·’s and Evidence for Multiple
Con-formations of (2,3,6)F3Y·. The stability of Y122· in wt-β2 is
∼4 days at 25 °C,75
whereas that of the nitrotyrosyl radical
(NO2Y·), a much stronger oxidant, was recently found to be
only 40 s.35X-band EPR spectroscopy was used to assess the
stability of FnY· in each β2 at 20 s, 2.5 min, and 20 min
subsequent to cluster assembly. No changes in the total spin or
the spectrum appearance were observed for any of the FnY·-β2s
except for (2,3,6)F3Y·-β2. In this case, 40% spin loss was
observed by 2 min (0.7 FnY·/β2).
To investigate the basis for this observation with one
possibility being that the asymmetric fluorine distribution on
the aromatic ring results in multiple (2,3,6)F3Y· conformations
during the protein folding process, the assembly of the diferric
(2,3,6)F3Y· was studied in more detail by RFQ-EPR
spectros-copy (Figure S4). The spectra between 23 and 256 ms (Figure
S4A−C) reveal that intermediate X, the Fe3+/Fe4+ core
responsible for the oxidation of Y to Y·, is completely formed
within 23 ms and that it had disappeared within 256 ms. The
256 ms time point showed 1.2 F3Y·/β2 (Figure S4C), which
decayed to 0.7 F3Y·/β2 over the subsequent 60 s and then
remained unchanged (Figure S4D). Our current model to
explain this observation is that (2,3,6)F3Y· exists in at least two
distinct conformations generated duringβ2 folding. One gives
rise to a rapidly decaying radical, whereas the other results in a radical that is substantially stabilized. All EPR data discussed
subsequently were collected on the “stable” (2,3,6)F3Y·.
Although, we have not investigated the reconstitution of the
other FnY·-β2s by RFQ-EPR spectroscopy, no spin loss was
observed with any of them up until 2−3 h after reconstitution
or with multiple freeze−thaw cycles.
Steady-State Activity of FnY·-β2s. Subsequent to
optimization of [FnY·] to 1 FnY·/β2 for all FnY·-β2, their
activities were measured and the results are summarized in
Table S2. All FnY·-β2s are active with activities that vary
between 5% to 85% of wt-β2 and that scale with radical
concentration. The turnover number for (2,3,6)F3Y·-β2 is
measured for the “stable” radical, and even for this species,
activity is lost as a function of time (50% loss within 2 min).76
Thus, thisβ2 variant which has the largest reduction potential
is, perhaps not surprisingly, the least stable, a result that
parallels our observations with NO2Y·-β2 (NO2Y at position
122 inβ2).35
Structures of met-FnY-β2 by X-ray Crystallography. All
of the met-FnY-β2s and met-wt-β2 proteins were crystallized
under similar conditions at pH 8.0 at room temperature (∼23
°C). The overall structures show minimal perturbations relative
to wt-β2 (Figure 2). The details of the refinement are described
in the methods, and the results are summarized inTable S3.
The resolutions of the structures vary from 2.0 to 2.5 Å. An
important issue in the refinement process was that in three of
the four FnY’s, the fluorines are asymmetrical with respect to
the aromatic ring and can thus potentially have multiple
conformations resulting from a 180° rotation around the Cβ−
Cγ bond of the aromatic ring. Our previous structural studies
on NO2Y-β235showed a single conformation in which the NO2
group resided on the side away from D84 and was embedded
within the hydrophobic pocket composed of L77, Q80, I125, N227,
I231, and I234 (Figure S5). In the case of all the FnY-β2
structures, these residues adjacent to Fe1 are identical to wt-β2
and refined to an all-atom RMSD of ∼0.1 Å (Figure S5).
Several additional features of the Fe1 in the cluster are thought to play an important role in active cofactor assembly
and in initiation of radical transfer (RT) between theα and β
subunits. Both D84and the water ligand to Fe1 may be involved
in the redox chemistry of Y122. In all the structures, D84in Fn
Y-β2 is almost identical to that in wt-Y-β2 and is always monodentate; the distances for its two oxygens to the Fe1
are∼2.0 and 2.8 Å. All structures also have one water molecule
bound to Fe1. With wt-β2, this water has been shown to play a
role in RT initiation.77 The distance between the phenolic
oxygen of Y122and the water in wt-β2 is 3.9 Å (Figure 2A). This
distance is comparable to the 3.95/3.88 Å distance in PDB
1MXR,78a previously reported 1.42 Å resolution structure. In
the initial structure (PDB 1R1B79) distances of 4.12/4.21 Å are
reported. However, these structures contained Hg atoms in a number of positions that could alter the cofactor environment.
As observed inFigure 2C−E, two conformations of the phenol
ring in (2,3)-, (2,3,5)-, and (2,3,6)F3Y-β2 are modeled to
interact with the water with distances between 3.8 and 4.5 Å. Finally the iron occupancy in each site of the cluster appears
complete, despite the fact that there are only 3−3.5 Fe/β2
measured biochemically.
The presence of different fluorine substitution patterns in
each of the FnY at position 122 as noted has given rise to
multiple conformations of the aromatic ring relative to the Fe1 site. As will be discussed subsequently, published structures
with 3-FY and 2-FY globally incorporated into different
proteins show that the fluorine conformation(s) are protein
environment-dependent and, in most cases, not predictable.80
Multiple conformations of FnY’s can arise either from complete
flipping of the aromatic rings (a 180° rotation around the Cβ−
Cγ bond of Y) or from a subtle shift in their positions. In the
case of (2,3)-, (2,3,5)-, and (2,3,6)F3Y-β2, the electron density
cannot be modeled well by a single conformation of the aromatic ring but instead is more consistent with two
conformations that differ by a 180° rotation around the Cβ−
Cγ bond and a slight shift within the hydrophobic pocket
Figure 2.Cofactor arrangement in FnY-β2. (A) The structure of wild-type met-β2 contains a diferric cluster (Fe1 and Fe2, ball and stick) that
coordinates two water molecules (red spheres). Iron ligation by protein residues (green) or water is represented by black dashes. Putative hydrogen bonds are shown as yellow dashes. Y122(light blue) is positioned adjacent to Fe1, but not within hydrogen bonding distance (white dash). The
electron density for Y122is shown inset (2Fo− Fcat 1σ; green: Fo− Fcat 3σ; red: Fo− Fcat−3 σ). (B−E) Each FnY-β2 is shown as in (A). For
(2,3)F2Y, (2,3,5)F3Y, and (2,3,6)F3Y two conformations are present. The IN conformation (yellow) in each structure places thefluorine atoms on
carbons 2 and 3 adjacent to D84. The OUT conformation (orange) isflipped 180°. Analysis of the occupancy of these conformations (Figure S6)
suggests the IN conformation is typically dominant. Journal of the American Chemical Society
(Figure S6). The precise ratio of these two conformations is uncertain due to the modest resolution of these structures, but
refinement of a single conformation or complete omission of
FnY yields difference density clearly indicating a second
conformation is present (Figure S6). In all cases, the favored
conformation has twofluorine atoms packed against D84, which
we will now call the “IN” conformer. The alternate
conformation, in which C2 and C3 fluorines are away from
D84, is accordingly denoted“OUT”.
Finally, the C-terminal tail (residues 340−375) of β2, which
provides the interaction site between theα and β subunits, is
disordered in all publishedβ2 structures. Here all of the FnY-β2
structures have an additional 9 residues (341−349) that are
observed although they are moderately disordered (average B
factors of ∼100−150 Å2) and have no specific, stabilizing
contacts with the exterior of the protein. Residues 360−375
have been previously visualized in structures of the inactive
α4β4 complex81
and in structures ofα2 in complex with a
20-mer peptide corresponding to residues 355−375 of β2;31these
residues, however, are completely absent in wt-β2 and all Fn
Y-β2 structures.79,82
Although observation of residues 341−349 is
unprecedented, these residues are highlyflexible in our current
model and are likely to adopt a different conformation in the
proposedα2β2 active conformation, as they would bridge the
intersubunit interface.
Characterization of FnY· by Multifrequency EPR and
ENDOR Spectroscopies. The magnetic properties of natural
Y· have been shown to be sensitive reporters of the surrounding
protein environment. For example, the magnitude of the gx-shift
(Figure 3, right) is correlated to the strength and number of
hydrogen bonds to the phenoxy oxygen.69,83 The hyperfine
couplings of the ring protons report on the spin distribution
about the π-system and the magnitude of the hyperfine
couplings to the two β-methylene protons, which arise from
their interaction with the π-electrons (Figure 3, left), can be
interpreted to give the degree to which the Y ring is rotated relative to the peptide backbone.
Although EPR spectroscopy has previously been used to
examine FnY’s installed in both photosystem II
7
and class Ia
RNR,8,10,17 a spectroscopically validated electronic structure
description of these non-natural amino acid radicals has not yet been developed. To this end, we have produced RNRs with one
of four different FnY’s installed at position 122 of β2 and
characterized the oxidized FnY (FnY·) using multifrequency
EPR and orientation-selected pulsed ENDOR spectroscopies at
high field (Figures 4, 6, 7, and S7−S10). We hope that the
detailed analysis of these spectra will encourage the use of FnY·
as a redox-tunable radical probe for the local protein environment. In what follows, we will illustrate the process of interpreting these multiple data sets using the EPR and
ENDOR spectra of (3,5)F2Y·-β2 as an example.
The EPR spectrum of (3,5)F2Y·-β2 was acquired at both
X-band (9.4 GHz) and D-X-band (130 GHz) excitation frequencies (Figures 4A and 4B, respectively). The multifrequency EPR
spectra for all four FnY·-β2s are presented in the SI(Figures
S7−10). At the relatively low magnitude of the applied
magnetic field (B0= 330 mT) at X-band, the g-anisotropy of
(3,5)F2Y·-β2 is not well resolved (see vertical dashed lines,
Figure 4A). Instead, the spectral line shape is determined by the
largest 1H and 19F hyperfine interactions (Figure 5andTable
1). In the case of (3,5)F2Y·-β2, a splitting pattern composed of
a triplet of doublets is observed (Figure 4). These doublets are
Figure 3.From left to right: Depiction of interaction betweenπ-electrons and β protons as a function of angle θ (see discussion on McConnell relations); the numbering of tyrosine ring atoms and typical approximate spin densities at selected atoms in Y·, and the alignment of the g-tensor relative to the molecular frame for Y· and FY·.
Figure 4.X-band CW EPR (Panel A) and D-band Pseudomodulated ESE-EPR spectra (Panel B) and simulations of (3,5)F2Y· in RNR β2. Field
positions of g-tensor principle components are shown with vertical dotted lines. Resolved hyperfine splittings from19F and1H are denoted with the
solid angled brackets. Acquisition parameters: X-band CW EPR: Temperature = 80 K; MW Frequency = 9.395 GHz; MW Power = 317μW; Modulation amplitude = 1.5 G; Modulation Frequency = 100 kHz; Conversion time = 50 ms. D-band ESE-EPR: Temperature = 30 K; MW Frequency = 129.996 GHz;π/2MW= 37.5 ns;τ = 200 ns; shot rep time (srt) = 10 ms.
caused by a1H hyperfine interaction that is relatively large and
isotropic (A≈ 53 MHz)properties that preclude the signals
from being assigned to the ring protons and point instead to a
strongly coupled β-methylene proton, 1H
β1, as the source
(Figure 3and Table 1). The triplet pattern results from the
hyperfine interaction of the two nearly equivalently coupled19F
nuclei at the 3 and 5 positions. If the intensity pattern of the triplet were simply 1:2:1, this ratio would indicate that these
hyperfine interactions are nearly isotropic. That the observed
intensity pattern is closer to 1:6:1 is instead indicative of an
axial hyperfine interaction in which the largest component (Az)
is approximately 157 MHz and the splittings along gxand gyare
not resolved.
By going to a much higher appliedfield using our 130 GHz
spectrometer (ca. 4630 mT), the g-anisotropy becomes
apparent (see vertical dashed lines in Figure 4B and g-values
inTable 2). The strong nuclear hyperfine interactions of1H β1,
3-19F, and 5-19F still contribute to the spectrum, and we observe
that the largest component of the two19F hyperfine tensors is
aligned along gz (ca. 4639 mT), where the familiar triplet of
doublets splitting pattern from the two equivalent 19F nuclei
and 1H
β1 is centered. Again, along gx (ca. 4625 mT), only a
single splitting arising from the isotropically coupled 1Hβ1 is
resolved.
Thus, far, with just these two multifrequency EPR spectra,
the molecular g-values can be determined from the high-field
D-band spectrum and the largest components of 19F and 1H
hyperfine tensors can be estimated, first by inspection of both
spectra in Figure 4, then refined by performing least-squares
optimization of simulations of the X and D-band EPR data. Figure 5.Hyperfine values (MHz) for ring atoms of Y122· and FnY122·s.
Values of each component of the hyperfine tensor are presented in order as Ax, Ay, Az. Parameters determined from simulations of the
combined EPR and ENDOR data for each position are presented on top in red, and the parameters from DFT calculations are presented on the bottom in black. Experimental values for WT Y· are from an ENDOR study by Hoganson et al.84
Table 1.β-1H Hyperfine Coupling and Geometric Parameters
A (MHz)
RNRβ2 variant Ax Ay Az Aiso(MHz) Relative abundance ρC1c 1Hβ1θ° from EPRc,e 1Hβ1θ° from XRDd,e
wild type Y1221H
β1a +59 +52 +55 56 1.00 0.387 19.0 15.8f
wild type Y1221H
β2b +2.1 −5.0 −4.0 2.3
wild type Y1221H
β1(this work) 11.9 (3,5)F2Y1221Hβ1 +56 +50 +52 53 1.00 0.370 20.3 19.7 (3,5)F2Y1221Hβ2 −0.5 −0.5 +3 1.7 (2,3)F2Y1221H β1INg +56 +53 +53 54.3 1.00g 0.388 21.7 17.2 (2,3)F2Y1221Hβ2IN +1 +1 +2 1.3 (2,3,5)F3Y1221Hβ1IN +57 +51 +54 54 0.80 0.386 21.7 14.0 (2,3,5)F3Y1221Hβ2IN +0.5 +0.5 +3 1.3 (2,3,5)F3Y1221Hβ1OUT +43 +38 +38 39.7 0.20 0.357 34.1 29.9 (2,3,5)F3Y1221Hβ2OUT −0.5 −0.5 +2 0.3 (2,3,6)F3Y1221Hβ1IN +52 +50 +56 53 0.25 0.372 20.3 20.1 (2,3,6)F3Y1221Hβ2IN +1 +1 +3 1.7 (2,3,6)F3Y1221Hβ1OUT +48 +44 +44 45.3 0.75 0.360 28.2 21.6 (2,3,6)F3Y1221Hβ2OUT −0.5 +0.5 +0.3 0.1
aHFI parameters from Hogbom et al.78bHFI parameters from Hoganson et al.84cComputed using TRSSA with B″ = 162 MHz (Svistunenko et
al.).85dX-ray diffraction (XRD) angles measured manually in PyMOL after addition of hydrogen atoms.eThe IN and OUT conformations differ by an approximate 180° rotation of the tyrosine ring about Cβ−Cα; here we report the reduced angles (e.g., forθ > 180°, subtract 180°).fFrom PDB
1MXR.78gNo signal attributable to the OUT conformation was observed.
Table 2.g-Values for Y122•
RNRβ2 or DFT phenoxyl variant gx gy gz wild typea 2.00912 2.00454 2.00219 DFT Phen 2.00864 2.00465 2.00221 (3,5)F2Y 2.00828 2.00500 2.00196 DFT (3,5)F2-Phen 2.00803 2.00538 2.00212 (2,3)F2Y 2.00850 2.00465 2.00205 DFT (2,3)F2-Phen 2.00817 2.00494 2.00218 (2,3,5)F3Y 2.00820 2.00510 2.00205 DFT (2,3,5)F3-Phen 2.00788 2.00534 2.00213 (2,3,6)F3Y 2.00844 2.00470 2.00210 DFT (2,3,6)F3-Phen 2.00810 2.00489 2.00218 aFrom Hoganson et al.84
However, ENDOR spectroscopy is necessary to determine the
smaller hyperfine couplings of the19F tensors and those from
the ring protons at the 2 and 6 positions as the corresponding
hyperfine splittings are lost in the inhomogeneously broadened
lines of the field-swept EPR spectrum. High-field ENDOR at
130 GHz is particularly helpful in identifying the smaller
couplings arising from 1H vs 19F because their respective
nuclear Larmor frequencies, and thus the center of their respective ENDOR spectra, are separated by a much greater
extent (1HνI= 197 MHz,19FνI= 186 MHz) than at X-band
(1H ν
I= 14.3 MHz,19FνI= 13.4 MHz) or Q-band (1HνI =
51.6 MHz,19FνI= 48.6 MHz).
Again returning to our exemplar data for the symmetrically
fluorinated (3,5)F2Y·-β2 sample, we show in Figure 6A the
central region (i.e., within ±40 MHz of the 1H Larmor
frequency) of the ENDOR spectra collected at three field
positions across the EPR envelope. At 130 GHz/4630 mT, all
hyperfine interactions for these radicals fall within the weak
coupling limit (|νI| > |A|/2), meaning that each individual
nuclear coupling can be expected to produce an ENDOR
spectrum that consists of a pair of peaks centered about|νI| and
split by|A|. Because the individual g-values are resolved at these
high fields (Figure 4B), changing the field at which the
ENDOR experiment is performed allows us to select only a
subset of possible orientations of the F2Y·, allowing for
unambiguous determination of the principal components
(e.g., Ax, Ay, Az) of each hyperfine tensor. From these data,
the smaller couplings from1H’s at the 2 and 6 positions as well
as the second, more weakly coupledβ-methylene proton (1Hβ2)
can be determined (Figure 6A), with assignments guided by
comparison to DFT-predicted values for a simplified (3,5)F2
-phenoxy radical model (Figure 5). A modest asymmetry in the
intensity of the 1H ENDOR patterns likely arises from a
combination of hyperfine enhancement86,87 (for the more
strongly coupled protons) and a small amount of saturation of
the ENDOR transitions.88 The complete ENDOR spectrum
(100−300 MHz) for the gzcomponent is shown inFigure 6B.
This spectrum reveals that the19F hyperfine interactions from
the fluorines at positions 3 and 5 are extremely large (157
MHz) and broad. Thus, by combining analysis of the
multifrequency EPR spectra, high-field (HF),
orientation-selected ENDOR, and insights from DFT calculations, all relevant magnetic couplings and g-tensor elements can be rigorously assigned. This same methodology was used for
evaluating the other three asymmetric FnY·-β2 radicals and the
combined X-band, D-band and D-band ENDOR data sets with
simulations can be found in theSIin Figures S7−S10.
The parameters obtained from the simulations of the multifrequency EPR data reveal a great deal of information
on the electronic structure of each FnY·-β2 variant through
changes in the g-tensor and hyperfine couplings at each ring
position, as well as yielding structural information regarding the
rotational orientation of the Y side chain through the hyperfine
coupling from the protons on the β carbon. Each of these
matters will be discussed in turn.
g-Tensor Analysis. Analysis of the g-tensors for each radical (Table 2) reveals that the gx values of all of the FnY·-β2s are
very similar to each other (2.0082−2.0085) though rather
different from the gx value of the wt-β2 (2.00912) previously
determined by Hoganson et al.84In the case of wt-β2, the gx
element of the g-tensor is aligned along the C−O bond of Y·
(Figure 3) and its value is often invoked as a measure of the strength of hydrogen bonding or a sensor of the electrostatic
environment of the O of the phenoxy group.83All of the FnY
·-β2s exhibit smaller gxvalues than wt-β2 that could be indicative
of differences in their electrostatic environments. However, the
DFT-predicted magnetic parameters usingfluorinated phenoxyl
Figure 6.(A) Field-dependent D-band Davies ENDOR of (3,5)F2Y·
in RNRβ2 in the frequency range from 160−233 MHz. Experimental data are shown in black, the total simulated spectrum is in red, and isolated contributions from1H and19F nuclei are in blue and green,
respectively. Resolved peaks and assigned nuclei are denoted with black brackets. (B) Full ENDOR spectrum acquired at B0≈ gz(4643
mT). Broad signal associated with the19F
3,5Azcomponent is denoted
with the black bracket below the experimental spectrum. Acquisition parameters: Temperature = 30 K; MW Frequency = 129.996 GHz;π/ 2MW= 37.5 ns;πRF= 24μs; τ = 300 ns; shot rep time (srt) = 10 ms.
Table 3. Computed Total Mulliken Spin Populations for Fluorotyrosine Models
model C1 C2 H/F2 C3 H/F3 O4 C5 H/F5 C6 H/F6 Phen 0.374 −0.119 0.005 0.262 −0.013 0.362 0.261 −0.013 −0.119 0.005 (3,5)F2-Phen 0.338 −0.109 0.004 0.231 0.019 0.357 0.230 0.019 −0.109 0.004 (2,3)F2-Phen 0.362 −0.114 −0.004 0.244 0.021 0.359 0.258 −0.013 −0.117 0.005 (2,3,5)F3-Phen 0.346 −0.089 −0.003 0.201 0.017 0.354 0.268 0.023 −0.131 0.005 (2,3,6)F3-Phen 0.368 −0.135 −0.005 0.299 0.027 0.351 0.200 −0.010 −0.085 −0.002 Journal of the American Chemical Society
radicals indicate that O4 has moderately reduced spin
populations compared to those for the nonfluorinated Y
(Table 3), which would also affect gx.69In contrast to gxand gz,
the addition offluorines appears to have a larger effect on the
value of gy, a trend also predicted by DFT (Table 2).
Importantly, the orientation of the predicted g-tensor relative to the molecular frame is conserved in all cases, even with the
asymmetrical FnY’s. Despite the strong electronegativity of
fluorine, the changes in the spin density distribution remain roughly symmetrical about the C2 rotational axis of the
phenoxyl ring; thus, gx remains aligned along the C−O bond
and gz is oriented orthogonal to the plane of the ring (Figure
3).
Ring Atom Hyperfine Tensors. For each FnY·-β2, the
hyperfine tensors for each of the ring protons and fluorine
nuclei (Figure 5) were determined primarily byfitting the
field-dependent D-band ENDOR spectra (Figure 7). The exceptions
were the Az components of the 19F hyperfine tensors of
positions 3 and 5 which were constrained by large splittings
observed in the X- and D-band EPR (Figure 4). Thefit was of
particular importance for determination of the magnitude of the
smaller 1H and 19F couplings at the 2 and 6 positions, which
have only minor effects on the appearance of the field-swept
EPR spectra. In addition, results from the orientation-selected ENDOR experiments allowed the small elements of the
hyperfine tensors for the strongly coupled but highly
anisotropic nuclei to also be determined. Comparison of the ENDOR spectra of each radical acquired at the center of each
spectrum reveals substantial differences (Figure 7). Though the
magnitude of the largest element of the most strongly coupled
19F nucleus was not as well resolved in the ENDOR spectrum
for all of the FnY·’s examined due to the considerable breadth of
this ENDOR feature, this parameter is constrained by the span of the X-band CW spectrum for each variant (Panel A of
Figures S7−S10). The19F hyperfine tensors, particularly in the
3 and 5 positions, show strong, axial anisotropy due to the
unpaired spin contained in thefluorine 2pzorbital. This value is
estimated by DFT to be up to 2% to 3% forfluorine in the 3 or
5 position and 0.3% to 0.8% forfluorine in the 2 or 6 position.
In the case of (3,5)F2Y·-β2, the only symmetric FnY we
studied, the two19F hyperfine tensors are essentially identical
(Figure 5). This result suggests that any differences in the protein environment near F3 and F5 are either small or do not
influence the magnetic properties. However, to best fit the
weaker1H couplings required slightly different tensors for H2
and H6. These differences in this symmetric FnY may be due to
the rotation of the side chain about the β-carbon, as this
rotation has been shown to have modest effects on the
hyperfine couplings of ring protons in Y models in a previous
DFT study.69
When the symmetric (3,5)F2Y·-β2 is compared to the
asymmetric FnY·’s, the Az of the most strongly coupled 19F
displays an upward trend in magnitude between variants, with
(3,5)F2Y· < (2,3)F2Y· < (2,3,5)F3Y· < (2,3,6)F3Y· (Figure 5).
For (2,3)F2Y· and (2,3,6)F3Y·, the 19F at the 3 position is
predicted to exhibit the largest coupling, while in (2,3,5)F3Y·
the largest19F coupling is predicted to occur at the 5 position.
This trend in the magnitude of the19F HFI for each variant is
matched by estimations of the Mulliken spin populations for F atoms at these positions, as well as for the adjacent
spin-carrying C3 and C5 atoms by DFT (Table 3). The changes in
spin localization about the tyrosine ring that are reflected in the
experimentally observed 19F and 1H couplings and calculated
spin populations on the ring atoms are primarily caused by
inductive effects of the electron-withdrawing, highly
electro-negativefluorine atoms.
The sign and magnitude of the ring atom hyperfine tensors
for each FnY· are qualitatively predicted by DFT calculations
(Figure 5), although the anisotropy of all19F tensors appear to
be slightly overestimated, thus precluding quantitative accuracy compared to the experimental results. DFT calculations predict
that Axand Ayfor19F at the 3 and 5 position are negative, but
Azis positive, which is consistent with the simulations of the
D-band EPR and ENDOR when the Davies suppression hole is
included as A→ 0.63
For each ring19F or1H atom, the relative orientation of the
coordinate system of the nuclear hyperfine tensor A to the
molecular g-tensor must also be considered, as related by the
Euler rotation anglesα, β, and γ. DFT calculations predict that
the A tensors for each ring atom for all FnY· variants are rotated
by angleα about the ring plane normal (corresponding to gz)
such that Axis aligned approximately along the chemical bond
vector, with minor deviations not exceeding 15° (Table 4), with
no appreciable rotations about gxor gy. Theα angles predicted
by DFT were used in our simulations of the multifrequency EPR and HF ENDOR for each variant and appear to be in excellent agreement with the experimental data.
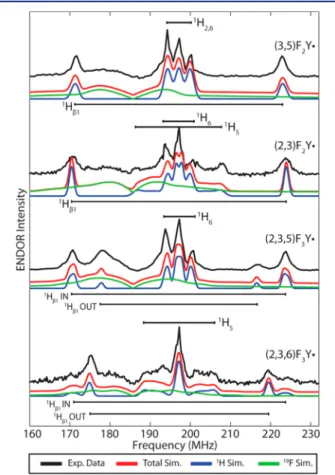
Figure 7. Comparison of D-band Davies ENDOR acquired at the spectral center (B0≈ gy) of each FnY· in RNR β2. Experimental data
are shown in black, total simulated spectrum is in red, and isolated contributions from 1H and 19F nuclei are in blue and green, respectively. Resolved peaks and assigned nuclei are denoted with black brackets. Acquisition parameters: Temperature = 30 K; MW Frequency = 129.996 GHz;π/2MW= 37.5 ns;πRF= 24μs; τ = 300 ns;
shot rep time (srt) = 10 ms.
β-Proton Hyperfine Couplings. In addition to hyperfine
couplings arising from the ring 1H and 19F nuclei, we also
observe relatively large isotropic proton couplings of
approximately 45−55 MHz (Table 1), as well as very small
isotropic couplings of less than 3 MHz which reside near the
1H Larmor frequency (ν
n ≈ 197 MHz at 4634 mT, Figures
6−7). These isotropic proton couplings arise from the two
unequivalent protons of Cβ(Figure 3). The magnitude of these
couplings is dependent on the degree of hyperconjugation of
the Cβ−H bonding orbital with the π-system of the aromatic
ring (see Figure 3) as a function of the dihedral angle θ
between the Cβ−H bond and the normal vector of the Y ring
plane. This interaction is maximized when the Cβ−H bond is
aligned perpendicular to the Y ring plane such that the dihedral
angleθ = 0 and is minimized when this bond is parallel to the
ring plane. The observed Aiso for each β proton can be
mathematically correlated to the dihedral angle between the
Cβ−H bond and the vector normal to the ring plane using the
McConnell relations:89 ρ θ ρ θ = ″ = ″ − ° β β A1 C1B cos ( ) A CB cos ( 120 ) 2 2 1 2 (2)
Here Aβ1and Aβ2are the isotropic hyperfine couplings of the
two respectiveβ1H nuclei, ρ
C1is the spin density on the C1
atom, and B″ is a constant (B″ = 162 MHz).85,90 This
relationship allows for facile estimation of both the spin density
onρC1 andθ through the use of the Tyrosyl Radical Spectral
Simulation Algorithm (TRSSA) developed by Svistunenko and
Cooper.85 This analysis has been utilized to estimate these
parameters for each of the FnY· variants examined here (Table
1), with comparison to theθ calculated for each FnY· refined in
the XRD data.
For the symmetric (3,5)F2Y·, only a single large β1H
coupling with Aiso= 53 MHz is clearly resolved. This value is
near the maximum of the theoretical limit for a1Hβ1coupling
whereρC1is in the range 0.35−0.42 that is typically observed
for Y·;85 thus we assign the very small isotropic coupling
observed with Aiso = 1.7 to the other β proton, 1H
β2. Using
these values, TRSSA analysis indicates a dihedral angle for1Hβ1
of 20.3°, which is in excellent agreement with the modeled
orientation from the XRD of 19.7° (Table 1). The presence of
only a single strongβ1H coupling is indicative of the presence
of a single, conserved rotational orientation of the Y side chain within all proteins in the sample, which is also consistent with
the refined position of (3,5)F2Y in the X-ray structure
presented here. Though theρC1 value of 0.387 obtained from
this analysis is higher than the Mulliken spin population
estimate of 0.338 from DFT (Table 3), it should be noted that
the DFT models are simplified phenoxy radicals with only
protons on Cβ and, thus, would not exhibit effects from the
rotation of the carbon relative to the ring plane that may affect
ρC1.
69
For each of the asymmetric FnY·’s, there is also at least one
clearly resolved large isotropic1H coupling assigned to aβ-1H.
For the (2,3)F2Y·, there appears to be only a single large β-1H
coupling with an Aiso of 54.3 MHz, with a paired weakly
coupledβ-1H with Aiso= 1.7 MHz, indicating aθ of 21.7° for
1H
β1, which is very similar to the (3,5)F2Y·. This result is
consistent with the X-ray refinement of (2,3)F2Y, in which the
IN conformer, with thefluorines of C2and C3packed against
the side chain of D84, predominates (Figure S6).
Interestingly, for (2,3,5)F3Y· and (2,3,6)F3Y·, two distinct
large isotropic couplings are clearly resolved with different
relative spectral intensities (Figure 7,Figures S9C and S10C).
Here, the high-field ENDOR is invaluable in identifying these
distinct couplings, as in the X-band CW and D-band EPR spectra the inhomogeneous line broadening largely obscures these subtleties. In both cases, these two values are too large to
represent the twoβ protons of a single orientation of F3Y· due
to the constraints imposed from the McConnell relations described above. Rather, these couplings must arise from two
distinct, conserved populations of rotational conformers of F3Y·
with different 1H
β1 dihedral angles, each with their own
associated weakly coupled1Hβ2(Table 1). By using weighted
multicomponent simulations of these two subpopulations,
where all g-values and nuclear couplings were heldfixed except
the1H
β1values, a rough estimate of the relative abundance of
each conformer was achieved by comparison to the observed
spectral intensity of these strongly coupledβ-1H peaks in the
D-band ENDOR (Figures S9C and S10C). The weighting of
the two individual components was optimized to fit the
experimental data and yielded the estimates of the relative
abundance of each conformation presented inTable 1. As the
IN conformation observed by XRD displayed a smaller1Hβ1θ,
we assigned this conformation to the larger 1H
β1 coupling
according to the McConnell relation described above. Likewise,
the smaller 1H
β1 coupling is produced by the OUT
conformation. Interestingly, the proportions of these rotational
conformers seem to be reversed between these two F3Y·
variants, with the IN conformation exhibiting the larger 1Hβ1
coupling being dominant (0.80) in (2,3,5)F3Y·, whereas the
OUT conformation exhibiting the smaller 1Hβ1 coupling is
more abundant in (2,3,6)F3Y· (0.75). While the crystal
structures also indicate the presence of two conformations for
both (2,3,5) and (2,3,6)F3Y side chains, the favored one in both
cases has thefluorines at positions 2 and 3 pointing toward D84
(the“IN” position). These differences may be due to the
fast-decaying component observed for (2,3,6)F3Y· by RFQ-EPR
during cluster assembly (Figure S4). As described in the
Materials and Methods, the (2,3,6)F3Y·-β2 samples used for the
EPR analysis in this paper were aged for 2 min to represent the
“stable” (2,3,6)F3Y·. The apparent change in the relative
abundance of the IN and OUT conformations of (2,3,6)F3Y·
relative to that of the reduced (2,3,6)F3Y present in the crystal
structure may indicate that the IN conformation corresponds to this rapidly decaying population observed by RFQ-EPR.
■
DISCUSSIONFnY’s have long been used to study protein structure and
function, as they perturb the electronic properties of Y, while minimally perturbing its size (van der Waals radius of F is 1.42 Å compared to 1.27 Å for H). Global incorporation of FY and
site-specific incorporation of FnY by expressed protein ligation
(EPL) have been the most widely used methods.91 In the
former case, a Y auxotroph is grown with 2- or 3-FY in medium
that is depleted of Y. Thus, all Y’s in the protein of interest are
replaced by the Y analog. Efforts to incorporate FnY with n > 1
by this method, however, typically result in lower incorporation
Table 4. Estimated Euler Angles (α,β,γ)° between A Tensors
andg Tensor for Ring Atoms of RNR FnY-β2 Radicals
RNRβ2 2 3 5 6
(3,5)F2Y (−130, 0, 0) (−55, 0, 0) (55, 0, 0) (130, 0, 0) (2,3)F2Y (−120, 0, 0) (−58, 0, 0) (65, 0, 0) (135, 0, 0)
(2,3,5)F3Y (−120, 0, 0) (−58, 0, 0) (58, 0, 0) (125, 0, 0)
(2,3,6)F3Y (−120, 0, 0) (−58, 0, 0) (65, 0, 0) (120, 0, 0) Journal of the American Chemical Society
efficiency.92In the case of EPL, site-specific incorporation of
FnY involves ligation of a chemically synthesized peptide
containing FnY with a recombinantly expressed protein to
generate the intact mutant protein. In this case, only a
designated Y is replaced with FnY (n = 2, 3, or 4). The EPL
method is limited, as the residue of interest must be synthetically accessible and, hence, localized to either the
C-or N-terminus of the protein.93,94 However, EPL can be
mechanistically informative when the FnY properties are
compared to each other, as the pKa of FnY’s range from 5.6
to 10.095and their reduction potentials cover a range of 300
mV.8 The incorporation of these analogs has provided
investigators with the tools to study the mechanisms of phosphorylation of Y in a peptide and of proteins by tyrosine
kinases,6,95 the importance of H-bonding networks, and pKa
perturbation within these networks in ketosteroid isomerase5
and to study PCET in the oxygen evolving complex as a
function of pH.7
Recently, Li et al.11and Minnihan et al.10have used a third
method to site-specifically incorporate FnY analogs, the amber
suppressor method developed by Peter Schultz that utilizes an
evolved, orthogonal tRNA/RS pair.96In the former case, the
method has been used to study the oxidase activity of an engineered myoglobin model of cytochrome oxidase proposed
to involve a transient Y· intermediate.97,98In the latter case, the
unique properties of the E. coli RNR system to self-assemble
the active diferric-FnY· cofactor from diferrous-FnY, O2, and
reducing equivalents99 have allowed investigation of Y·
equilibration and assessment of the thermodynamic landscape
of the RT pathway (Figure S1).36 The crystallographic and
multifrequency EPR and HF ENDOR spectroscopic studies reported in this paper have allowed characterization of the
ground state and oxidized state of FnY within the protein
environment providing a benchmark for other protein systems.
We have successfully incorporated FnY in place of all four Y’s
in the RT pathway (Figure S1).76The unique positioning of
Y122, adjacent to the diiron cluster inβ2, allows generation of
FnY122· and investigation of their spectroscopic properties
(Figures 4, 6, 7, and S7−S10). The 19F nucleus provides
distinct features in the low- and high-field regions of the EPR
spectra relative to Y·. Simulation of these EPR spectra is critical
to the deconvolution of spectra involving multiple Y·’s, as the
features of most Y·’s are narrow and superimposable. Our
ability to site-specifically incorporate (3,5)F2Y in place of Y731
or Y730 of α2 has allowed detection of radical equilibration
between the three transient Y·’s in the RT pathway between the
two RNR subunits.36 When NO2Y·-β2 is incubated with α2,
CDP, and ATP (effector), the Y356· is generated concomitant
with reduction of NO2Y· to NO2Y phenolate (NO2Y¯). The
inability of Y356· to reoxidize NO2Y¯ to NO2Y· allows Y356· to
equilibrate with the pathway Y’s in α2. Unfortunately, this
equilibration cannot be observed due to substantial overlap in
the EPR spectra of Y356·, Y731·, and Y730·. When the experiment
was repeated with (3,5)F2Y731- or (3,5)F2Y730-α2, the unique
19F hyperfine features allowed observation and quantitation of
Y356· and (3,5)F2Y· demonstrating, for the first time, the
equilibration between the pathway Y’s. Although the majority
of the spin was localized to either Y356· or NO2Y· (>85%), we
were able to detect (3,5)F2Y· at each position.
A second example of the usefulness of the method was recently demonstrated with the myoglobin system engineered
to model cytochrome c oxidase. In studies of O2reduction, an
EPR active species was observed, postulated to be a Y·.100
Site-specific incorporation of (3,5)F2Y in place of Y allowed
unambiguous assignment of the new radical based on the
observation of the 19F hyperfine interactions.98 Furthermore,
site-specific incorporation of several Y analogs with altered
pKa’s and reduction potentials provided insight into the
mechanism of the model oxidase. Interpretation of these results, however, requires an understanding of the perturbation
of the pKa’s and reduction potential of each UAA within the
protein environment as well as an understanding of the
rate-limiting steps in the overall reaction.98
Recently, Liu et al. reported the design of a genetically encoded photoinduced electron transfer (PET) sensor starting
with a flavoprotein iLovU optimized for its fluorescence
properties by engineering of a Y adjacent to the FMN binding
site.12FnY and ClnY were incorporated in place of Y as their
lowered pKa’s allowed them to function as excellent PET
quenchers relative to Y. The charge neutral (i.e protonated)
FnY and ClnY are not efficient PET donors, and the sensor
iLovU is in thefluorescence ON state. The deprotonated FnY
and ClnY are much more rapidly oxidized than the neutral
phenols and are better PET donors. Similar to protonation, the
Y· state results in a reduction in the PET rate, turning on
fluorescence. Liu et al. successfully evolved tRNA/RS pairs to
each of the Y analogs. PET from Cl2Y to the FMN of iLovU
was supported by detection of Cl2Y·. The authors also
described several interesting examples for the use of this PET sensor.
In addition to covering a range of reduction potentials, FnY’s
also offer a range of pKa’s that can be mechanistically
informative. By replacing each of the pathway Y’s in RNR
with NO2Y and by taking advantage of the visible properties of
the NO2Y¯, we have previously shown that the pKais minimally
perturbed at Y356, Y731, and Y730, whereas it is shifted >3 units at
Y122 (Figure S1).42Given that Y oxidation requires loss of a proton and an electron, the protein environment plays a very important role in this process. If reversible redox chemistry is
occurring at a specific Y, it is not clear with the FnY analogs
what the fate of the proton will be subsequent to oxidation. In
the case of NO2Y·-β2 the phenol in the resting state is
protonated. The cofactor assembly process generates the
NO2Y· that then initiates RT into the active site. Initiation of
RT with NO2Y·, however, generates the phenolate and not the
phenol,35 in contrast with Y122.77 During reverse RT, Y356·
cannot reoxidize the phenolate, and thus, NO2Y·-β2 only
catalyzes one turnover. Radical initiation with (2,3,5)F3Y·-β2
catalyzes multiple turnovers;10,17 however, it is not known if
this radical gets transiently reduced to the phenolate or the
phenol. A method to measure the pKa’s of the FnY’s in the
different environments and linking this information to the
mechanism is thus important. This conclusion will definitely be
protein environment dependent, and one cannot assume that
the pKaof the analog is not perturbed.
7,98
From our studies, a number of issues may be encountered
when using this site-specific incorporation methodology
especially if 100 mg quantities of homogeneous protein are required for mechanistic studies. We have had experience with
FnY incorporation at positions 122 and 356 withinβ2 of RNR
and at positions 731 and 730 within α2.16,76 We have also
incorporated FnY into a small three helix bundle protein (α3X,
65 amino acid) containing a single buried Y that we have used
to measure the reduction potentials of FnY·’s.
37
In general,
incorporation of the same Y analog into a different position and
into distinct proteins requires optimization. The vectors used, Journal of the American Chemical Society