HAL Id: inserm-00696583
https://www.hal.inserm.fr/inserm-00696583
Submitted on 9 Jan 2013HAL is a multi-disciplinary open access archive for the deposit and dissemination of sci-entific research documents, whether they are pub-lished or not. The documents may come from teaching and research institutions in France or abroad, or from public or private research centers.
L’archive ouverte pluridisciplinaire HAL, est destinée au dépôt et à la diffusion de documents scientifiques de niveau recherche, publiés ou non, émanant des établissements d’enseignement et de recherche français ou étrangers, des laboratoires publics ou privés.
Preoperative predictive factors of aneurysmal regression
using the reporting standards for endovascular aortic
aneurysm repair.
Adrien Kaladji, Alain Cardon, Issam Abouliatim, Boris Campillo-Gimenez,
Jean François Heautot, Jean-Philippe Verhoye
To cite this version:
Adrien Kaladji, Alain Cardon, Issam Abouliatim, Boris Campillo-Gimenez, Jean François Heautot, et al.. Preoperative predictive factors of aneurysmal regression using the reporting standards for endovascular aortic aneurysm repair.. Journal of Vascular Surgery, Elsevier, 2012, 55 (5), pp.1287-95. �10.1016/j.jvs.2011.11.122�. �inserm-00696583�
Preoperative predictive factors of aneurysmal regression
using the reporting standards for endovascular aortic
aneurysm repair
Adrien Kaladji 1, 2, 3, Alain Cardon 1, Issam Abouliatim 1, Boris Campillo-Gimenez 4, 5, 6, 7, Jean François Heautot 8, Jean-Philippe Verhoye 1, 2, 3, 7
1. CHU Rennes, Department of Thoracic and Cardiovascular Surgery, F-35033 Rennes, France
2. INSERM, U642, F-35000 Rennes, France
3. Université de Rennes 1, LTSI, F-35000 Rennes, France
4. CHU Rennes, Department of medical information, F-35033 Rennes, France 5. INSERM, U936, F-35000 Rennes, France
6. Université de Rennes 1, modélisation conceptuelle des connaissances biomédicales, F-35043 Rennes, France
7. Université de Rennes 1, Faculté de médecine, F-35043 Rennes, France 8. CHU Rennes, Department of medical imaging, F-35033 Rennes, France
Corresponding author:
Adrien Kaladji, Service de Chirurgie Vasculaire, CHU Hôpital Pontchaillou, 2 rue Henri Le Guilloux, 35033 Rennes cedex 9, France
ABSTRACT
Background: Aneurysmal regression is a reliable marker for long-lasting success, following endovascular aneurysm repair (EVAR). The aim of this study is to identify the preoperative factors which can predictably lead to aneurysmal sac regression following EVAR, according to the reporting standards of the Society of Vascular Surgery and the International Society of Vascular Surgery (IVS/ISCVS).
Methods: From a total of 199 patients treated by EVAR between 2000 and 2009, 164 completed computerized tomography angiographies (CTA) and duplex scan follow-ups. Moreover, for any patient to be enrolled in this retrospective study, all of his/her CTAs were required to be analyzable with Endosize software (Therenva®, Rennes, France), in order to provide spatially correct three-dimensional data in accordance with the recommendations of the IVS/ISCVS. All anatomic parameters were graded according to the relevant severity grades. From these grades, a severity score was calculated at the aortic neck, the AAA and the iliac arteries. Clinical and demographic factors were also studied. Patients with aneurysmal regression > 5 mm were assigned to group A, and the others were assigned to group B.
Results: Aneurysmal regression occurred in 66 (40.2%) patients (group A). The mean age was 71.4 ± 8.9 years in group A, and 76.3 ± 8.3 in group B. Univariate analyses showed smaller severity scores at the aortic neck (p=0.02) and the iliac arteries (p=0.002) in group A. In group A, calcifications and thrombus were less significant at the aortic neck (p=0.003 and p=0.02) and at the iliac arteries (p=0.001 et p=0.02), and inferior mesenteric artery patency was less frequent (68.2% vs 82.7%, p=0.04). Two multivariate analyses were carried out, of which one considered the scores, and the other was based on the variables included in the scores. In the first, the patients of group A were younger (p=0.002) and aortic neck calcifications were less significant (p=0.007). In the second, the patients of group A were younger (p<0.001) and the aortic neck scores were smaller (p=0.04). There was no difference between the two groups, in terms of the implanted endoprosthesis, nor in the follow-up (46.4 ± 24 months in group A, and 47.2 ± 22 months in group B, p=0.35).
Conclusion: In this study, the young age of the patients and their aortic neck quality, in particular the absence of neck calcification, appear to have been the main factors affecting aneurysm regression, such that they represent a target population for the improvement of EVAR results.
INTRODUCTION
Endovascular aneurysm repair (EVAR) of an abdominal aortic aneurysm (AAA) does not
systematically lead to regression of the AAA sac1. However, such regression is a reliable
marker for long-term success2-6. Regression of the sac is, in particular, a marker for the
absence of further surgery, and for the absence of rupture during follow-up. In order to
improve the results achieved with EVAR, it would seem logical to try to identify any
predictive factors for sac regression. The role of prostheses has been incriminated, particularly
in the case of first generation prostheses7-12. Anatomic factors were also studied. It appears
that less favorable anatomies lead to poorer results13, 14. However, in most studies the
description of these anatomic factors does not comply with the reporting standards15, the
publishing of which was intended to standardize the outcomes of studies dealing with
EVARs. This description has the advantage of analyzing a large number of anatomic factors,
and of providing a sufficient level of detail. An exhaustive and more accurate description of
these factors, in patients presenting with AAA regression, would perhaps also allow EVAR
candidates to be more rigorously selected. The aim of the present study was to identify the
preoperative clinical and anatomic factors, which are predictive of aneurysmal regression
following EVAR, in accordance with the recognized reporting standard.
MATERIAL AND METHODS
From a total of 199 consecutive patients operated in our unit for an infrarenal AAA, between
January 2000 and December 2009, 164 were included in the retrospective study. Image
analysis was carried out using the Endosize16 software (Therenva®, Rennes, France). It was
thus possible to make 3D angular measurements and to compute the tortuosity indices
according to the reporting standards' recommendations. Whenever the preoperative CT image could not be analyzed with this software, it was consequently not possible to carry out all of
the measurements according to the reporting standards, and these patients were excluded from
the study. If the follow-up was incomplete, the patients were also excluded. Finally, 164
patients (147 men, 17 women) could be included in this analysis and in total, 164 aortic necks
and aneurysms and 327 iliac arteries were analyzed (one patient had a single iliac occlusion).
The patients were operated on using the endovascular technique, whenever they were not
eligible for open repair17 and whenever the aneurysm diameter was greater than 50 mm, or if
its growth rate was greater than 1 cm per year, or if it was painful. Infected, inflamed and
ruptured aneurysms were excluded, as were patients operated with a fenestrated or branched
endoprosthesis. A preoperative CT angiography was required before surgery, and at 1, 6, 12,
18 and 24 months of follow-up, after the operation. The patients were then followed-up, with
images being taken every year, alternately by CT angiography or ultrasonography. For the
purposes of the study, the time interval between the last CT image and the operation was
taken to represent the follow-up duration of each patient. The mean interval was 46.8 ± 22.6
months (minimum 18 months; maximum 120 months).
Anatomic factors. All of the measurements were made perpendicularly to the centerlines,
which were extracted automatically (Fig. 1). For the preoperative scan, in addition to the
measurements generally required before ordering an endograft, other parameters were
measured and sorted according to the reporting standards15. The maximum AAA diameter
was always measured at the same cutting level for all of the scans. Each anatomic parameter
was classed according to four grades of severity, from which three anatomic severity scores
were computed (Table 1). The aortic neck score was the sum of the grades determined for the
thrombus, diameter, length, calcifications, and aortic neck angulation. The AAA score was
the sum of the grades determined for the thrombus, the angle, and the T1 ratio (tortuosity
index of the aorta, i.e. the ratio of the length of the aorta from the renal arteries to the aortic
of the AAA collaterals. The iliac score was the sum of the diameter grades, the length, the T2
ratio (Fig. 1) (tortuosity index of the iliac axis, taken from the aortic bifurcation to the
common femoral artery, computed as for the aortic index), the thrombus, the calcifications
and the minimum diameter of the iliac axes.
Non-anatomic factors. In addition to the anatomic parameters, the clinical factors (Table 2),
follow-up duration, type of implanted endoprosthesis, and installation (aorto-bi-iliac or
uni-iliac) were considered. The patients' clinical factors were classed according to the
recommendations15 (Table 2)
Sub group. Group A was comprised of patients who, during follow-up, presented with
> 5 mm2, 15, 18 regression of the aneurysmal sac. The remaining patients were assigned to
group B.
Statistical Analysis. The data is presented in the form of mean ± standard deviation for
quantitative variables, unless otherwise noted, and in the form of numbers with corresponding
percentages for qualitative variables. The predictive factors (clinical and anatomical) for sac
regression were studied using univariate analyses, which were computed using the
Kaplan-Meier method and the log-rank test, since the follow up dates were not the same for all
patients. Anatomic severity scores were considered as ordinal variables and compared with
the Mann-Whitney test. Variables found to be less than 0.1 in the univariate analysis were
included in a multivariate analysis, implemented using a Cox model. A stepwise descending
procedure was carried out. Two multivariate analyses were carried out, with the variables
considered separately or grouped together in scores. We checked the PH assumption for all
covariates of the two models using a graphical approach, by plotting the logarithms of the
cumulative probabilities. Between endografts, the rate of regression was compared using the
anatomic factors related to endoleaks were also computed using the Kaplan-Meier analysis
and the log-rank rank test. Correlation between age and the evolution of the maximum AAA
diameter was assessed with the Pearson correlation coefficient. All analyses were performed
with the Statistica software 6.0 version (Statsoft, Oklahoma, USA), and the statistical level of
significance was 5%.
RESULTS
Demographics. The clinical characteristics of the studied population are provided in Table 3.
The regression rate in the present study was 40.2% (group A, n=66). The regression>5 mm of
the AAA was observed on the postoperative CTA at 15.9 ± 10 months. Using univariate
analysis, age was the only significant factor (Table 1, P < 0.001). The Kaplan-Meier curves
showed that there is a significant difference in regression rate (P=0.005) between the four age
severity grades (Fig. 2) (Table 3). Regression occurred most frequently when the patients' age
corresponded to grade 1 (between 55 and 70 years the regression rate was 58%). For the other
patients, this rate was 33% for those in grade 0, 46% in grade 2, and 23% for those in grade 3.
The postoperative variation of the AAA diameter was found to be correlated with age (Fig. 3)
(P=0.001).
Anatomic factors. The anatomic descriptions are summarized in Table 3.. Concerning the
aortic neck, calcifications and thrombus were less severe in group A (P=0.003 and P=0.02,
respectively). The best regression rate for aortic neck calcifications and thrombus
corresponded to grade 0 (51% and 49% respectively). Similarly, the severity score for the
aortic neck was lower in group A (Table 4) (3.5 ± 2.3 in group A and 4.4 ± 2.5 in group B,
P=0.05). For the AAA score, as well as for all of the parameters used to establish this score,
there was no significant difference between the groups. When the inferior mesenteric artery
of the inferior mesenteric artery (IMA) was lower in group A (P=0.04). In the case of the iliac
arteries, calcifications and thrombus were less severe in group A (P=0.001 and P=0.02,
respectively). The severity score for the iliac arteries was lower for group A (6.5 ± 2.1 in
group A and 7.7 ± 2.3 in group B, P=0.002).
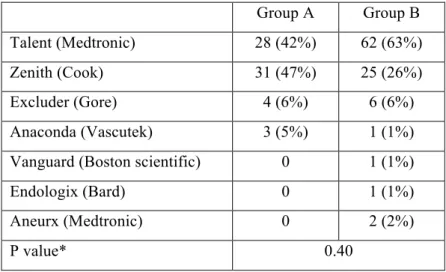
Non anatomic factors. The implanted endoprosthesis distribution is summarized in Table 5.
There was no significant difference between the implanted prostheses in the two groups
(P=0.40). Seven (10.6%) aorto-uni-iliac endoprostheses were implanted in group A, and 15
(15.3%) in group B (P=0.47). The follow-up duration was 46.4 ± 24 months in group A and
47.2 ± 22 months in group B (P=0.35).
Multivariate analysis. In the first multivariate analysis, the age was lower in group A
(P=0.002) and aortic neck calcifications were less severe (P=0.007). The hazard ratios (HR)
and 95% confidence intervals (CI) were 0.96 (95% CI: 0.94-0.98) for age and 0.60 (95% CI:
0.41-0.87) for aortic neck calcifications. In the second analysis, the patients were also
younger in group A (HR 0.96 [95% CI: 0.94-0.98], P<0.001) and the aortic neck score was
lower (HR 0.87 [95% CI: 0.78-0.97], P=0.04).
Postoperative follow-up
Group A was associated with a lower rate of all types of endoleak (Table 6). The occurrence
of a type Ia endoleak during follow up was associated with a higher preoperative aortic neck
severity score (Table 7). Variables at the aortic neck which were significantly more severe
among patients with a type Ia endoleak during follow-up were thrombus (P=0.01) and
calcifications (P=0.01). The occurrence of a type Ib endoleak during follow up was associated
with more complex iliac anatomies especially in terms of angle, tortuosity index,
calcifications and thrombus (Table 8). Patients with a type Ib endoleak had a lower iliac
related factors between patients with a type II endoleak during follow-up and others patients.
When the IMA was considered as a separate variable, the rate of IMA patency was higher
among patients with a type II endoleak (P=0.008).
DISCUSSION
Reporting standards have been published, with a view to normalizing EVAR-related data and
allowing studies to be compared. Indeed, the description of calcifications or thrombus on the
aortic neck varies widely from one study to another. It can be limited to a binary
quantification (present or absent) or, at the other extreme, be segmented with a highly
accurate quantification of the volume of each segment. Studies reporting on regression of the
sac require the analysis of numerous variables. For example, the iliac arteries are rarely
included in the analysis factors for aneurysmal regression. However, they can be the source of
complications, which compromise regression as a consequence of a preoperative pathology.
For this reason, we carried out an exhaustive analysis of all of the preoperative anatomic
parameters. We modified some of the risk scores described in the reporting standards since
we wished, for example, to unite all of the variables relating to iliac arteries into one single
anatomic severity score. Two multivariate analyses were thus necessary, since it was our aim
not only to accurately identify each individual factor, but also to evaluate the overall anatomic
zone (aortic neck, AAA and iliac arteries) on a global basis, i.e. through the use of a single
score.
In this study, age appears to have a non negligible influence on regression of the aneurysmal
sac. In most studies, this outcome has not been clearly identified as a factor influencing
regression. Quite commonly, various authors have tried to identify factors influencing the
progression of the sac following EVAR, and have found an advanced age to be a risk factor,
years is one of these factors, and is well correlated with the reporting standard severity grade15
(grade 3). The same result was found by Ouriel et al.20, who recognized that a lower
regression rate was found when the patients' age increased. Although the definitions for
regression can vary, Houballah et al.21 found a lower mean age in the group of patients who
presented with sac regression. Since age was not found to be a predictive factor for regression
in all studies, we tried to corroborate our results using survival analyses, which appear to be
the most appropriate approach when the history of each patient is different. It is nevertheless
important to note that the highest regression rate is not found in the patients belonging to
grade 0. However, a small number of patients (6) in our study had this grade. Moreover,
analysis of survival age reveals a difference, especially between grades 1 and 3 and we found
a significant correlation between age and the postoperative evolution of the AAA diameter.
This outcome thus suggests that there is a relationship between age and postoperative sac
evolution, in agreement in agreement with the findings of other authors19-21. An explanation
for the influence of age on regression could lie in the fact that arterial compliance decreases
with age22, and that calcifications are partly responsible23. Furthermore, young patients often
have less arterial calcification24 such that, although it has not been scientifically demonstrated,
it would be reasonable to expect that the regression capacity of an aneurysm is partly
dependent on these factors, in the absence of any endoleaks. Although we did not quantify
calcifications of the AAA itself, it has been shown that the degree of calcification of an AAA
is a predictive factor of the natural history of small AAAs25, which again supports the possible
role of calcifications in the sac regression process. In addition, in our study calcification is
one of the significant predictive factors for regression, in univariate and multivariate analysis.
However, one of the limitations of this study is that of quantifying calcifications. Although we
adhered to the reporting standards, it is clear that the evaluation of calcification, based simply
the degree of calcification in a given anatomic zone. Segmentation algorithms with better
performance, which would not be particularly useful in routine applications, such as EVAR
planning, should nevertheless be implemented into the software, in order to provide more
accurate quantification.
Concerning the anatomic factors assessed in our study, it is not surprising that in the
multivariate analyses, we systematically found the aortic neck to be a significant variable.
Here, the absence of calcifications (grade 0) appears to have a particular influence on sac
regression. Their presence clearly compromises the proximal attachment zone and increases
the risk of an endoleak as shown by the comparison between patients with or without a type Ia
endoleak during follow-up. Although the other parameters related to the aortic neck are non
significant (except for the case of thrombus, in univariate analysis), it is interesting to observe
that the aortic neck score is significant. Taking all factors into account appears to be a more
strongly influential element on sac regression, than each parameter considered individually.
This is also true and largely accepted in the case of the risk of postoperative complications26.
Although it is not the case in the present study, in most studies the length of the aortic neck is
the factor having the greatest influence on postoperative changes in diameter9, 14, 19. The
presence of thrombus on the aortic neck has also been identified by other authors as being a
factor contributing to non-regression13, 27. The indication for an EVAR on complex aortic
necks, using current endoprostheses, thus increases the risk of non-regression, such that the
manufacturers' instructions must be adhered to, if a satisfactory result is to be achieved.
Schanzer et al. (19) have revealed a significant rate of disregard for these indications, which
could explain the high rate of aortic neck growth observed in their study, which is the largest
existing meta-analysis on this subject.
The size and thrombus of an AAA have also been analyzed in several studies, with differing
on its regression. On the one hand, some authors11, 28 did not find any influence of
preoperative diameter on sac regression, and on the other hand, it appears that the larger the
aneurysm, the less it regresses21, 29. Finally, Greenberg et al.10 found that the AAAs which are
the largest at the surface have the greatest regression in absolute and relative terms.
Concerning aneurysmal thrombosis, Yeung et al.27 found that the absence of preoperative
thrombosis, associated with the absence of an early endoleak, was a good indicator for sac
regression. However, when there is no thrombus in the sac, the IMA as well as a high number
of lumbar arteries are often permeable, which is a factor for a type II endoleak30, 31. In our
study, the permeability of the IMA appears to have an influence on sac regression in
univariate analysis and on the occurrence of a type II endoleak. Preoperative embolization
could then be considered as a complementary intervention, which would increase the rate of
sac regression following EVAR. However, Nevala et al.10 have shown that there was a
decrease in the rate of an early type 2 endoleak, but no increase in sac regression. In the
present study, we find that patients with a permeable IMA have a lower probability of having
a sac regression due to a greater probability of developing a type II endoleak whereas when
aneurysm sac collaterals were graded according to the reporting standard, no difference is
observed. This result can be explained by the fact that the majority of our patients was classed
in severity grades 2 or 3, which may highlight one of the limitations of this grading system,
indicating that it could be too severe for the description of the AAA collaterals. Finally, as in
our own study, Blankenstein et al.33 did not find an influence of preoperative aneurysmal
thrombus on sac regression.
The last point, which has also been studied by several authors, is the influence of the
endografts. Here, we were not able to demonstrate any difference between endografts,
probably because the vast majority of implanted devices are represented by two different
implanted, since most of our unit's activities began at the time when these two models were
available on the market. Although Ouriel et al.7 found very significant differences between
endografts in their series, the Talent and Zenith models had the same regression rate.
Greenberg et al.10 found higher regression rates with the Zenith, as compared to the Ancure
and Excluder models. Bertges et al.11 found the highest regression rates with the Talent
model, at 1 and 2 years, as compared to the Ancure, Excluder and Aneurx models. The Talent
and the Zenith are thus likely to be the endografts having the best regression rates or having
no statistically significant difference in our series. This result was also found by Badger et al.
who compared these two endografts34.
Several limitations can be found in our series. It is a retrospective study, and a certain number
of operated patients could not be included in our analyses, which constitutes a selection bias.
In addition, the follow-up dates were not the same for all of the patients, which is the reason
for which we conducted survival analyses rather than logistical regressions at a date point.
Finally, the AAA diameter measurement method and the threshold for defining regression are
also subjects of debate. Wever et al. 35 have shown that volumetry was more appropriate for
the follow-up of EVARs, but when the maximum diameter varies by ± 6%, the correlation
with volume is correct. By choosing a threshold of 5 mm2, 15, 18 on the aneurysm, the mean
diameter of which was 55.9 mm in our series, a variation of at least 10% is found, which is
considered by several authors to be a reliable figure. In addition, volumetry is not a routine
measurement and requires time and the availability of an appropriate workstation. Houballah
et al.21 have proposed another definition for shrinkage, with the aim of identifying it as a
CONCLUSION
The use of the reporting standard and the anatomic severity grades provides a reliable tool for
the description of objective anatomic criteria before EVAR and in our opinion should be more
widely used in studies dealing with EVAR. In the present study, age seems to be influent on
aneurysmal sac evolution. Younger patients could have a higher rate of aneurysmal sac
regression than other patients because of a lower rate of endoleaks. The quality of the aortic
neck, in particular the absence of calcification, appears to be a determinant factor. The best
long-term EVAR results probably occur in this population of relatively young patients having
a good anatomy. New endoprostheses (Endurant, Medtronic and Zenith LP, Cook), which are
designed for more complex anatomies, will perhaps allow such results to be obtained.
Acknowledgements
The authors are indebted to the Centre of Clinical Investigation and Technological Innovation
804 for its support in the processing of imaging datas.
No competing interests are declared
REFERENCES
1. Brewster DC, Jones JE, Chung TK, Lamuraglia GM, Kwolek CJ, Watkins MT, et al.
Long-term outcomes after endovascular abdominal aortic aneurysm repair: the first decade.
Ann Surg. 2006 Sep;244(3):426-38.
2. Ahn SS, Rutherford RB, Johnston KW, May J, Veith FJ, Baker JD, et al. Reporting
standards for infrarenal endovascular abdominal aortic aneurysm repair. Ad Hoc Committee
for Standardized Reporting Practices in Vascular Surgery of The Society for Vascular
Surgery/International Society for Cardiovascular Surgery. J Vasc Surg. 1997
3. Broeders IA, Blankensteijn JD, Gvakharia A, May J, Bell PR, Swedenborg J, et al.
The efficacy of transfemoral endovascular aneurysm management: a study on size changes of
the abdominal aorta during mid-term follow-up. Eur J Vasc Endovasc Surg. 1997
Aug;14(2):84-90.
4. Rhee RY, Eskandari MK, Zajko AB, Makaroun MS. Long-term fate of the aneurysmal
sac after endoluminal exclusion of abdominal aortic aneurysms. J Vasc Surg. 2000
Oct;32(4):689-96.
5. Matsumura JS, Pearce WH, McCarthy WJ, Yao JS. Reduction in aortic aneurysm size:
early results after endovascular graft placement. EVT Investigators. J Vasc Surg. 1997
Jan;25(1):113-23.
6. Lee JT, Aziz IN, Haukoos JS, Donayre CE, Walot I, Kopchok GE, et al. Volume
regression of abdominal aortic aneurysms and its relation to successful endoluminal
exclusion. J Vasc Surg. 2003 Dec;38(6):1254-63.
7. Ouriel K, Clair DG, Greenberg RK, Lyden SP, O'Hara PJ, Sarac TP, et al.
Endovascular repair of abdominal aortic aneurysms: device-specific outcome. J Vasc Surg.
2003 May;37(5):991-8.
8. Harris P, Brennan J, Martin J, Gould D, Bakran A, Gilling-Smith G, et al.
Longitudinal aneurysm shrinkage following endovascular aortic aneurysm repair: a source of
intermediate and late complications. J Endovasc Surg. 1999 Feb;6(1):11-6.
9. Becquemin JP, Lapie V, Favre JP, Rousseau H. Mid-term results of a second
generation bifurcated endovascular graft for abdominal aortic aneurysm repair: the French
10. Greenberg RK, Deaton D, Sullivan T, Walker E, Lyden SP, Srivastava SD, et al.
Variable sac behavior after endovascular repair of abdominal aortic aneurysm: analysis of
core laboratory data. J Vasc Surg. 2004 Jan;39(1):95-101.
11. Bertges DJ, Chow K, Wyers MC, Landsittel D, Frydrych AV, Stavropoulos W, et al.
Abdominal aortic aneurysm size regression after endovascular repair is endograft dependent. J
Vasc Surg. 2003 Apr;37(4):716-23.
12. van der Laan MJ, Prinssen M, Bertges D, Makaroun MS, Blankensteijn JD. Does the
type of endograft affect AAA volume change after endovascular aneurysm repair? J Endovasc
Ther. 2003 Jun;10(3):406-10.
13. Fairman RM, Nolte L, Snyder SA, Chuter TA, Greenberg RK. Factors predictive of
early or late aneurysm sac size change following endovascular repair. J Vasc Surg. 2006
Apr;43(4):649-56.
14. Leurs LJ, Kievit J, Dagnelie PC, Nelemans PJ, Buth J. Influence of infrarenal neck
length on outcome of endovascular abdominal aortic aneurysm repair. J Endovasc Ther. 2006
Oct;13(5):640-8.
15. Chaikof EL, Fillinger MF, Matsumura JS, Rutherford RB, White GH, Blankensteijn
JD, et al. Identifying and grading factors that modify the outcome of endovascular aortic
aneurysm repair. J Vasc Surg. 2002 May;35(5):1061-6.
16. Kaladji A, Lucas A, Kervio G, Haigron P, Cardon A. Sizing for endovascular
aneurysm repair: clinical evaluation of a new automated three-dimensional software. Ann
17. Long A, Perez-Niddam K, Maisonneuve H. [Abdominal aortic aneurysm repair treated
with endoprosthesis: technical and economic evaluation by ANAES(National Agency of
Health Accreditation and Evaluation)]. J Mal Vasc. 2000 Oct;25(4):263-9.
18. Lederle FA, Wilson SE, Johnson GR, Reinke DB, Littooy FN, Acher CW, et al.
Variability in measurement of abdominal aortic aneurysms. Abdominal Aortic Aneurysm
Detection and Management Veterans Administration Cooperative Study Group. J Vasc Surg.
1995 Jun;21(6):945-52.
19. Schanzer A, Greenberg RK, Hevelone N, Robinson WP, Eslami MH, Goldberg RJ, et
al. Predictors of abdominal aortic aneurysm sac enlargement after endovascular repair.
Circulation. 2011 Jun 21;123(24):2848-55.
20. Ouriel K, Greenberg RK, Clair DG, O'Hara P J, Srivastava SD, Lyden SP, et al.
Endovascular aneurysm repair: gender-specific results. J Vasc Surg. 2003 Jul;38(1):93-8.
21. Houbballah R, Majewski M, Becquemin JP. Significant sac retraction after
endovascular aneurysm repair is a robust indicator of durable treatment success. J Vasc Surg.
2010 Oct;52(4):878-83.
22. Sonesson B, Hansen F, Stale H, Lanne T. Compliance and diameter in the human
abdominal aorta--the influence of age and sex. Eur J Vasc Surg. 1993 Nov;7(6):690-7.
23. Speelman L, Bohra A, Bosboom EM, Schurink GW, van de Vosse FN, Makaorun MS,
et al. Effects of wall calcifications in patient-specific wall stress analyses of abdominal aortic
aneurysms. J Biomech Eng. 2007 Feb;129(1):105-9.
24. Matsushita M, Nishikimi N, Sakurai T, Nimura Y. Relationship between aortic
calcification and atherosclerotic disease in patients with abdominal aortic aneurysm. Int
25. Lindholt JS. Aneurysmal wall calcification predicts natural history of small abdominal
aortic aneurysms. Atherosclerosis. 2008 Apr;197(2):673-8.
26. Fairman RM, Velazquez OC, Carpenter JP, Woo E, Baum RA, Golden MA, et al.
Midterm pivotal trial results of the Talent Low Profile System for repair of abdominal aortic
aneurysm: analysis of complicated versus uncomplicated aortic necks. J Vasc Surg. 2004
Dec;40(6):1074-82.
27. Yeung JJ, Hernandez-Boussard TM, Song TK, Dalman RL, Lee JT. Preoperative
thrombus volume predicts sac regression after endovascular aneurysm repair. J Endovasc
Ther. 2009 Jun;16(3):380-8.
28. Ouriel K, Srivastava SD, Sarac TP, O'Hara P J, Lyden SP, Greenberg RK, et al.
Disparate outcome after endovascular treatment of small versus large abdominal aortic
aneurysm. J Vasc Surg. 2003 Jun;37(6):1206-12.
29. Zarins CK, Crabtree T, Bloch DA, Arko FR, Ouriel K, White RA. Endovascular
aneurysm repair at 5 years: Does aneurysm diameter predict outcome? J Vasc Surg. 2006
Nov;44(5):920-29; discussion 9-31.
30. Abularrage CJ, Crawford RS, Conrad MF, Lee H, Kwolek CJ, Brewster DC, et al.
Preoperative variables predict persistent type 2 endoleak after endovascular aneurysm repair.
J Vasc Surg. 2010 Jul;52(1):19-24.
31. AbuRahma AF, Mousa AY, Campbell JE, Stone PA, Hass SM, Nanjundappa A, et al.
The relationship of preoperative thrombus load and location to the development of type II
endoleak and sac regression. J Vasc Surg. 2011 Jun;53(6):1534-41.
32. Nevala T, Biancari F, Manninen H, Matsi P, Makinen K, Ylonen K, et al. Inferior
effect on type II endoleak and aneurysm shrinkage. J Vasc Interv Radiol. 2010
Feb;21(2):181-5.
33. Blankensteijn JD, Prinssen M. Does fresh clot shrink faster than preexistent mural
thrombus after endovascular AAA repair? J Endovasc Ther. 2002 Aug;9(4):458-63.
34. Badger SA, O'Donnell ME, Loan W, Hannon RJ, Lau LL, Lee B, et al. No difference
in medium-term outcome between Zenith and Talent stent-grafts in endovascular aneurysm
repair. Vasc Endovascular Surg. 2007 Dec-2008 Jan;41(6):500-5.
35. Wever JJ, Blankensteijn JD, Th MMWP, Eikelboom BC. Maximal aneurysm diameter
follow-up is inadequate after endovascular abdominal aortic aneurysm repair. Eur J Vasc
Table 1. Definition of each anatomic grade according to the reporting standard and the severity scores used
Anatomic severity grades
Attribute 0=Absent 1=Mild 2=Moderate 3=Severe
Aortic Neck
Length (L1), mm L1>25 15<L1<25 10<L1<15 L1<10 Diameter (D1), mm D1<24 24<D1<26 26<D1<28 D1>28 Angle (A1), ° A1>150 150< A1<135 135< A1<120 A1<120 Calcifications (Ca1), % Ca1<25 25 <Ca1<50 Ca1>50
Thrombus (Th1), % Th1<25 25 <Th1<50 Th1>50 Aortic Neck Severity Score (/15) = L1+D1+A1+Ca1+Th1 grades Aneurysm
Tortuosity index (T1) T1<1.05 1.05<T1<1.15 1.15<T1<1.2 T1>1.2 Aortic angle (A2), ° 160<A2<180 140<A2<159 120<A2<139 A2<120
Thrombus (Th2), % 0 Th2<25 25<Th2<50 Th2>50
Aortic branches (AB) None 1 lumbar/IMA 2 vessels<4 mm 2 vessels >4 mm
Aneurysm Severity Score (/12) =T1+A2+Th2+AB grades
Iliac artery
Calcification (Ca2), % None Ca2<25 25< Ca2<50 Ca2>50 Thrombus (Th3), % Th3<25 25<Th3<50 Th3>50
Length (L2), mm L2<30 20< L2<30 10< L2<20 L2<10 Diameter (D2), mm D2<12.5 12.5< D2<14.4 14.5< D2<17 D2>17 Tortuosity index (T2) T2<1.25 1.25<T2<1.5 1.5<T2<1.6 T2>1.6 Iliac angle (A3), ° 160<A3<180 121<A3<159 90<A3<120 <90 Access diameter (AD), mm AD>10 8<AD<10 7<AD<8 AD<7 Iliac artery Severity Score (/21) =Ca2+Th3+L2+D2+T2+A3+AD grades
Table 2. IVS/ISCVS medical comorbidity grading system Major components
Cardiac status
Grade 0 Asymptomatic, with normal electrocardiogram
Grade 1 Asymptomatic but with either remote myocardial infarction by history (6 months), occult myocardial infarction by electrocardiogram, or fixed defect on dipyridamole thallium or similar scan
Grade 2 Any one of the following: stable angina, no angina but significant reversible perfusion defect on dipyridamole thallium scan, significant silent ischemia (1% of time) on Holter monitoring, ejection fraction 25% to 45%, controlled ectopy or asymptomatic
arrhythmia, or history of congestive heart failure that is now well compensated Grade 3 Any one of the following: unstable angina, symptomatic or poorly controlled
ectopy/arrhythmia (chronic/recurrent), poorly compensated or recurrent congestive heart failure, ejection fraction less than 25%, myocardial infarction within 6 months
Pulmonary status
Grade 0 Asymptomatic, normal chest radiograph, pulmonary function tests within 20% of predicted
Grade 1 Asymptomatic or mild dyspnea on exertion, mild chronic parenchymal radiograph changes, pulmonary function tests 65% to 80% of predicted
Grade 2 Between 1 and 3
Grade 3 Vital capacity less than 1.85 L, FEV1 less than 1.2 L or less than 35% of predicted, maximal voluntary ventilation less than 50% of predicted, PCO2 greater than 45 mm Hg, supplemental oxygen use medically necessary, or pulmonary hypertension
Renal status
Grade 0 No known renal disease, normal serum creatinine level Grade 1 Moderately elevated creatinine level, as high as 2.4 mg/dL Grade 2 Creatinine level, 2.5 to 5.9 mg/dL
Grade 3 Creatinine level greater than 6.0 mg/dL, or on dialysis or with kidney transplant Minor components
Hypertension
Grade 0 None (cutoff point, diastolic pressure usually lower than 90 mm Hg)
drug
Grade 2 Controlled with two drugs
Grade 3 Requires more than two drugs or uncontrolled Age
Grade 0 <55 years Grade 1 55-69 years Grade 2 70-79 years Grade 3 >80 years
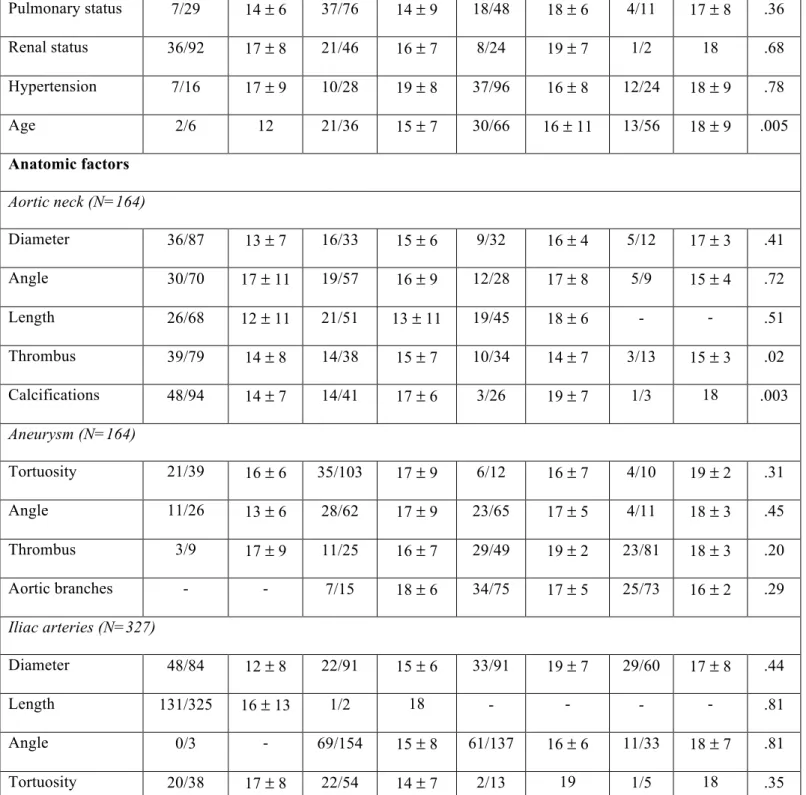
Table 3. The clinical and anatomical variables (graded according to the reporting standard) are compared between group A and B by an univariate analysis (log-rank test).
Grade 0 Grade 1 Grade 2 Grade 3
n/N Mean ± SD* n/N Mean ± SD* n/N Mean ± SD* n/N Mean ± SD* P Medical comorbidities Cardiac status 11/29 13 ± 8 18/44 14 ± 8 21/56 15 ± 11 16/35 20 ± 11 .97 Pulmonary status 7/29 14 ± 6 37/76 14 ± 9 18/48 18 ± 6 4/11 17 ± 8 .36 Renal status 36/92 17 ± 8 21/46 16 ± 7 8/24 19 ± 7 1/2 18 .68 Hypertension 7/16 17 ± 9 10/28 19 ± 8 37/96 16 ± 8 12/24 18 ± 9 .78 Age 2/6 12 21/36 15 ± 7 30/66 16 ± 11 13/56 18 ± 9 .005 Anatomic factors Aortic neck (N=164) Diameter 36/87 13 ± 7 16/33 15 ± 6 9/32 16 ± 4 5/12 17 ± 3 .41 Angle 30/70 17 ± 11 19/57 16 ± 9 12/28 17 ± 8 5/9 15 ± 4 .72 Length 26/68 12 ± 11 21/51 13 ± 11 19/45 18 ± 6 - - .51 Thrombus 39/79 14 ± 8 14/38 15 ± 7 10/34 14 ± 7 3/13 15 ± 3 .02 Calcifications 48/94 14 ± 7 14/41 17 ± 6 3/26 19 ± 7 1/3 18 .003 Aneurysm (N=164) Tortuosity 21/39 16 ± 6 35/103 17 ± 9 6/12 16 ± 7 4/10 19 ± 2 .31 Angle 11/26 13 ± 6 28/62 17 ± 9 23/65 17 ± 5 4/11 18 ± 3 .45 Thrombus 3/9 17 ± 9 11/25 16 ± 7 29/49 19 ± 2 23/81 18 ± 3 .20 Aortic branches - - 7/15 18 ± 6 34/75 17 ± 5 25/73 16 ± 2 .29 Iliac arteries (N=327) Diameter 48/84 12 ± 8 22/91 15 ± 6 33/91 19 ± 7 29/60 17 ± 8 .44 Length 131/325 16 ± 13 1/2 18 - - - - .81 Angle 0/3 - 69/154 15 ± 8 61/137 16 ± 6 11/33 18 ± 7 .81 Tortuosity 20/38 17 ± 8 22/54 14 ± 7 2/13 19 1/5 18 .35
Thrombus 69/141 11 ± 7 42/128 16 ± 8 11/48 17 ± 8 5/10 16 ± 3 .02
Calcifications 53/94 15 ± 8 59/147 16 ± 8 20/77 15 ± 8 0/10 - .001
Minimum 10/35 13 ± 11 82/183 17 ± 10 23/74 15 ± 7 18/35 16 ± 9 .48 n/N, number with sac regression/total
Table 4. Comparison of the anatomic severity score between group A and B.
Total population (n=164) Group A (n=66) Group B (n=98) P Aortic neck severity
score (/15) 4 ± 2.4 3.5 ± 2.3 4.4 ± 2.5 0.02
Aneurysm severity score
(/12) 6.9 ± 1.9 6.6 ± 1.8 7.1 ± 1.9 0.06
Iliac artery severity
Table 5. Endoprosthesis implanted in each group. Group A Group B Talent (Medtronic) 28 (42%) 62 (63%) Zenith (Cook) 31 (47%) 25 (26%) Excluder (Gore) 4 (6%) 6 (6%) Anaconda (Vascutek) 3 (5%) 1 (1%)
Vanguard (Boston scientific) 0 1 (1%)
Endologix (Bard) 0 1 (1%)
Aneurx (Medtronic) 0 2 (2%)
P value* 0.40
Table 6. Rates of endoleaks in group A and B (log-rank-test).
Total (n=164) Group A (n=66) Group B (n=98) P
Type Ia endoleak 13 (7.9%) 1 (1.5%) 12 (12.2%) 0.012
Type Ib endoleak 7 (4.3%) 0 7 (4.3%) 0.032
Table 7. Comparison of the anatomic severity scores between patients with or without an endoleak during follow-up
Endoleak No endoleak P
Aortic neck severity score (/15) –Type Ia endoleak (n=10)
6.9 ± 2.6 3.8 ± 2.3 <0.0001
Aneurysm severity score (/12)-Type II endoleak (n=33)
7.2 ± 1.7 6.8 ± 1.8 0.33
Iliac artery severity score (/21)-Type Ib endoleak (n=7)
Table 8. The anatomical variables are compared between patients with or without an endoleak during follow-up by an univariate analysis (log-rank test).
Grade 0 Grade 1 Grade 2 Grade 3
n/N Mean ± SD* n/N Mean ± SD* n/N Mean ± SD* n/N Mean ± SD* P
Aortic neck-Type Ia endoleak
Diameter 0/87 - 1/33 12 8/32 54 ± 20 4/12 36 ± 24 .10 Angle 0/70 5/57 31 ± 30 3/28 20 ± 12 5/9 25 ± 7 .10 Length 2/68 24 5/51 36 ± 11 6/45 44 ± 35 - - .08 Thrombus 0/79 - 2/38 41 5/34 48 ± 12 6/13 22 ± 7 .01 Calcifications 0/94 - 0/41 - 11/26 19 ± 7 2/3 18 .01 Aneurysm-Type II endoleak Tortuosity 11/39 5 ± 6 15/103 6 ± 8 3/12 6 ± 7 4/10 6 ± 4 .75 Angle 4/26 5 ± 9 12/62 6 ± 4 13/65 7 ± 10 4/11 4 ± 4 .44 Thrombus 3/9 3 ± 3 6/25 6 ± 7 7/49 4 ± 4 17/81 7 ± 9 .25 Aortic branches - - 2/15 3 15/75 3 ± 4 16/73 7 ± 9 .21
Iliac arteries-Type Ib endoleak
Diameter 1/84 21 1/91 28 2/91 51 3/60 24 ± 17 .14 Length 6/325 34 ± 27 1/2 28 - - - - .06 Angle 0/3 - 1/154 48 2/137 21 4/33 18 ± 7 .01 Tortuosity 0/38 - 2/54 24 2/13 19 3/5 18 ± 8 <0.001 Thrombus 0/141 - 1/128 36 5/48 28 ± 8 1/10 48 .02 Calcifications 0/94 - 0/147 - 5/77 31 ± 16 2/10 29 <0.001 Minimum 1/35 21 3/183 26 ± 12 2/74 21 1/35 37 .26
n/N, number with endoleak/total
Figures
Figure 2. Proportion of patients with aneurysm shrinkage (>5mm) according to the grading age defined in the reporting standard.
Months 6 18 36 48 60 72 84 96 120 Grade 0 N at risk Regressiona Censorship %b 6 2 1 100 3 0 1 67 2 0 0 67 2 0 0 67 2 0 0 67 2 0 2 67 0 0 0 67 Grade 1 N at risk Regression Censorship % 35 17 1 100 17 3 2 51 12 1 2 41 9 0 3 37 6 0 4 37 2 0 1 37 1 0 0 42 1 0 1 42 0 0 0 42 Grade 2 N at risk Regression 78 25 49 2 45 6 27 1 18 0 11 0 4 0 0 0
Censorship % 4 100 2 67 12 65 8 55 7 53 7 53 4 53 0 53 Grade 3 N at risk Regression Censorship % 45 7 3 100 35 1 10 84 24 1 11 81 12 0 2 77 10 0 3 77 7 0 3 77 4 0 3 77 1 0 0 77 1 0 1 77 a
number of patients with sac regression, bpercent of patients without sac regression !