HAL Id: hal-01774360
https://hal.archives-ouvertes.fr/hal-01774360
Submitted on 1 Jun 2018
HAL is a multi-disciplinary open access
archive for the deposit and dissemination of
sci-entific research documents, whether they are
pub-lished or not. The documents may come from
teaching and research institutions in France or
abroad, or from public or private research centers.
L’archive ouverte pluridisciplinaire HAL, est
destinée au dépôt et à la diffusion de documents
scientifiques de niveau recherche, publiés ou non,
émanant des établissements d’enseignement et de
recherche français ou étrangers, des laboratoires
publics ou privés.
Genetic Code Optimization for Cotranslational Protein
Folding: Codon Directional Asymmetry Correlates with
Anti parallel Betasheets, tRNA Synthetase Classes
Herve Seligmann, Ganesh Warthi
To cite this version:
Herve Seligmann, Ganesh Warthi. Genetic Code Optimization for Cotranslational Protein
Fold-ing: Codon Directional Asymmetry Correlates with Anti parallel Betasheets, tRNA Synthetase
Classes.
Computational and Structural Biotechnology Journal, Elsevier, 2017, 15, pp.412-424.
Genetic Code Optimization for Cotranslational Protein Folding: Codon
Directional Asymmetry Correlates with Antiparallel Betasheets, tRNA
Synthetase Classes
Hervé Seligmann
a,b,⁎
, Ganesh Warthi
aaAix-Marseille Univ, Unité de Recherche sur les Maladies Infectieuses et Tropicales Emergentes, UM 63, CNRS UMR7278, IRD 198, INSERM U1095, Institut Hospitalo-Universitaire
Méditerranée-Infection, Marseille, Postal code 13385, France
b
Dept. Ecol Evol Behav, Alexander Silberman Inst Life Sci, The Hebrew University of Jerusalem, IL-91904 Jerusalem, Israel
a b s t r a c t
a r t i c l e i n f o
Article history: Received 25 May 2017
Received in revised form 20 July 2017 Accepted 5 August 2017
Available online 12 August 2017
A new codon property, codon directional asymmetry in nucleotide content (CDA), reveals a biologically meaningful genetic code dimension: palindromic codons (first and last nucleotides identical, codon structure XZX) are symmet-ric (CDA = 0), codons with structures ZXX/XXZ are 5′/3′ asymmetric (CDA = −1/1; CDA = −0.5/0.5 if Z and X are both purines or both pyrimidines, assigning negative/positive (−/+) signs is an arbitrary convention). Negative/ positive CDAs associate with (a) Fujimoto's tetrahedral codon stereo-table; (b) tRNA synthetase class I/II (aminoacylate the 2′/3′ hydroxyl group of the tRNA's last ribose, respectively); and (c) high/low antiparallel (not parallel) betasheet conformation parameters. Preliminary results suggest CDA-whole organism associations (body temperature, developmental stability, lifespan). Presumably, CDA impacts spatial kinetics of codon-anticodon interactions, affecting cotranslational protein folding. Some synonymous codons have opposite CDA sign (alanine, leucine, serine, and valine), putatively explaining how synonymous mutations sometimes affect protein function. Correlations between CDA and tRNA synthetase classes are weaker than between CDA and antiparallel betasheet conformation parameters. This effect is stronger for mitochondrial genetic codes, and potentially drives mitochon-drial codon-amino acid reassignments. CDA reveals information ruling nucleotide-protein relations embedded in reversed (not reverse-complement) sequences (5′-ZXX-3′/5′-XXZ-3′).
© 2017 The Authors. Published by Elsevier B.V. on behalf of Research Network of Computational and Structural Biotechnology. This is an open access article under the CC BY license (http://creativecommons.org/licenses/by/4.0/).
Keywords: Secondary structure Codon-amino acid assignment Mitochondrial genetic code Synonymous codon Alpha helix Beta turn
1. Introduction
The genetic code is optimised along several dimensions. Correlations between codon and amino acid properties have frequently been interpreted as resulting from evolutionary optimizations of the genetic code's codon-amino acid assignments. These minimise effects of: replicational/transcriptional nucleotide substitutions on amino acid hydrophobicity[1–11]and along multiple properties[12]. The genetic code is also optimised in relation to other processes, such as tRNA misloading with non-cognate amino acids[13–16]; ribosomal frame-shifts[17–23]; and protein folding kinetics[24–26].
Another approach assumes that the genetic code coevolved with codon/amino acid metabolic pathways[27–31]. It remains unclear whether genetic code optimizations are circumstantial byproducts of
the metabolic coevolution hypothesis[32–36], or whether some combi-nation of both processes produced the genetic code[34,37–42].
Here we present a previously unknown dimension of the genetic code. Analyses suggest that the genetic code is optimised in relation to this new property. The property reflects differences between nucleo-tides atfirst versus second codon positions, as compared to differences between nucleotides at third versus second codon positions. In this context, previous analyses[43]showed that the subtraction of dipole moments of nucleotides atfirst and second codon positions correlate with hydrophobicities of corresponding amino acids, after accounting for another, previously reported, correlation between codon and amino acid hydrophobicities[44,45]. Here analyses generalise the prin-ciple to all codon positions and nucleotide properties.
2. Codon Directional Asymmetry
The new codon property is derived from comparing two differences in nucleotide contents, the difference between nucleotides atfirst and second codon positions, and the difference between nucleotides at second and third codon positions. This defines a codon's directional
⁎ Corresponding author at: Aix-Marseille Univ, Unité de Recherche sur les Maladies Infectieuses et Tropicales Emergentes, UM 63, CNRS UMR7278, IRD 198, INSERM U1095, Institut Hospitalo-Universitaire Méditerranée-Infection, Marseille, Postal code 13385, France.
E-mail address:[email protected](H. Seligmann).
http://dx.doi.org/10.1016/j.csbj.2017.08.001
2001-0370/© 2017 The Authors. Published by Elsevier B.V. on behalf of Research Network of Computational and Structural Biotechnology. This is an open access article under the CC BY license (http://creativecommons.org/licenses/by/4.0/).
Contents lists available atScienceDirect
asymmetry in nucleotide content, CDA. CDA reflects semi-quantitatively extents by which a nucleotide at either 5′ or 3′ codon extremity differs from the codon's two remaining nucleotides. Along this principle, palindromic codons with the same nucleotide at 5′ and 3′ extremities (atfirst and third positions, XZX (including codons with X = Z)) are symmetric, CDA = 0. When the nucleotide at the 5′ extremity belongs to a different nucleotide group (purine/pyrimidine) than the two other positions and the latter are identical (ZXX), CDA =−1. When the nucleotide at the 3′ extremity differs from other positions (XXZ), CDA = + 1. Signs for 5′-and 3′-dominant CDAs are arbitrary, but necessarily opposite (positive versus negative).
2.1. Purines and Pyrimidines
For codons of types ZXX/XXZ, CDA =−0.5/+0.5, when both X and Z are purines, or both pyrimidines. This reflects lesser purine-purine and pyrimidine-pyrimidine structural differences than for purine-pyrimidine comparisons. This principle assigns a CDA score also for some codons of type XZW, where all three nucleotides differ, and Z belongs to the same chemical group (purine or pyrimidine) as the nucleotide at either codon extremity. For codons where nucleotides Z and W are both purines/pyrimidines, X is the most different nucleotide (CDA =−0.5), because chemical structural differences between X and Z are greater than between W and Z. According to that rationale, for co-dons where nucleotides X and Z are both purines (or both pyrimidines), W is the most different nucleotide (CDA = +0.5).
2.2. Complementarity Between Nucleotides at Different Codon Positions
For some codons with structure XZW, Z does not belong to the same group (in terms of purines/pyrimidines) as any nucleotide at the other positions. In these cases, an additional rule determines which of the nu-cleotides among X or W, differs more from the two others. We propose that complementarity between canonical base pairs (C:G and A:T/U) defines that complementary nucleotide pairs are the most different pairs. Hence for codons with structure XZW, CDA =−0.5 and CDA = + 0.5 when X is the canonical complement of Z, and when W is the complementary of Z, respectively. This rule set defines CDA for all 64 codons (Table 1).
3. A New Dimension of the Genetic Code
The distribution of CDA inTable 1is symmetric. Therefore, the ge-netic code table could probably be reordered so as to reveal graphically this symmetry, as done for other symmetry properties of the genetic code[46].
To what extent does CDA represent a dimension of the genetic code that is independent of other dimensions? In this respect, we compare
Table 1with the binary representation of the genetic code [47, therein fig-ure 6], a rather complete 6-bit representation of each codon. It assigns to each codon position two binary values, thefirst representing the purine-pyrimidine divide, the second value represents whether the nucleotide forms two or three hydrogen interactions when in duplex conformation with an inverse-complementary strand. This defines two binary variables for each codon position, hence six binary variables for each codon.
Pearson correlation coefficients r of CDA with any of these six binary codon properties are‘zero’, indicating that CDA is independent of each of these properties. Correlations with sums and subtractions between any pairs of these six binary values also yield r = 0. Results are identical if one pairs nucleotides according to keto versus amino nucleotides as previously reported[47,48]. This means that CDA catches a genetic code dimension that differs from classically recognised codon properties.
3.1. Tetrahedral Representations and CDA
The genetic code can also be presented as a tetrahedron, with four equal triangular faces each subdivided into 16 equilateral, smaller triangles, representing the 64 codons. Castro-Chavez[49] reviews these representations, and proposes a tetrahedral representation, placing codons so that hydrophobic amino acids are central to each tetrahedral face, named faces A–D. Applying CDA to Castro-Chavez's tetrahedral representation, faces A and D tend to have CDAb 0, and faces C and B CDAN 0. Within each face, in total 19 triangle vertices (over all 4 faces) with CDAb 0 are common with vertices belonging to triangles with CDAN 0. This is very close to the 18 vertices expected if codons were randomly distributed in relation to CDA (PN 0.5, chi-square test), considering that 24 codons have CDAb 0, 16 have CDA = 0, and 24 have CDAN 0. Eleven among 24 vertices common between tri-angles from different faces of the tetrahedron are for tritri-angles/codons with opposite CDA. This is slightly more than the 6.75 expected by random CDA distribution (P = 0.054, chi-square test). Hence the tetra-hedral representation of Castro-Chavez[49]is random in relation to CDA within tetrahedral faces, and probably also between faces.
Fujimoto's tetrahedral codon stereo-table [50] is much more ordered in relation to CDA's distribution among and within tetrahedral faces (Fig. 1): Faces A–D each have six codons with CDA b 0, six codons with CDAN 0, and four codons with CDA = 0. Within each face, there are exactly two contacts between codons/triangles with opposite CDA. This total of eight contacts between triangles with opposite CDA is signi fi-cantly less than the expected 18 contacts for randomly distributed CDA within faces of the tetrahedron (P = 0.018, chi-square test). There are no contacts between tetrahedron faces for codons/triangles with opposite CDA (P = 0.0096, chi-square test). Hence Fujimoto's tetrahedral representation is most compatible with the genetic code's symmetries implied by CDA inTable 1.
The specific examples used here illustrate randomness versus CDA, and close to perfect reorganisation of the genetic code in relation to CDA, respectively. Other representations might reorganise the genetic code more optimally in relation to CDA. However, these representations may not relate to interpretable phenomena in the real world.
3.2. Codon Directional Asymmetry and Codon Participation in Error Correcting Codes
Genetic codes include a subjacent punctuation code called the natu-ral circular code that enables retrieving the ribosomal translation frame
Table 1
The genetic code's 64 codons and their codon directional asymmetry, CDA. Shaded nucleo-tides indicate the nucleotide at one of the codon's extremities that is the most different from nucleotides at other positions, along rules described in text, and which determines the dom-inant side of codon directional asymmetry: negative CDA when thefirst (5′) codon position has the most different nucleotide, and positive CDA when the third (3′) position has the most different nucleotide. Codons assigned to amino acids aminoacylated by class I tRNA synthe-tases are framed, remaining amino acids are aminoacylated by class II tRNA synthesynthe-tases.
TTT F 0 TCT S 0 TAT Y 0 TGT C 0 TTC F 0.5 TCC S -0.5 TAC Y -0.5 TGC C 0.5 TTA L 1 TCA S 0.5 TAA * -1 TGA * -0.5 TTG L 1 TCG S 0.5 TAG * -0.5 TGG W -1 CTT L -0.5 CCT P 0.5 CAT H 0.5 CGT R -0.5 CTC L 0 CCC P 0 CAC H 0 CGC R 0 CTA L 0.5 CCA P 1 CAA Q -1 CGA R -0.5 CTG L 0.5 CCG P 1 CAG Q -0.5 CGG R -1 ATT I -1 ACT T -0.5 AAT N 1 AGT S 0.5 ATC I -0.5 ACC T -1 AAC N 1 AGC S 0.5 ATA I 0 ACA T 0 AAA K 0 AGA R 0 ATG M -0.5 ACG T 0.5 AAG K 0.5 AGG R -0.5 GTT V -1 GCT A -0.5 GAT D 0.5 GGT G 1 GTC V -0.5 GCC A -1 GAC D 0.5 GGC G 1 GTA V 0.5 GCA A -0.5 GAA E -0.5 GGA G 0.5 GTG V 0 GCG A 0 GAG E 0 GGG G 0
[51–55]. Mechanisms for coding frame retrieval remain unknown, but are probably associated with circular code motifs conserved in tRNAs and ribosomal RNAs[56–59]. Codon symmetry is particularly informa-tive in relation to frame retrieval, as codons of type XZX (CDA = 0) have maximal capacity for reading frame retrieval[55,60,61], and have highest occurrences within various types of error-correcting codes[62]. Absolute values of CDA are lower for codons belonging to the natural circular code than for the remaining codons (P = 0.016, two tailed Mann-Whitney test). This principle is confirmed also when comparisons imply only codons belonging to the natural circular code: their absolute CDA increases with codon-specific reading frame retriev-al (r =−0.615, P = 0.002; rs = 0.44, P = 0.026, one tailed tests). Hence processes determining the near-universal natural circular code probably contributed biological functions to CDA.
4. Codon Directional Asymmetry and tRNA Synthetase Classes
CDA inTable 1reflects a genetic code symmetry that does not follow the purine-pyrimidine, keto-amino, nor the weak-strong base-pairing patterns. A little known symmetry within the genetic code relates to Rumer's transformation[63–65], which replaces systematically all ade-nine (A) with cytosine (C) and vice versa, and also all guaade-nine (G) with thymine (T) and vice versa. It is one among 23 bijective transformations
[60], also called systematic nucleotide exchanges[66,67]or‘swinger’ transformations[68–71]. RNA and DNA sequenced by several different methods and published in GenBank by various groups match these transformations. Hence while a priori, transformations such as Rumer's seem theoretical processes, they reflect biological realities, such as actu-al nucleotide sequences that were presumably produced by replication or transcription that systematically inserts a specific nucleotide instead of another specific nucleotide. This phenomenon of systematic nucleo-tide exchanges has similarities with isolated nucleonucleo-tide misinsertions
[60,66,67].
Rumer's transformation also correlates with a notable biological prop-erty, tRNA synthetase classes[72]of amino acids assigned to codons. The tRNA synthetases are enzymes that load amino acids to their cognate tRNA. The twenty tRNA synthetases form two groups of equal size, tRNA synthetase classes I and II based on structural homology[73,74]. tRNA synthetases class I covalently link cognates to the 2′ hydroxyl group of the tRNA's last ribose, and class II to its 3′ hydroxyl group[75,76]. The symmetry in the genetic code that correlates with tRNA synthe-tase classes exchanges nucleotides at thefirst and third codon positions along rule A↔C + G↔T (Rumer's transformation), and A↔G + C↔T at the second codon position. If instead of applying the nucleotide exchange rule A↔C + G↔T to the third codon position, one applies the exchange rule A↔T + C↔G, the symmetry between codons whose corresponding tRNA is aminoacylated by tRNA synthetase class I or class II is also recovered[77]. These symmetries by nucleotide exchanges are not mere theoretical considerations. Homologies of some DNA and RNA sequences in GenBank were detected after accounting for systematic nucleotide exchanges for the mitogenome[66–71,78–80]. In addition, the regular human mitogenome includes numerous repeats that can only be detected when assuming systematic exchanges[81], including palindromes[82].
CDA associates with tRNA synthetase classes. On average, codons assigned to amino acids aminoacylated by tRNA synthetases class I have CDAb 0 (15 among 21 codons (stops excluded), P = 0.039, two tailed sign test). For tRNA synthetases class II, the situation is opposite: most codons have CDAN 0 (17 among 24, CDA = 0, P = 0.032, two-tailed sign test). Sign tests are inadequate to handle codons with CDA = 0, therefore codons with CDA = 0 are excluded from these calculations. Mean CDA for tRNA synthetase classes differ significantly (two-tailed P = 0.002 for each t-test and Mann-Whitney test). These comparisons between means include codons with CDA = 0.
CDAs are averaged for codons assigned to specific amino acids. Mean CDAb 0 for 8 among 10 amino acids for class I; and CDA N 0 for 8 among 10 amino acids for class II (P = 0.006, two-tailed sign test for each tRNA synthetase class). Exceptions are Cys and Leu for class I, and Ala, and Thr for class II. Overall, the sign of mean CDA for codons assigned to an amino acid follows expected patterns (class I, CDAb 0; class II, CDA N 0) for 16 among 20 amino acids/tRNA synthetases (P = 0.00296, one tailed sign test).
Note that stop codons have CDAb 0, predicting tRNA synthetase class I. However, the tRNA synthetase of pyrrolysine, which is inserted at some stop codons, belongs to tRNA synthetase class II[83]. Exceptions might reflect historical constraints on the genetic code's genesis[77].
Hence the rationale defining CDA reveals a symmetry that is close to that of the combination of nucleotide exchanges that reveal the genetic code's symmetry in relation to tRNA synthetase classes. However, the rationale behind CDA is simpler and perhaps more amenable to mecha-nistic reduction.
4.1. Alternative Scores for Codons with CDA = |0.5|
Three different types of codons get CDA = |0.5|, based on different rationales: (a) codons with structures ZXX/XXZ where both X and Z are purines/pyrimidines; (b) codons with structure XZW where Z belongs to the same nucleotide family (purine/pyrimidine) as either X or W; and (c) codons with structure XZW where Z belongs to a different nucleotide family than X and Z. This scoring is somewhat arbitrary, and might not be optimal to reflect biological properties. Keeping signs, we rescore each of these three codon types with values | 0.25 | and |0.75|, resulting in different scoring systems for these three codon groups: alternative CDAs of groups (a, b, c) are (0.5, 0.25, 0.75), (0.5, 0.75, 0.25), (0.25, 0.5, 0.75), (0.25, 0.75, 0.5), (0.75, 0.5, 0.25), and (0.75, 0.25, 0.5). CDA of codons with CDA = 0 and CDA = |1| remain unchanged. These different scoring systems do not alter the strength of the CDA-tRNA synthetase class association: according to all these scoring systems, the same 8 among 10 codon families in class I have CDAb 0, and 8 among
Fig. 1. Fujimoto's tetrahedral codon stereo-table, a genetic code's representation that seems non-random in relation to codon directional asymmetry. The tetrahedron has four equal, equilateral faces (A–D), and consist each of 16 equilateral triangles representing each one codon. Red circles: CDAb 0; blue squares: CDA N 0.
10 amino acids in class II have CDAN 0. Excluding palindromic codons (CDA = 0) from calculations does not change results.
This heuristic approach suggests that associations between tRNA synthetase classes (an ancient property of the translational apparatus) and CDA are robust in relation to CDA's semi-quantitative scoring.
5. Translation Kinetics
The tRNA synthetase classes differ in the position of aminoacylation of the amino acid on the tRNA's acceptor stem. This probably affects the spatial kinetics of peptide elongation. We suggest that CDA also affects the spatial kinetics of codon-anticodon interactions in the ribosome's translational core (site P[84]; site A[85]). Hence both tRNA synthetase class and CDA would affect cotranslational protein folding, meaning folding during the process of peptide extension by ri-bosomal translation[86–97]. Tentatively, we consider that associations between CDA and tRNA synthetase classes suggest synergistic effects on cotranslational protein folding by each CDA and tRNA synthetase class.
Note that cotranslational protein folding does not occur for all proteins[98]. Cotranslational protein folding frequently increases the yield of proper folds, but is not always an absolute requirement
[99–103]; yet decreases misfolding probabilities[104–106]. Among
others, at least in some cases, cotranslational folding requires complete protein structural subdomains [107,108]. Cotranslational protein folding following the sense of translation (from the N terminal) predicts more accurately protein structures than when proceeding in the opposite sense (from the C terminal) [109,110], indicating that cotranslational protein folding is a reality for most proteins. Neverthe-less, cell free protein folding shows that cotranslational folding is not always required[111].
mRNA properties affecting translation speed and ribosomal pausing
[112–114], also affect protein folding independently of that protein's amino acid sequence. Synonymous codons associate with different types of protein secondary structures[115,116], in particular for clusters of rare codons on mRNAs[117–119]. These associations might explain effects of synonymous single nucleotide polymorphisms on protein function[120–123]and are in line with selection at amino acid level that affects synonymous codon choice[124,125].
More specifically, rare codons concentrate in mRNA regions that code for transmembrane helical structures [116]. Optimization of codon usage means that organisms match codon usage frequencies with anticodons of common tRNAs[126–133], speeding translation, affecting cotranslational protein folding[134]. Lopez and Pazos[135]
suggest that proper folding into transmembrane structures requires specific spatial kinetics and particular accuracy in the process. Cotranslational protein folding is most apparent on alpha helices and betasheet secondary structures[136–140]. Hence one expects associa-tions between CDA and these conformational indices of amino acids. Chemical kinetics of the transfer of the amino acid loaded on the tRNA's acceptor stem to the elongating peptide (kinetic estimates from[141]) also constrain codon-anticodon interactions[43].
Following these rationales, CDA might reflect (a) indirectly tRNA syn-thetase classes and their effects on amino acid positioning during peptide elongation; and (b) directly the spatial kinetics of codon-anticodon inter-actions, such as tRNA-mRNA approach angles during codon-anticodon duplex formation in the ribosomal translational core(s). These two components should affect according to the cotranslational protein folding hypothesis folding patterns of elongating peptides. Hence CDA is predicted to correlate with amino acid secondary structure conforma-tional parameters for alpha helices, beta turns and/or betasheets (conformational indices are from[142–145]). The main candidates are the conformational parameters associated with transmembrane foldings (beta turns, and/or parallel and antiparallel betasheets, from references[146,147]).
6. Antiparallel Betasheet Formation and Codon Directional Asymmetry
The hypothesis that CDA associates with cotranslational protein folding predicts correlations between CDA and secondary structure con-formation parameters. Betasheets are the major secondary structures found in transmembrane proteins, antiparallel betasheets are more fre-quent than parallel betasheets[147]. Biases in tRNA synthetase amino acid contents correlate with the amino acid's antiparallel betasheet con-formation parameter[148]. Hence, we predict correlations between CDA and conformation parameters, and in particular antiparallel betasheet conformation parameters.
Indeed, antiparallel betasheet conformation parameters correlate negatively with mean CDA of codons assigned to the amino acid accord-ing to the standard genetic code (Pearson correlation coefficient r = −0.642, two-tailed P = 0.0023; non-parametric Spearman rank corre-lation coefficient rs = −0.564, two-tailed P = 0.01;Fig. 2). In contrast, and functioning as a negative control, the correlation between mean CDA and parallel betasheet conformation parameters is not statistically significant (r = −0.28, two-tailed P = 0.23, not shown). The presumed effect of CDA is specific for formation of antiparallel, not parallel, betasheets.
The variation around the regression line is similar for negative and positive CDA ranges (Fig. 2). Hence the determinism of CDA on confor-mation is comparable for 5′ versus 3′ CDA dominance: effects are inde-pendent of coding importance of codon positions. In other words, the ‘information’ in CDA that is relevant to protein secondary structure is similar for asymmetry atfirst and third codon positions. Alternative scores (Section 4.1) do not change qualitatively the results (P values for rs remain above 0.05).
The correlation between mean CDA of codons assigned to amino acids and these amino acids' antiparallel betasheet conformational indi-ces might be due to transitivity, due to associations between CDA and tRNA synthetase classes (see above section) and the association be-tween tRNA synthetase class and conformational indices. In order to control for effects of tRNA synthetase classes, we calculate mean CDA and mean antiparallel betasheet index separately for each tRNA synthe-tase class. These means are subtracted from CDA and conformational in-dices of each amino acid in that respective class. These values are residual CDA and conformational indices after excluding effects of tRNA synthetase classes. Residual CDA and residual antiparallel betasheet indices correlate negatively (r =−0.435, P = 0.0275; rs = −0.461, P = 0.0205, one tailed tests). Hence the correlation between CDA and antiparallel betasheet indices is not indirect, through colinear-ity with tRNA synthetase classes.
The association between CDA and antiparallel betasheet indices has rs with Pb 0.05 for eight among ten alternative scores (as inSection 4.1) after controlling for tRNA synthetase class. The genetic code seems structured so as to enable synergistic effects of CDA and tRNA synthe-tase classes on antiparallel betasheet formation, presumably by cotranslational protein folding.
Independently of the correlation between CDA and antiparallel betasheet conformation parameters, a weaker correlation exists between CDA and alpha-helix conformation parameters (r =−0.556, P = 0.011; rs =−0.499, P = 0.05, two-tailed test, not shown). This further correlation confirms that CDA affects protein folding. To our knowledge, these are thefirst described correlations between a codon property and secondary structure conformational parameters of assigned amino acids. CDAb 0 associates independently with each alpha and antiparallel beta conformational indices, in line with the liter-ature on cotranslational protein folding[136–140]. Hence according to the working hypothesis, similar kinetic conditions favor each of these two very different secondary structures. Presumably, factors other than CDA (for example chain polarity) determine whether an alpha helix rather than an antiparallel betasheet is initiated during peptide elongation.
7. Codon Directional Asymmetry and Prediction of Protein Secondary Structure
The correlation between CDA and conformation parameters might have two causes. First, it could be intrinsic to the genesis of the genetic code, but relatively inconsequent to modern organisms. Secondly, CDA still affects protein folding. In the latter case, correlations between CDA and secondary structure conformation parameters could explain that some synonymous mutations perturb protein function. Indeed, several amino acids have some synonymous codons with opposite CDA, such as for alanine, leucine, serine and valine. Putatively, this would indicate that for these amino acids, synonymous codons with CDAb 0 occur preferentially for mRNA regions coding for antiparallel betasheets, and those with CDAN 0 in other mRNA regions.
Codon usage frequencies are adapted to minimise effects of mutations and translation errors[149–152]. Hence weighing mean CDA for a given amino acid according to observed synonymous codon usages might increase correlations between CDA and conformation parameters. However, this is not the case for the pool of genes encoded by the human nucleus, nor those coded by the human mitogenome: correlations become in both cases weaker (not shown).
CDAs of stop codons are negative, suggesting a bias for amino acids with high tendencies to participate in antiparallel betasheets when amino acids are inserted at stop codons. Indeed, the evolution of mitochondrial genetic codes seems best reconstructed when assuming insertion of amino acids at stops[153], in line with coevolution between predicted suppressor tRNAs[154–156]and protein alignment analyses
[16,78,79,157–161]. However, frequencies of amino acids inserted at
stops[71,162–166]do not significantly correlate with antiparallel betasheet conformation parameters.
This does not mean that associations between synonymous codons in modern mRNAs and secondary structures of modern proteins do not exist. However, this suggests that testing these predictions is not
as straightforward as it seems. Among others, secondary structure annotations available in GenBank don't indicate whether a betasheet is parallel or antiparallel. Hence these tests will require involvement of more adequately equipped specialised proteomics teams (for example Caudron and Jestin[147]). Until then, the contribution of CDA for improving secondary structure predictions[26,167], especially such based on optimization of multiple approaches [168], will remain speculative.
8. Mitochondrial Genetic Codes Optimise Codon Directional Asymmetry
Many variant genetic codes are from mitochondria[169]. The reduced mitogenomes almost exclusively encode for mitochondrial transmembrane proteins, which include mainly antiparallel betasheets. In contrast, nuclear genomes encode also for large proportions of cytosolic proteins, which include much fewer betasheets. Hence, we predict that the correlation between CDA and antiparallel betasheet conformation parameters is weaker for genetic codes associated with nucleus-encoded proteomes than for mitochondrial genetic codes. The correlation inFig. 2(for the standard genetic code) is calculated for the remaining genetic codes listed by Elzanowski and Ostell[169], after recalculating mean amino acid CDA, considering codon-amino acid reassignments. The correlation's strength for each genetic code is estimated by the Pearson correlation coefficient r.
The correlation between tRNA synthetase classes and CDA is also calculated, by assigning to tRNA synthetase classes I and II values‘1’ and‘2’, respectively, and calculating the Pearson correlation coefficients r between this dummy variable representing tRNA synthetase classes and the mean CDA of codons assigned to the corresponding amino acid, for each variant genetic code. The CDA-antiparallel betasheet cor-relation coefficients are plotted as a function of the CDA-tRNA synthe-tase class correlation coefficients for the various genetic codes (Fig. 3).
Fig. 2. Antiparallel betasheet conformation parameter of amino acids as a function of the mean codon directional asymmetry (CDA) of codons assigned to that amino acid, for the standard genetic code. Amino acids aminoacylated by tRNA synthetases from class I have open circles,filled circles are for tRNA synthetases from class II.
The line inFig. 3indicates y = x, meaning that both correlations have equal strengths. Note that in context of this particular section, Pearson correlation coefficients are used as quantitative estimates of the strength of a correlation, not as test statistics to infer that a correlation exists.
All eleven mitochondrial genetic codes have stronger correlations between CDA and antiparallel betasheet conformation parameters than between CDA and tRNA synthetase classes. Obtaining this result for all eleven mitochondrial genetic codes has P = 0.00049 (two-tailed sign test). Two additional genetic codes occur in nuclear and mitochon-drial genomes: the standard genetic code, and the Mycoplasma/ Spiroplasma genetic code that also occurs in mold, protozoan and coelenterate mitochondria. These two genetic codes follow the pattern observed for the eleven genetic codes only found in mitochondria.
Six among eight genetic codes associated only with nuclear genomes are below the line y = x inFig. 2, indicating that the CDA-tRNA synthe-tase class correlation is frequently a greater constraint for nuclear genet-ic codes than mitochondrial ones. This qualitative difference between nuclear and mitochondrial genetic codes has P = 0.001 (two-tailed Fisher exact test). This divide might reflect different constraints on protein folding for populations of mitochondrion-encoded versus nucleus-encoded proteins. This pattern might indicate stronger synergy between effects of CDA and tRNA synthetase class on cotranslational folding for nucleus-encoded proteins translated in the cytosol than mitogenome-encoded ones.
These results indicate that associations between CDA and conforma-tion parameters, and between CDA and tRNA synthetase classes, drive differentially evolutions of mitochondrial versus nuclear genetic codes. Tentatively, amino acid positioning on the tRNA acceptor stem is less relevant for mitochondrial translation than CDA, the opposite is true for cytosolic translations.
9. Whole Organism Properties and Codon Directional Asymmetry
Whole organism properties correlate sometimes with molecular properties[170,171]: morphological versus molecular rates of evolution
[172–174]; growth rates and genome sizes[175–178]; and metabolic
costs of protein synthesis[179]; body temperatures and predicted expanded codons[180–183]; developmental stability estimated by lateral differences between bilateral morphological traits and accuracy of various aspects of molecular processes, such as replication[184], ribosomal translation[20,185], and tRNA loading[14]. CDA might also correlate with whole organism properties.
9.1. Lepidosaurian Body Temperature and Codon Directional Asymmetry
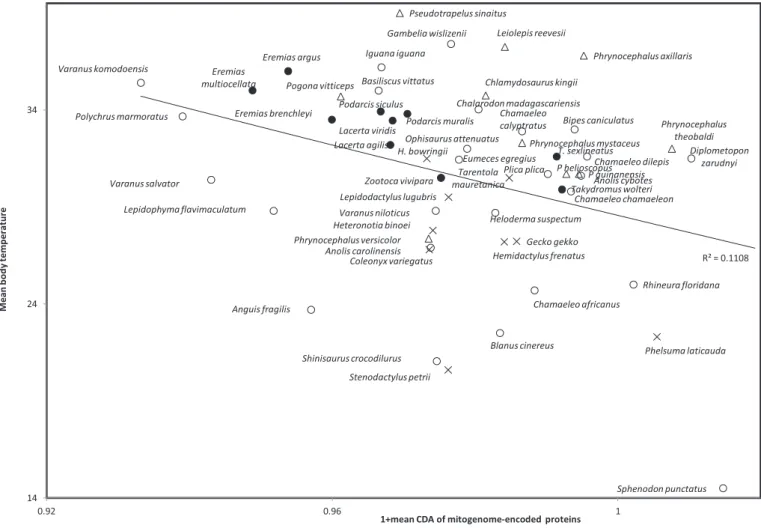
Temperature reflects noise in molecular movements, potentially affecting contranslational protein folding, which indeed depends on optimal temperatures[186]. Hence, formation of antiparallel betasheets might be impeded by high temperatures. Therefore, we expect that neg-ative CDAs promote betasheet formation despite high temperature. Hence when comparing the mean CDA calculated across all 13 membrane-embedded mitogenome-encoded proteins of different or-ganisms, we expect that organisms with high temperatures have low mean CDA for the same homologous genes. Indeed, the mean CDA of lepidosaurian mitochondrion-encoded proteins decreases with their body temperature (ro =−0.283, one tailed P = 0.018,Fig. 4, tempera-ture data compiled for species with complete mitogenome available in GenBank by Seligmann and Labra[183], thereinTable 1).
This correlation is also statistically significant within the family Lacertidae (ro =−0.842, one-tailed P = 0.001). It is negative for Agamidae (ro =−0.255, one-tailed P = 0.238), Gekkota (ro = −0.25, tailed P = 0.258), iguanid lizards (ro = −0.333,
one-Fig. 3. Correlation between antiparallel betasheet conformation parameter of amino acids and mean directional asymmetry (CDA) of codons assigned to that amino acid as a function of the correlation between CDA and the tRNA synthetase class for the corresponding amino acid for different genetic codes. Correlations are Pearson correlation coefficients. Filled/open circles are nuclear/mitochondrial genetic codes, shaded circles are for genetic codes existing in nuclei and mitochondria. The line indicates y = x. Nuclear genetic codes tend to optimise the association between CDA and tRNA synthetase classes, mitochondrial genetic codes tend to optimise the association between CDA and the antiparallel betasheet conformation parameter. Most mitogenome-encoded proteins are transmembrane proteins, hence antiparallel betasheets are particularly frequent in these proteins. Hence genetic code evolution optimises the CDA-antiparallel betasheet association in mitochondria. Open circles: mitochondrial genetic codes;filled circles: nuclear genetic codes; shaded circles: genetic codes used in nuclei and mitochondria.
tailed P = 0.21), Varanidae (ro =−1.00, one-tailed P = 0.005) and Chamaeleo (ro =−0.40, one-tailed P = 0.30) and for the pool of re-maining isolated species from various families (Heloderma, Shinisaurus, Lepidophyma, Sphenodon (ro =−0.238, one tailed P = 0.285). The cor-relation is positive for Amphisbaenia (ro = 0.40, one tailed P = 0.30). Hence seven among eight phylogenetically independent samples yield negative correlations, which is a significant majority according to a sign test (P = 0.0176). Considering the qualitative direction of correla-tions for phylogenetically independent species samples follows the principle of phylogenetically independent contrasts[187]. This confirms that positive results are not confounded by phylogenetic inertia among species. Results of this sign test are valid independently of P value adjustments for multiple tests.
GC contents could confound this correlation, because G:C base pairs are linked by three hydrogen interactions, while A:T and A:U base pairs by only two hydrogen bridges. Hence GC contents usually increases with temperature, as it confers higher stability to structures formed by nucleotide chains[188,189,190]. However, GC codon content does not correlate with body temperature for mitochondria of the above men-tioned lepidosaurian species (r =−0.0425, one-tailed P = 0.379). This is in line with results from various analyses[191–193]; that didn't detect the expected GC-temperature correlation. This negative control stresses that the association inFig. 4is not trivial.
9.2. Developmental Stability and CDA
Molecular noise (in terms of erratic molecular movements) affecting mitochondrial transmembrane protein folding might cause
developmental inaccuracies at the whole organism level. Hence, we explore the correlation between mean CDA of mitogenome-encoded proteins and developmental stability of the 4th toe of Lepidosauria, esti-mated by the Pearson correlation coefficient r between subdigital lamel-lae counts on left and right sides (data from[194–198]). Developmental stability/accuracy decreases with mean CDA of mitogenome-encoded proteins (ro =−0.316, one-tailed P = 0.0235), as expected by the working hypothesis. However, analyzing separately species grouped ac-cording to phylogenetic groups (as in previous section) yields negative correlations only infive among eight groups, which is not statistically significant at P b 0.05 according to a one sided sign test. Hence this pre-liminary result on CDA and developmental stability is at best tentative.
9.3. Lifespan and CDA
Patterns between CDA and temperature, and CDA and developmen-tal stability (Figs. 4 and 5) suggest that CDAb 0 for mitogenome-encoded proteins associates with longevity. For this purpose, we com-pared codon contents in mitogenomes of 112 semi-supercentenarians and 96 centenarians versus those of 97 healthy young controls
[199,200](Table 3). Codons with CDA =−1 are more frequent in
supercentenarians than in controls for seven among eight comparisons, which is a significant majority according to a one tailed sign test (P = 0.0176). No tendencies are observed for other CDA values (−0.5, 0, 0.5, 1), nor for comparisons between centenarians and controls. The re-sult is suggestive that CDAb 0 could contribute to extreme longevity, but the high number of tests and the small differences in codon frequen-cies stress cautious interpretation.
Fig. 4. Lepidosaurian body temperature as a function of mean codon directional asymmetry of codons in protein coding genes encoded by complete mitogenomes available in GenBank. Compilation of body temperatures and mitochondrial genomes as inTable 1of Seligmann and Labra[183]. Agamidae are indicated by triangles, Gekkota by crosses and Lacertidae byfilled circles. Species from various other families have open circles.
Overall, analyses weakly confirm predictions for correlations between CDA and whole organism properties (body temperature, developmental stability, longevity). These suggest that analyses consid-ering additional information, such as residue-specific location in three dimensional protein structures, might yield positive results. More up-to-date methods for including phylogenetic information in relation to evolutionary adaptive optima might also alter conclusions[201].
9.4. Replicational Deamination Gradients
Mitochondrial DNA replication differs from nuclear chromosome replication [202] and is usually strand asymmetric resulting in replicational deamination gradients where C→ T and A → G substitutions exceed reversed mutations proportionally to the time spent single stranded during replication [203–208]. Inverting the direction of the light strand replication origin also inverts the direction of the replicational deamination gradients[209–217]). These physico-chemical mutation pressures could affect CDA according to gene locations on the mitogenome, independently of protein properties.
Mean CDA of the 13 human mitogenome-encoded proteins does not correlate with time spent single stranded by that gene during replica-tion, assuming light strand replication initiates at the OL, the light strand replication origin (ro = 0.033, P = 0.92, two tailed test). DNA templating for tRNA genes presumably also functions sometimes as replication origins[184,218,219]. Integrating the possibility of these multiple replication origins yields gene-wise single-strand durations that converge with transcriptional singlestrandedness[220]. The corre-lation between transcriptional duration of singlestrandedness and mean gene CDA is also not statistically significant (ro = 0.418, P = 0.156, two tailed test). Hence, we do not detect statistically significant
effects of mutation pressures on mean CDA of human mitochondrial genes.
9.5. Adjusting Statistical Significances for Multiple Tests
Analyses that include several tests have to adjust P values according to the number of tests. This is because, when deciding that a result is positive at Pb 0.05, when k tests are performed, on average, k × 0.05 tests are false positives. Bonferroni's correction considers that when performing k tests, results are statistically significant at P = 0.05 for any specific test among k tests if P b 0.05/k. This correction is reputedly overconservative[221,222]. Unadjusted Ps minimise risks of false nega-tive results, Bonferroni's method minimises risks of false posinega-tives. The Benjamini-Hochberg adjustment for false discovery rates [223]
optimises between these two risks and seems most adequate[224]. This method ranks all k P values from highest to lowest (best), adjusted Ps are the product of P with k divided by the rank i, where i ranges from 1 to k. This means that the‘best’ (lowest) P is unchanged, and that the ‘worst’ (highest) P value after adjustment follows Bonferroni's adjust-ment. Ps with intermediate rank are intermediate between these extremes.
Here we consider only P values from non-parametric tests, when also parametric tests were done. For some of the associations described, more than one test was done, but these are then summarised by a test that integrates the previous tests. Adjustments consider in these cases only the latter P value. Along this approach a total of 29 hypothesis tests were done, as detailed inTable 2. Control analyses (such as with GC contents, and mutational gradients, in total 29 tests) are also includ-ed in the list of multiple tests. These are not relatinclud-ed to the main CDA hypothesis and could arguably be excluded. Excluding controls does not alter qualitatively results of the adjustments of P values.
Fig. 5. Developmental stability of bilateral counts of subdigital lamellae on 4th toe of Lepidosauria (estimated by Pearson correlation coefficients r between counts on left and right sides) as a function of mean codon directional asymmetry (CDA) of codons in all 13 genes of mitogenome-encoded transmembrane proteins.
The analysis for codon usage associated with lifespan includes 10 tests (for CDA values−1, −0.5, 0, 0.5, and 1, and this for comparisons between controls and centenarians, and between controls and supercentenarians). Among unadjusted P values with Pb 0.05, only the adjusted P value for the correlation between mean CDA of codons assigned to amino acids and the amino acids' alpha helix conformation-al indices is above 0.05. This occurs when considering conformation-all 58 tests, and when considering only the 29 tests directly pertaining to the working hypothesis about CDA. Qualitatively, results of P adjustments are robust in relation to numbers of tests included in this analysis: for example, for P with rank 17 to get PN 0.05 after adjustment, one requires k = 89 when including negative controls and k = 33 when excluding negative controls. Hence even if one was to increase numbers of tests included in the analyses, the relevant cutoff property of the distribution of adjusted
Ps is relatively robust, so that issues related to multiple tests are unlikely to alter conclusions.
10. A New Directional Codon Dimension
Intuitively, it seems conceivable that CDA, via its plausible effects on codon-anticodon interactions, affects cotranslational protein folding. However, developing a mechanistic scenario that explains why this effect should occur for antiparallel betasheets rather than parallel ones, or for alpha helices, is more difficult. We propose that some (unspecified) conformations depend on translational speed. Other conformations might be favored by random movements of the tRNA's loaded acceptor stem in relation to the elongating peptide, versus more directed movements of that stem, hence some ratio between ki-netic noise and direction. Our educated guess (but nothing beyond that) is that CDA relates more to the latter type of mechanisms. We also lack clues on why CDAb 0 promotes antiparallel betasheets, and CDAN 0 prevents them. Alpha helices might be more simple structures that require less order than antiparallel betasheets. A similar rationale might function for parallel and antiparallel betasheets. In addition, the ratio between parallel and antiparallel betasheets is about 1:7[26]: the genetic code might be optimised towards‘coding’ for the most frequent protein conformation.
The genetic code can be characterised as a hypercomplex mathemat-ical multidimensional symmetry structure[225]. In other terms, the genetic code reminds spontaneously self-organizing structures such as crystals[226, 227]. Crystals result from specific rules organizing rela-tions between atoms. Similarly, but at a much higher level of molecular complexity, the genetic code organises relations between nucleic and amino acid sequences. The genetic code might be thought as an imagi-nary polyhedron with 64 triangular faces (64 codons with three nucle-otide positions). The geometrical form of this structure remains unknown, but several symmetries implied by RNA/DNA structure and chemistry are known, such as reverse-complementarity (implied by the double helix structure), and the purine-pyrimidine as well as the alpha-keto groupings of nucleic acids. Formulation of a generalised de-scription of this complex structure is a difficult task. It is simplified by projections of the complex structure on specific scales/planes of proba-ble biological interest.
Here learned intuition detects a new symmetry property, based on codon content directionality. Analyses here can be seen as projecting that complex genetic code structure on the CDA scale, enabling to detect some new properties of the genetic code. The details of the scale of CDA scores as presented here is probably inaccurate and will hopefully be amended. CDA implies that a directional dimension that had not been apprehended links codons and amino acids: biologically meaningful in-formation relating to protein structure is embedded in the comparison between codons and their reversed (not reverse-complemented)
Table 2
Benjamini-Hochberg adjustment of P values of non-redundant hypothesis tests. The total number of tests including controls is 58 (Rank 1 and adjusted P1), excluding controls and con-sidering only tests pertaining directly to CDA, there are 29 tests (rank 2 and adjusted P2). Only tests with unadjusted Pb 0.05 are shown, all these tests pertain to CDA directly.
Test P Rank 1 Adj P1 Rank 2 Adj P2
Number of mitochondrial genetic codes above line inFig. 3 0.00050 58 0.00050 29 0.00050 Number of mitochondrial genetic codes above line vs number of nuclear codes below line inFig. 3 0.00100 57 0.00102 28 0.00100
tRNA synthetase classes and CDA 0.00200 56 0.00207 27 0.00207
tRNA synthetase classes and mean CDA of codons assigned to amino acids 0.00295 55 0.00312 26 0.00319 Contacts between Fujimoto's tetrahedron faces 0.00960 54 0.01031 25 0.01075 Correlation CDA-antiparallel betasheet indices 0.01000 53 0.01094 24 0.01167
Absolute CDA and circular code 0.01600 52 0.01785 23 0.01948
Temperature and mean CDA of 13 lepidosaurian mitogenome-encoded proteins 0.01760 51 0.02002 22 0.02240 Human lifespan and mitochondrial codon usages-CDA 0.01760 50 0.02042 21 0.02347
Contacts within Fujimoto's tetrahedron faces 0.01800 49 0.02131 20 0.02520
Partial correlation CDA-antiparallel betasheet indices 0.02050 48 0.02477 19 0.03021
CDA-developmental stability 0.02350 47 0.02900 18 0.03656
Absolute CDA-reading frame retrieval capacity 0.02600 46 0.03278 17 0.04435
Alpha helix-CDA 0.05000 45 0.06444 16 0.08750
Table 3
Mean codon frequencies (promil) in the 13 mitogenome-encoded genes of three groups of Japanese males: 97 healthy controls, 112 semi-supercentenarians and 96 centenarians from references[199,200].
Codon CDA Control Super Cent Codon CDA Control Super Cent UUU 0 20.34 20.32 20.34 UAU 0.00 12.11 12.13 12.15 UUC 0.5 36.59 36.61 36.60 UAC −0.50 23.39 23.35 23.35 UUA 1 19.07 19.04 19.01 UAA −1.00 2.09 2.09 2.10 UUG 1 4.59 4.57 4.57 UAG −0.50 0.81 0.81 0.80 CUU −0.5 17.02 17.03 17.00 CAU 0.50 4.71 4.71 4.71 CUC 0 43.89 43.88 43.89 CAC 0.00 20.80 20.80 20.79 CUA 0.5 72.88 72.87 72.90 CAA −1.00 21.61 21.61 21.59 CUG 0.5 11.74 11.78 11.79 CAG −0.50 2.08 2.09 2.10 AUU −1 33.06 33.03 33.07 AAU 1.00 8.38 8.39 8.41 AUC −0.5 51.34 51.30 51.25 AAC 1.00 34.72 34.74 34.72 AUA 0 43.77 43.81 43.82 AAA 0.00 22.37 22.40 22.39 AUG −0.5 10.72 10.74 10.73 AAG 0.50 2.63 2.61 2.61 GUU −1 8.19 8.19 8.18 GAU 0.50 3.89 3.92 3.93 GUC −0.5 12.61 12.64 12.68 GAC 0.50 13.43 13.38 13.38 GUA 0.5 18.39 18.40 18.36 GAA −0.50 16.87 16.85 16.86 GUG 0 4.71 4.71 4.73 GAG 0.00 6.23 6.25 6.24 UCU 0 8.42 8.42 8.41 UGU 0.00 1.30 1.30 1.31 UCC −0.5 25.99 25.99 26.00 UGC 0.50 4.50 4.50 4.50 UCA 0.5 21.81 21.81 21.80 UGA −0.50 24.48 24.46 24.42 UCG 0.5 1.80 1.79 1.80 UGG −1.00 2.91 2.92 2.97 CCU 0.5 10.70 10.66 10.68 CGU −0.50 1.80 1.80 1.80 CCC 0 31.39 31.43 31.42 CGC 0.00 6.80 6.80 6.80 CCA 1 13.71 13.71 13.72 CGA −0.50 7.40 7.40 7.40 CCG 1 1.78 1.78 1.78 CGG −1.00 0.50 0.50 0.50 ACU −0.5 13.41 13.39 13.43 AGU 0.50 3.70 3.69 3.69 ACC −1 40.44 40.45 40.36 AGC 0.50 10.26 10.27 10.29 ACA 0 34.80 34.78 34.77 AGA 0.00 0.30 0.29 0.30 ACG 0.5 2.57 2.58 2.58 AGG −0.50 0.30 0.30 0.30 GCU −0.5 11.73 11.73 11.74 GGU 1.00 6.30 6.32 6.33 GCC −1 32.55 32.56 32.60 GGC 1.00 22.88 22.87 22.85 GCA −0.5 21.60 21.58 21.60 GGA 0.50 18.00 18.02 18.03 GCG 0 2.08 2.09 2.08 GGG 0.00 8.55 8.52 8.51
sequence. This palindrome-minded approach to codons probably reflects error-correcting properties of primitive genetic code(s)[228]. 11. Conclusions
A property of codons, codon directional asymmetry (CDA), is defined for the genetic code. Codons are classified into symmetric (CDA = 0), 5′- and 3′-asymmetric (negative and positive CDA). CDA maps non-randomly on Fujimoto's tetrahedral representation of the genetic code. Symmetric codons are the most common codons in frame-error-correcting codes, such as comma-free and circular codes. Most codons assigned to amino acids aminoacylated to cognate tRNAs by tRNA synthetases class I have CDAb 0, those assigned to cognates of tRNA synthetases class II have usually CDAN 0.
Amino acid tendencies to participate in antiparallel betasheets decrease with CDA. Results suggest that CDA and tRNA synthetase class affect spatial kinetics of peptide elongation. These spatial kinetics affect local peptide elongation rates, which determine cotranslational peptide folding during peptide synthesis. Hence CDA, a property of gene sequences, bears useful information to predict protein folding. Some synonymous codons have CDA with opposite signs, potentially explaining how some synonymous mu-tations alter protein function.
CDA probably played a role in the evolution of genetic codes. Mitochondrial genetic codes optimise associations between CDA and antiparallel betasheet formation, nuclear genetic codes tend to optimise associations between CDA and tRNA synthetase class. This difference might mean that synergistic effects of CDA and tRNA synthetase class on cotranslational protein folding are stronger for nuclear than mito-chondrial genetic codes. CDA affects codon-amino acid (re)assignments, hence plays an important role in genetic code evolution.
Preliminary analyses suggest that average CDA of mitochondrion-encoded proteins decreases with body temperature, increases develop-mental stability and lifespan, but further controlled analyses are required to confirm these potential whole organism effects of codon directional asymmetry (CDA).
Conflicts of Interests None.
Acknowledgments
This study was supported by Méditerranée Infection and the Nation-al Research Agency under the program“Investissements d’avenir”, ref-erence ANR-10-IAHU-03 and the A*MIDEX project (no ANR-11-IDEX-0001-02).
References
[1]Woese CR. Order in the genetic code. Proc Natl Acad Sci 1965;54:71–5.
[2]Di Giulio M. The extension reached by the minimization of the polarity distances during the evolution of the genetic code. J Mol Evol 1989;29:288–93.
[3]Haig D, Hurst LD. A quantitative measure of error minimization in the genetic-code. J Mol Evol 1991;33:412–7.
[4] Ardell DH. On error minimization in a sequential origin of the standard genetic code. J Mol Evol 1998;47:1–13.
[5] Freeland SJ, Hurst LD. Load minimization of the genetic code: history does not explain the pattern. Proc R Soc B Biol Sci 1998;265:2111–9.
[6]Freeland SJ, Hurst LD. The genetic code is one in a million. J Mol Evol 1998;47: 238–48.
[7]Ardell DH, Sella G. On the evolution of redundancy in genetic codes. J Mol Evol 2001;53:269–81.
[8]Freeland SJ, Wu T, Keulmann N. The case for an error minimizing standard genetic code. Origins Life Evol B 2003;33:457–77.
[9] Błażej P, Miasojedow B, Grabińska M, Mackiewicz P. Optimization of mutation pressure in relation to properties of protein-coding sequences in bacterial genomes. PLoS One 2015;10(6):e0130411.
[10]Błażej P, Mackiewicz D, Grabińska M, Wnętrzak M, Mackiewicz P. Optimization of amino acid replacement costs by mutational pressure in bacterial genomes. Sci Rep 2017;7(1):1061.
[11]Blazej P, Wnetrzak M, Mackiewicz P. The role of crossover operator in evolutionary-based approach to the problem of genetic code optimization. Biosystems 2016;150: 61–72.
[12]de Oliveira LL, de Oliveira PS, Tinos R. A multiobjective approach to the genetic code adaptability problem. BMC Bioinformatics 2015;16:52.
[13]Seligmann H. Do anticodons of misacylated tRNAs preferentially mismatch codons coding for the misloaded amino acid? BMC Mol Biol 2010;11:41.
[14]Seligmann H. Error compensation of tRNA misacylation by codon-anticodon mismatch prevents translational amino acid misinsertion. Comput Biol Chem 2011;35(2):82–95.
[15]Seligmann H. Coding constraints modulate chemically spontaneous mutational replication gradients in mitochondrial genomes. Curr Genomics 2012;13(1): 38–52.
[16]Barthélémy RM, Seligmann H. Cryptic tRNAs in chaetognath mitochondrial genomes. Comput Biol Chem 2016;62:119–32.
[17]Seligmann H, Pollock DD. The ambush hypothesis: hidden stop codons prevent off-frame gene reading. DNA Cell Biol 2004;23(10):701–5.
[18]Itzkovitz S, Alon U. The genetic code is nearly optimal for allowing additional information within protein-coding sequences. Genome Res 2007;17(4):405–12.
[19]Seligmann H. Cost minimization of ribosomal frameshifts. J Theor Biol 2007; 249(1):162–7.
[20]Seligmann H. The ambush hypothesis at the whole-organism level: off frame, ‘hidden’ stops in vertebrate mitochondrial genes increase developmental stability. Comput Biol Chem 2010;34(2):80–5.
[21]Singh TR, Pardasani KR. Ambush hypothesis revisited: evidences for phylogenetic trands. Comput Biol Chem 2009;33(3):239–44.
[22]Tse H, Cai JJ, Tsoi HW, Lam EP, Yuen KY. Natural selection retains overrepresented out-of-frame stop codons against frameshift peptides in prokaryotes. BMC Genomics 2010;11:491.
[23]Křižek M, Křižek P. Why has nature invented three stop codons of DNA and only one start codon? J Theor Biol 2012;304:183–7.
[24]Gilis D, Massar S, Cerf NJ, Rooman M. Optimality of the genetic code with respect to protein stability and amino-acid frequencies. Genome Biol 2001;2 [RESEARCH0049].
[25]Guilloux A, Jestin JL. The genetic code and its optimization for kinetic energy conservation in polypeptide chains. Biosystems 2012;109(2):141–4.
[26]Guilloux A, Caudron B, Jestin JL. A method to predict edge strands in beta-sheets from protein sequences. Comput Struct Biotechnol J 2013;7:e201305001.
[27]Wong JT. A co-evolution theory of the genetic code. Proc Natl Acad Sci U S A 1975; 72:1909–12.
[28]Di Giulio M. On the origin of the genetic code. J Theor Biol 1997;187:573–81.
[29]Di Giulio M. The coevolution theory of the origin of the genetic code. J Mol Evol 1999;48:253–5.
[30]Di Giulio M. An extension of the coevolution theory of the origin of the genetic code. Biol Direct 2008;3:37.
[31]Wong JT. The coevolution theory at age thirty. Bioessays 2005;27(4):416–25.
[32]Guimarães RC. Metabolic basis for the self-referential genetic code. Orig Life Evol Biosph 2011;41(4):357–71.
[33]Morgens DW, Cavalcanti ARO. An alternative look at code evolution: using non-canonical codes to evaluate adaptive and historic models for the origin of the genetic code. J Mol Evol 2013;76:71–80.
[34]Guimarães RC. The self-referential genetic code is biologic and includes the error minimization property. Orig Life Evol Biosph 2015;45:69–75.
[35]Di Giulio M. The lack of foundation in the mechanism on which are based the physico-chemical theories for the origin of the genetic code is counterposed to the credible and natural mechanism suggested by the coevolution theory. J Theor Biol 2016;399:134–40.
[36]Di Giulio M. Some pungent arguments against the physico-chemical theories of the origin of the genetic code and corroborating the coevolution theory. J Theor Biol 2017;414:1–4.
[37]Higgs PG, Pudritz RE. A thermodynamic basis for prebiotic amino acid synthesis and the nature of thefirst genetic code. Astrobiology 2009;9(5):483–90.
[38]Novozhilov AS, Koonin EV. Exceptional error minimization in putative primordial genetic codes. Biol Direct 2009;4:44.
[39]Santos J, Monteagudo A. Genetic code optimality studied by means of simulated evolution and within the coevolution theory of the canonical code organization. Nat Comput 2009;8:719.
[40]Tlusty T. A colorful origin for the genetic code: information theory, statistical me-chanics and the emergence of molecular codes. Phys Life Rev 2010;7(3):362–76.
[41]Di Giulio M. The origin of the genetic code: matter of metabolism or physicochemical determinism? J Mol Evol 2013;77:131–3.
[42]Banhu AV, Aggarwal N, Sengupta S. Revisiting the physico-chemical hypothesis of code origin: an analysis based on code-sequence coevolution in afinite population. Orig Life Evol Biosph 2013;43:465–89.
[43]Seligmann H, Amzallag GN. Chemical interactions between amino acid and RNA: multiplicity of the levels of specificity explains origin of the genetic code. Naturwissenschaften 2002;89(12):542–51.
[44]Woese CR, Dugre, Saxinger WC, Dugre SA. The molecular basis for the genetic cocde. Proc Natl Acad Sci U S A 1978;55:966–74.
[45]Weber AL, Lacey JC. Genetic code correlations: amino acids and their anticodon nucleotides. J Mol Evol 1966;11:199–210.
[46]Shu JJ. A new integrated symmetrical table for genetic codes. Biosystems 2017;151: 21–6.
[47]Nemzer LR. A binary representation of the genetic code. Biosystems 2017;155:10–9.
[48]Gonzalez DL, Giannerini S, Rosa R. Strong short-range correlations and dichotomic codon classes in coding DNA sequences. Phys Rev E Stat Nonlin Soft Matter Phys 2008;78(5 Pt 1):051918.
[49]Castro-Chavez F. A tetrahedral representation of the genetic code emphasizing aspects of symmetry. BIOcomplexity 2012;2012(2):1–6.
[50]Fujimoto M. Tetrahedral codon stereo-table[4,702,704. U.S. Patent]; 1987. [http:// www.google.com/patents/US4702704].
[51]Arquès DG, Michel CJ. A complementary circular code in the protein coding genes. J Theor Biol 1996;182(1):45–58.
[52]Michel CJ. The maximal C3
self-complementary trinucleotide circular code X in genes of bacteria, eukaryotes, plasmids and viruses. J Theor Biol 2015;380: 156–77.
[53]Michel CJ. The maximal C(3) self-complementary trinucleotide circular code X in genes of bacteria, eukaryotes, plasmids and viruses. Life 2017;7(2):e20.
[54]Ahmed A, Frey G, Michel CJ. Frameshift signals in genes associated with the circular code. In Silico Biol 2007;7(2):155–68.
[55]Ahmed A, Frey G, Michel CJ. Essential molecular functions associated with the circular code evolution. J Theor Biol 2010;264(2):613–22.
[56]Michel CJ. Circular code motifs in transfer and 16S ribosomal RNAs: a possible translation code in genes. Comput Biol Chem 2012;37:24–37.
[57]Michel CJ. Circular code motifs in transfer RNAs. Comput Biol Chem 2013;45: 17–29.
[58]El Soufi K, Michel CJ. Circular code motifs in the ribosome decoding center. Comput Biol Chem 2014;52:9–17.
[59]El Soufi K, Michel CJ. Circular code motifs near the ribosome decoding center. Comput Biol Chem 2015;59(Pt A):158–76.
[60]Michel CJ, Seligmann H. Bijective transformation circular codes and nucleotide exchanging RNA transcription. Biosystems 2014;118:39–50.
[61]El Houmami N, Seligmann H. Evolution of nucleotide punctuation marks: from structural to linear signals. Front Genet 2017;8:36.
[62]Fimmel E, Strüngmann L. Codon distribution in error-detecting circular codes. Life 2016;6(1):e14.
[63]Rumer YB. About the codon systematization in the genetic code. Proc Acad Sci USSR 1966;167:1393–4.
[64]Shsherbak VI. Rumer's rule and transformation in the context of the co-operative symmetry of the genetic code. J Theor Biol 1989;139(2):271–6.
[65]Gumbel M, Fimmel E, Danielli A, Strüngmann L. On models of the genetic code gen-erated by binary dichotomic algorithms. Biosystems 2015;128:9–18.
[66]Seligmann H. Polymerization of non-complementary RNA: systematic sym-metric nucleotide exchanges mainly involving uracil produce mitochondrial RNA transcripts coding for cryptic overlapping genes. Biosystems 2013;111(3): 156–74.
[67]Seligmann H. Systematic asymmetric nucleotide exchanges produce human mitochondrial RNAs cryptically encoding for overlapping protein coding genes. J Theor Biol 2013;324:1–20.
[68]Seligmann H. Species radiation by DNA replication that systematically exchanges nucleotides? J Theor Biol 2014;363:216–22.
[69]Seligmann H. Mitochondrial swinger replication: DNA replication systematically exchanging nucleotides and short 16S ribosomal DNA swinger inserts. Biosystems 2014;125:22–31.
[70]Seligmann H. Sharp switches between regular and swinger mitochondrial replication: 16S rDNA systematically exchanging nucleotides A↔ T + C ↔ G in the mitogenome of Kamimuria wangi. Mitochondrial DNA A DNA Mapp Seq Anal 2016;27(4):2440–6.
[71]Seligmann H. Translation of mitochondrial swinger RNAs according to tri-, tetra-and pentacodons. Biosystems 2016;140:36–48.
[72]Delarue M. An asymmetric underlying rule in the assignment of codons. RNA 2007; 13:161–9.
[73]Eriani G, Delarue M, Poch O, Gangloff J, Moras D. Partition of tRNA synthetases into two classes based on mutually exclusive sets of sequence motifs. Nature 1990;347: 203–6.
[74]Cusack S. Aminoacyl-tRNA synthetases. Curr Opin Struct Biol 1997;7:881–9.
[75]Sprinzl M, Cramer F. Site of aminoacylation of tRNAs from Escherichia coli with re-spect to the 2′2′- or 3′3′-hydroxyl group of the terminal adenosine. Proc Natl Acad Sci U S A 1975;72:3049–53.
[76]Arnez JG, Moras D. Aminoacyl-tRNA synthetase tRNA recognition. Oxford: IRL Press; 1994 61–81.
[77]Jestin JL, Soulé C. Symmetries by base substitutions in the genetic code predict 2′2′ or 3′3′ aminoacylation of tRNAs. J Theor Biol 2007;247(2):391–4.
[78]Seligmann H. Overlapping genes coded in the 3′-to-5′-direction in mitochondrial genes and 3′-to-5′ polymerization of non-complementary RNA by an ‘invertase’. J Theor Biol 2012;315:38–52.
[79]Seligmann H. Triplex DNA:RNA, 3′-to-5′ inverted RNA and protein coding in mitochondrial genomes. J Comput Biol 2013;20(9):660–71.
[80]Seligmann H. Systematic exchanges between nucleotides: genomic swinger repeats and swinger transcription in human mitochondria. J Theor Biol 2015;384:70–7.
[81]Seligmann H. Swinger RNAs with sharp switches between regular transcription and transcription systematically exchanging ribonucleotides: case studies. Biosystems 2015;135:1–8.
[82]Seligmann H. Swinger RNA self-hybridization and mitochondrial non-canonical swinger transcription, transcription systematically exchanging nucleotides. J Theor Biol 2016;399:84–91.
[83]Nozawa K, O'donoghue P, Gundllapalli S, Araiso Y, Ishitani R, Umehara T, et al. Pyrrolysyl-tRNA synthetase-tRNAPyl
structure reveals the molecular basis of orthogonality. Nature 2009;457:1163–7.
[84]Ashraf SS, Guenther R, Agris PF. Orientation of the tRNA anticodon in the ribosomal P-site: quantitative footprinting with U33-modified, anticodon stem and loop domains. RNA 1999;5(9):1191–9.
[85]Dale T, Fahlman RP, Olejniczak M, Uhlenbeck OC. Specificity of the ribosomal A site for aminoacyl-tRNAs. Nucleic Acids Res 2009;37(4):1202–10.
[86]Krasheninnikov IA, Komar AA, Adzhubei IA. Nonuniform size distribution of na-scent globin peptides, evidence for pause localization sites, and a contranslational protein-folding model. J Protein Chem 1991;10(5):445–53.
[87]Fedorov AN, Baldwin TO. Contribution of cotranslational folding to the rate of for-mation of native protein structure. Proc Natl Acad Sci U S A 1995;92(4):1227–31.
[88]Kolb VA, Makeyev EV, Kommer A, Spirin AS. Cotranslational folding of proteins. Biochem Cell Biol 1995;73(11−12):1217–20.
[89]Gross M. Linguistic analysis of protein folding. FEBS Lett 1996;390(3):249–52.
[90]Fedorov AN, Baldwin TO. Cotranslational protein folding. J Biol Chem 1997; 272(52):32715–8.
[91]Kolb VA. Cotranslational protein folding. Mol Biol 2001;35:584–90.
[92]Dana A, Tuller T. Determinants of translation elongation speed and ribosomal profiling biases in mouse embryonic stem cells. PLoS Comput Biol 2012;8(11):e1002755-5.
[93]O'Brien EP1, Vendruscolo M, Dobson CM. Prediction of variable translation rate effects on cotranslational protein folding. Nat Commun 2012;3:868.
[94]Nissley DA1, O'Brien EP. Timing is everything: unifying codon translation rates and nascent proteome behavior. J Am Chem Soc 2014;136(52):17892–8.
[95]O'Brien EP1, Ciryam P, Vendruscolo M, Dobson CM. Understanding the influence of codon translation rates on cotranslational protein folding. Acc Chem Res 2014; 47(5):1536–44.
[96]Ray SK, Baruah VJ, Satapathy SS, Banerjee R. Cotranslational protein folding reveals the selective use of synonymous codons along the coding sequence of a low ex-pression gene. J Genet 2014;93(3):613–7.
[97]Trovato F, O'Brien EP. Insights into cotranslational nascent protein behavior from computer simulations. Annu Rev Biophys 2016;45:345–69.
[98]Lu HM, Liang J. A model study of protein nascent chain and cotranslational folding using hydrophobic-polar residues. Proteins 2008;70(2):442–9.
[99]Ugrinov KG1, Clark PL. Cotranslational folding increases GFP folding yield. Biophys J 2010;98(7):1312–20.
[100]Ciryam P, Morimoto RI, Vendruscolo M, Dobson CM, O'Brien EP. In vivo translation rates can substantially delay the cotranslational folding of the Escherichia coli cytosolic proteome. Proc Natl Acad Sci U S A 2013;110(2):E132-0.
[101]Sander IM1, Chaney JL, Clark PL. Expanding Anfinsen's principle: contributions of synonymous codon selection to rational protein design. J Am Chem Soc 2014; 136(3):858–61.
[102]Holtkamp W, Kokic G, Jäger M, Mittelstaet J, Komar AA, Rodnina MV. Cotranslational protein folding on the ribosome monitored in real time. Science 2015;350(6264):1104–7.
[103]Nilsson OB, Nickson AA, Hollins JJ, Wickles S, Steward A, Beckmann R, et al. Cotranslational folding of spectrin domains via partially structured states. Nat Struct Mol Biol 2017;24(3):221–5.
[104]O'Brien EP, Vendruscolo M, Dobson CM. Kinetic modelling indicates that fast-translating codons can coordinate cotranslational protein folding by avoiding misfolded intermediates. Nat Commun 2014;5:2988.
[105]Cabrita LD, Cassaignau AM, Launay HM, Waudby CA, Wlodarski T, Camilloni C, et al. A structural ensemble of a ribosome-nascent chain complex during cotranslational protein folding. Nat Struct Mol Biol 2016;23(4):278–85.
[106]Trovato F, O'Brien EP. Fast protein translation can promote co- and posttranslation-al folding of misfolding-prone proteins. Biophys J 2017;112(9):1807–19.
[107]Eichmann C1, Preissler S, Riek R, Deuerling E. Cotranslational structure acquisition of nascent polypeptides monitored by NMR spectroscopy. Proc Natl Acad Sci U S A 2010;107(20):9111–6.
[108]Han Y, David A, Liu B, Magadán JG, Bennink JR, Yewdell JW, et al. Monitoring cotranslational protein folding in mammalian cells at codon resolution. Proc Natl Acad Sci U S A 2012;109(31):12467–72.
[109]Ellis JJ1, Huard FP, Deane CM, Srivastava S, Wood GR. Directionality in protein fold prediction. BMC Bioinformatics 2010;11:172.
[110]Srivastava S, Patton Y, Fisher DW, Wood GR. Cotranslational protein folding and terminus hydrophobicity. Adv Bioinformatics 2011;2011:176813.
[111]Focke PJ, Hein C, Hoffmann B2, Matulef K, Bernhard F, Dötsch V, et al. Combining in vitro folding with cell free protein synthesis for membrane protein expression. Biochemistry 2016;55(30):4212–9.
[112]Li G-W, Oh E, Weissman JS. The anti-Shine-Dalgarno sequence drives translational pausing and codon choice in bacteria. Nature 2012;484:538–41.
[113]Ta T, Argos P. Protein secondary structural types are differentially coded on mes-senger RNA. Protein Sci 1996;5(10):1973–83.
[114]Brule CE, Grayhack EJ. Synonymous codons: choose wisely for expression. Trends Genet 2017;33(4):283–97.
[115]Oresic M, Shalloway D. Specific correlations between relative synonymous codon usage and protein secondary structure. J Mol Biol 1998;281(1):31–48.
[116]Saunders R, Deane CM. Synonymous codon usage influences the local protein structure observed. Nucleic Acids Res 2010;38(19):6719–28.
[117]Phoenix DA, Korotkov E. Evidence of rare codon clusters within Escherichia coli cod-ing regions. FEMS Microbiol Lett 1997;155(1):63–6.
[118]Clarke TF, Clark PL. Rare codons cluster. PLoS One 2008;3(10):e3412-.
[119]Chartier M, Gaudreault F, Najmanovich R. Large scale analysis of conserved rare codon clusters suggests an involvement in co-translational molecular recognition events. Bioinformatics 2012;28(11):1438–45.
[120]Kimchi-Sarfaty C, Oh JM, Kim I-W, Sauna ZE, Calcagno AM, Ambudkar SV, et al. A “silent” polymorphism in the MDR1 gene changes substrate specificity. Science 2007;315(5811):525–8.
[121]Komar AA. Silent SNPs: impact on protein function and phenotype. Pharmacogenomics 2007;8(8):1075–80.
[122]Agashe D, Martinez-Gomez NC, Drummond DA, Marx CJ. Good codons, bad tran-script: large reductions in gene expression andfitness arising from synonymous mutations in a key enzyme. J Mol Evol 2012;30(3):549–60.