HAL Id: hal-00298221
https://hal.archives-ouvertes.fr/hal-00298221
Submitted on 22 May 2008HAL is a multi-disciplinary open access
archive for the deposit and dissemination of sci-entific research documents, whether they are pub-lished or not. The documents may come from teaching and research institutions in France or abroad, or from public or private research centers.
L’archive ouverte pluridisciplinaire HAL, est destinée au dépôt et à la diffusion de documents scientifiques de niveau recherche, publiés ou non, émanant des établissements d’enseignement et de recherche français ou étrangers, des laboratoires publics ou privés.
Variability of summer precipitation over eastern China
during the last millennium
C. Shen, W.-C. Wang, Y. Peng, Y. Xu, J. Zheng
To cite this version:
C. Shen, W.-C. Wang, Y. Peng, Y. Xu, J. Zheng. Variability of summer precipitation over eastern China during the last millennium. Climate of the Past Discussions, European Geosciences Union (EGU), 2008, 4 (3), pp.611-643. �hal-00298221�
CPD
4, 611–643, 2008
Variability of summer precipitation
over eastern China C. Shen et al. Title Page Abstract Introduction Conclusions References Tables Figures ◭ ◮ ◭ ◮ Back Close
Full Screen / Esc
Printer-friendly Version Interactive Discussion
Clim. Past Discuss., 4, 611–643, 2008 www.clim-past-discuss.net/4/611/2008/
© Author(s) 2008. This work is distributed under the Creative Commons Attribution 3.0 License.
Climate of the Past Discussions
Climate of the Past Discussions is the access reviewed discussion forum of Climate of the Past
Variability of summer precipitation over
eastern China during the last millennium
C. Shen1, W.-C. Wang1, Y. Peng2, Y. Xu2, and J. Zheng31
Atmospheric Sciences Research Center, State University of New York, Albany, NY, USA
2
Laboratory for Climate Studies, China Meteorological Administration, Beijing, China
3
Institute of Geographical Sciences and Natural Resources Research, Chinese Academy of Sciences, Beijing, China
Received: 2 April 2008 – Accepted: 3 April 2008 – Published: 22 May 2008 Correspondence to: C. Shen ([email protected])
CPD
4, 611–643, 2008
Variability of summer precipitation
over eastern China C. Shen et al. Title Page Abstract Introduction Conclusions References Tables Figures ◭ ◮ ◭ ◮ Back Close
Full Screen / Esc
Printer-friendly Version Interactive Discussion
Abstract
We use measurements of recent decades, 1500-yr proxy data, and millennium model simulations with a variety of climate facings to study the temporal and spatial variabil-ity of summer precipitation over eastern China. Spectral analysis of the proxy data using multi-taper method reveals three statistically significant bidecadal (15–35-yr), 5
pendadecadal (40–60-yr), and centennial (65–170-yr) oscillation bands. The results of wavelet filtering show that the amplitudes of these bands vary substantially through time depending on the temperature regimes. Weak centennial oscillation and strong pentadecadal oscillation occur in warm conditions, whereas the oscillations are both strong in cold conditions. A model/data intercomparison suggests that the centennial 10
oscillation might be linked to the fluctuation of solar forcing (Gleissberg cycle), and the pentadecadal and bidecadal oscillations could be associated with internal variability of the climate system. It is also found that the increased frequency of drought-in-north/flood-in-south spatial pattern over eastern China during the last two decades is unusual in the past five centuries.
15
1 Introduction
The Earth’s climate has significantly warmed in the last few decades, most likely due to anthropogenic forcing (IPCC, 2001; 2007; Jones et al., 2001). In order to assess the impacts of climate change under global warming on the human societies and nat-ural ecosystems and to develop suitable adaptation and mitigation policies, a better 20
understanding of climate variability under “natural” and “anthropogenic” conditions and accurate climate change predictions are needed at the global and, more importantly, the regional and local scales (Bradley et al., 2003; Jones and Mann, 2004; Giorgi, 2005). Changes in globally average climate are primarily determined by the radiative budget of the coupled atmosphere-ocean-land system and modulated by internal non-25
CPD
4, 611–643, 2008
Variability of summer precipitation
over eastern China C. Shen et al. Title Page Abstract Introduction Conclusions References Tables Figures ◭ ◮ ◭ ◮ Back Close
Full Screen / Esc
Printer-friendly Version Interactive Discussion
as greenhouse effect generally causes global warming and an increase of global pre-cipitation as a consequence of increased evaporation from the warmer land and ocean surfaces (Allen and Ingram, 2003). However, climates, especially precipitation, are pri-marily controlled by circulation regimes and internal modes of variability at the regional scale. For example, the Asian monsoon and its interactions with the El Nino/Southern 5
Oscillation (ENSO) and extratropical circulations are the major sources of interannual variability of summer precipitation over Asia (Wang, 2006). Therefore, the study of variability in seasonal precipitation at the regional scales is vital to providing detailed picture we need in our research for an unambiguous “fingerprint” of the climate re-sponse to increasing greenhouse gas emissions (Barnett et al., 1999; Jones et al., 10
2001).
Eastern China is located in the monsoonal Asia, which is vulnerable to small changes in the timing and intensity of monsoon precipitation. The vulnerability is likely to in-crease in the future with continued population growth and intensified land-use (Fed-dema et al., 2005; Zhao et al., 2006). The monsoon system is highly variable over 15
a broad range of timescales from days to millennia. We have come to know a great deal about Asian monsoon dynamics on seasonal to interannual time scales due to an increased wealth of new data from satellite observations and field experiments, and the advances in computing power and mathematical representations of coupled climate system (Wang, 2006). For example, It has been known that the ENSO event and Quasi-20
biennial Oscillation (QBO) have been the primary source of the precipitation over East Asia on seasonal to interannual time scales (Ding, 1991; Waliser, 2006; Yang and Luo, 2006). It is also known that astronomical variations in seasonal insolation have been the primary pacemaker of the Asian monsoon on glacial-interglacial time scales (e.g. Clemens et al., 2003), and a 1500-yr cycle in Holocene monsoon dynamics has been 25
driven by solar activities (e.g. Gupta et al., 2005). However, the patterns and causes of decadal-centennial variability are not well understood due to the limits in the length of observational records and relatively coarse resolution of proxy data. Although work to date has revealed many strong hints of decadal to quasi-centennial oscillations in the
CPD
4, 611–643, 2008
Variability of summer precipitation
over eastern China C. Shen et al. Title Page Abstract Introduction Conclusions References Tables Figures ◭ ◮ ◭ ◮ Back Close
Full Screen / Esc
Printer-friendly Version Interactive Discussion
summer precipitation over eastern China using relatively short observational data and proxy data (e.g. Zhu and Wang, 2002; Ding et al., 2007), the behavior of decadal to centennial variability in time and space is still unclear in the context of millennia. In this study, we analyze the 1500-yr proxy data of summer precipitation to examine long-term variability with a focus on decadal to centennial oscillations.
5
Some studies using observational and modeled data have indicated an increase in the frequency of drought-in-north/flood-in-south over eastern China during the last few decades (Xu, 2001; Ding et al., 2007). It has been ascribed to the response of sum-mer precipitation to anthropologic forcing (Xu, 2001; Menon et al., 2002; Fu, 2003). However, question is how unusual this variability of summer precipitation in the last few 10
decades in the millennium context of climate. The last millennium is an epoch including Medieval Warm Period (MWP) with climate as warm as the last century. It also encom-passes the period before large-scale contamination of the global atmosphere by hu-man activities and global-scale changes in land-surface condition (Bradley et al., 2003; Jones and Mann, 2004). Therefore, the study of the variability in summer precipitation 15
over eastern China during the time interval longer than observational record is es-sential for assessing the temporal and spatial variability of summer precipitation under “natural” and ‘anthropogenic” condition and for understanding the role of anthropogenic forcing in future precipitation variations. In this study, we analyze observational, proxy, and modeled data to examine the occurrence probability of different spatial patterns 20
over eastern China during the instrumental and historical times.
Theoretical models of the climate system driven with external forcing can provide important insights into the factors governing climate changes in the past (Jones and Mann, 2004). Simulations of climate changes over the last millennium have been per-formed using energy balance models (EBMs, e.g. Crowley, 2000), two-dimensional 25
climate models (e.g. Bauer et al., 2003), and general circulation models (GCMs, e.g. Ammann et al., 2007). However, studies of model/data intercomparison mainly focused on temperature. There has been little attempt to test climate models with precipitation proxy data or interpret such proxy data using model simulations (Yoshimori et al., 2006).
CPD
4, 611–643, 2008
Variability of summer precipitation
over eastern China C. Shen et al. Title Page Abstract Introduction Conclusions References Tables Figures ◭ ◮ ◭ ◮ Back Close
Full Screen / Esc
Printer-friendly Version Interactive Discussion
In this study, the millennium simulations driven with natural and anthropogenic focrc-ing and fixed forcfocrc-ing (control run) usfocrc-ing CCSM2.0 are used to analyze the variability of summer precipitation over eastern China during the last millennium. The compar-isons of modeled, observed, and proxy data are conducted to assess the performance of CCSM2.0 in simulating the spatial patterns and temporal variability of summer pre-5
cipitation over eastern China, and to provide some potential insights into the factors influencing temporal and spatial variability of summer precipitation over eastern China during the last millennium.
2 Data and methods
The data used in this study include observational, modeled, and proxy data of summer 10
precipitation over eastern China (Table 1). Observational precipitation data we analyze are from the Chinese National Climate Center (CNCC) and the Climate Research Unit of the University of East Anglia. The former is a data set of precipitation from 1951 to 2000 at 160 stations over China, and the latter is a data set of land-only precipitation in a 3.75◦×2.5◦ resolution covering a period of 1901–2000. Proxy data used in this 15
study is a dataset of the dryness/wetness index (DWI), a proxy data of summer rainfall, over eastern China from 1470 to 2000, derived from Chinese historical documents and instrumental measurements (CNMA, 1981; Zhang et al., 2003). Additionally, two 1500-yr time series of regional DWI covering two regions, i.e. North China (NC, 34– 41◦N, 107–120◦E) and the middle-lower Yangtze River Valley (MLYRV, 26–34◦N, 109–
20
122◦E) over eastern China (Zheng et al., 2006) are also analyzed. Model data are three millennium simulations of NCAR CCSM2.0, including a control run, a run with orbital and solar forcing, and another run with full forcing. Forcing time series for solar activity, volcanic activity, anthropogenic greenhouse gases and aerosols used in the model runs of millennium simulation of climate are from the EBMs and GCMs studies 25
(Crowley, 2000; Crowley et al., 2003; Ammann et al., 2007).
CPD
4, 611–643, 2008
Variability of summer precipitation
over eastern China C. Shen et al. Title Page Abstract Introduction Conclusions References Tables Figures ◭ ◮ ◭ ◮ Back Close
Full Screen / Esc
Printer-friendly Version Interactive Discussion
patterns of summer precipitation over eastern China. Multi-taper method (MTM) (Ghil et al., 2002) and wavelet analysis (Torrence and Campo, 1998) are applied to detect decadal to centennial oscillations of summer precipitation and their temporal evolution during the pat 1500 yr over eastern China.
3 Results and discussion
5
3.1 Variability of summer precipitation in observational data
Eastern China is located in the East Asian monsoon region. The summer monsoon brings about 70% of the total annual precipitation to this region. On average, the sum-mer monsoon onset occurs in early to mid-May when heavy convective rainfall develops over southern China along the pre-Meiyu front. It is then followed by abrupt northward 10
shifts of the summer monsoon, causing an elongated rain belt referred to as Meiyu or “Plum Rains”, a regional rainy season in June and July over the Yangtze River Valley in eastern China. The summer monsoon then shifts to northern China in July, trigger-ing the rainy seasons of northern China. At the end of August, the summer monsoon begins to withdraw southward (Ding, 1991; Samel et al., 1999; Chang et al., 2000). 15
Following this summer monsoon northward penetration, the summer precipitation over eastern China exhibits a significant gradient from south to north.
Chinese National Climate Center has developed a dataset of monthly temperature and precipitation from 1951 to the present. It consists of 160 stations, covering the most land areas of China. Here we selected a subset of summer precipitation consisting 37 20
stations over eastern China (Fig. 1) to conduct PCA. The result of PCA shows that the first two PCs explain 19.4% and 15.2% of the total variance in this dataset. PC1 indicates a three-belt mode of spatial pattern, in which NC and southeastern coast (SEC) share the same precipitation conditions (either increase or decrease), and the MLYRV experiences the opposite conditions. PC2 reveals a dipole mode of spatial 25
CPD
4, 611–643, 2008
Variability of summer precipitation
over eastern China C. Shen et al. Title Page Abstract Introduction Conclusions References Tables Figures ◭ ◮ ◭ ◮ Back Close
Full Screen / Esc
Printer-friendly Version Interactive Discussion
SEC witness an increase in summer precipitation. It is evident that the result of PCA shows a distinct difference of summer precipitation variability in NC and the MLYRV during the past 50 yr. Therefore, we choose NC and the MLYRV as our study regions to explore the tempo-spatial variability of summer precipitation during the instrumental and historical times over eastern China. Another reason why we choose them as our 5
study regions is that 1500-yr proxy data of summer precipitation is available only in these two regions (Zheng et al., 2006).
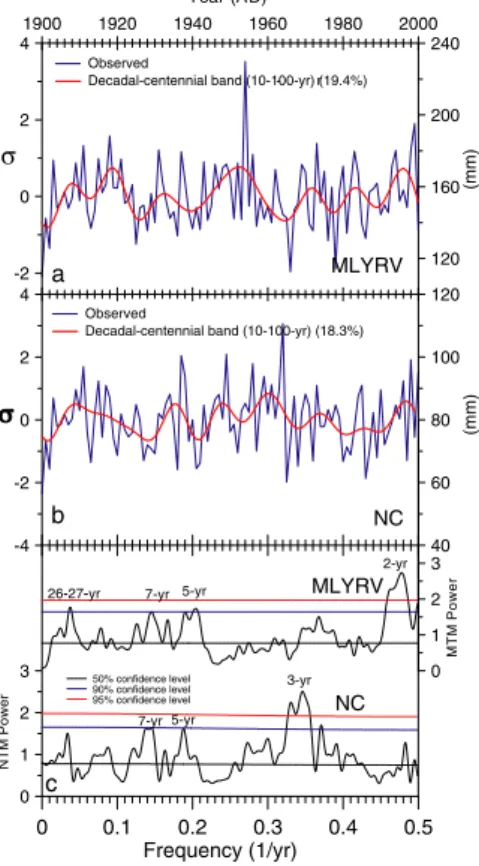
During the last century, large interannual variability in summer precipitation is ob-served in both regions (Fig. 2a, b). In the MLYRV, average monthly summer precipi-tation varied from 110 mm (1900) to 230 mm (more than 2 standard deviation, 1958), 10
while it varied from 55 mm (1900) to 113 mm (1964) in NC. Spectral analysis of these two time series reveals some significant cycles. In the MLYRV, 2-yr cycle is significant at the 95% confidence level, whereas 5-yr, 7-yr, and 26–27yr cycles are significant at the 90% confidence level (Fig. 2c). In NC, 3-yr, 5-yr, and 7-yr cycles are significant at the 95% or 90% confidence levels. A number of studies have indicated that the inter-15
annual variability in summer precipitation over the Asian monsoon region is associated with the tropospheric biennial oscillation (TBO, Shen and Lau, 1995; Webster et al., 1998; Yang and Lau, 2006), ENSO events (Wang et al., 2000; Lau and Wu, 2001), and snow cover (Wu and Qian, 2003; Yang and Lau, 2006). 2–3-yr and 5–7-yr cycles revealed by summer precipitation in the MLYRV and NC are typical TBO and ENSO 20
signals. Decadal variability in summer precipitation in NC is not as significant as in the MLYRV, where a bidecadal oscillation exhibits at the 90% confidence level. Wavelet filtering of the time series shows that decadal-centennial band oscillations only explain 19.4% and 18.3% variance of summer precipitation in the MLYRV and NC, respectively. 3.2 Variability of summer precipitation in proxy data
25
Proxy data of summer precipitation used here are DWI derived from the Chinese his-torical documents. This proxy data covers the past 1500 yr. Due to that 10-yr moving average was involved in developing regional DFI for the MLYRV and NC, high frequency
CPD
4, 611–643, 2008
Variability of summer precipitation
over eastern China C. Shen et al. Title Page Abstract Introduction Conclusions References Tables Figures ◭ ◮ ◭ ◮ Back Close
Full Screen / Esc
Printer-friendly Version Interactive Discussion
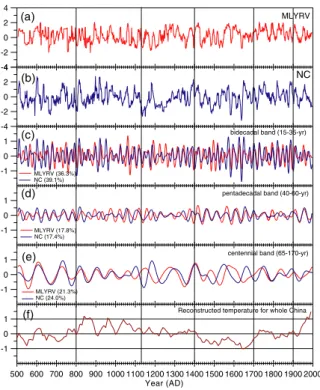
variability in the regional DWI time series was removed (Zheng et al., 2006). There-fore, they are more suitable to be used to examine decadal to centennial variability instead of interannual variability. Figure 3a and b show the normalized time series of DWI for the MLYRV and NC. To detect significant decadal to centennial variability, we conducted the MTM analysis on the two time series. As shown by Fig. 4, decadal 5
to centennial periodicities are well presented in both time series. For the MLYRV, the centennial band (65–170-yr) is dominated by the 100–110-yr and 120–170-yr oscilla-tions, which are significant at the 95% confidence level. A peak stands up at 78–95-yr at the 90% confidence level. The major mode of the pentadecadal band oscillation is 43–52-yr periodicity with more than 99% confidence level. Bidecadal band (15–35-yr) 10
consists of five oscillation modes, i.e. 15–17-yr, 18–19-yr, 21–23-yr, 26–28-yr, and 30– 33-yr periodicities. Theses modes exceed the 95% confidence level. Additionally, a quadridecadal oscillation (36–39-yr) with more than 99% confidence level is also seen in the MLYRV time series. For NC, the centennial band consists of two cyclical modes at the 95% confidence level, including 68–76-yr and 86–130-yr variations. A peak of 15
43–48-yr with the 95% confidence level exhibits at the pentadecadal band. Significant periodicities at the bidecadal band are 17–19-yr, 20–29-yr, and 31–35-yr, in which the most prominent cyclic mode is 20–29-yr variation.
We employed wavelet approach to determine the temporal evolution of dominant os-cillation bands revealed by the MTM. Bidecadal, pentadacadal, and centennial bands 20
explain 36.3% (39.1%), 17.8% (17.4%), and 21.3% (24%) of variance of the MLYRV (NC) time series. The amplitudes of these bands were not constant through time and they varied substantially from one period to another over the past 1500 yr (Fig. 4c– e). Six intervals are distinguished by the temporal evolution in the amplitude of these bands. The strongest signal of centennial oscillation occurred before AD 800 in both 25
NC and the MLYRV. The variation in the MLYRV was in good phase coherence with that in NC. The pentadecadal oscillation mode was weak in the MLYRV, whereas it was relatively strong in NC from AD 500 to 800. During this period, the bidecadal oscillation in the MLYRV time series was weak in its early half and strong in its late half.
Con-CPD
4, 611–643, 2008
Variability of summer precipitation
over eastern China C. Shen et al. Title Page Abstract Introduction Conclusions References Tables Figures ◭ ◮ ◭ ◮ Back Close
Full Screen / Esc
Printer-friendly Version Interactive Discussion
versely, it was strong in NC time series from AD 500 to 700, and weak from AD 700 to 800. The amplitude of the centennial oscillation in both time series gradually decreased and reached their minima during the period from AD 800 to 1130. On the other hand, the phase relation of the centennial oscillation between two regions changed from “in-phase” to “out-of-“in-phase” at the end of this period. During this period, the pentadecadal 5
oscillation over NC and the MLYRV changed from weak to strong in a way opposite to that of the centennial oscillation. The bidecadal oscillation was strong in AD 900–1000 and AD 1060–1130, and it was weak in the other intervals of this period. The period of AD 1130–1400 is characterized by strong centennial mode and weak pentadecadal os-cillation. The amplitude of bidecadal oscillation over the MLYRV was strong, whereas 10
it was relatively weak over NC during this period. The strongest pentadecadal oscil-lation over NC and the MLYRV occurred in the period from AD 1400 to 1700, when the centennial oscillation was still as strong as in the previous period. During this pe-riod, the bidecadal oscillation was relatively strong over the MLYRV, whereas its power reached the maxima over NC. The variation of centennial and pentadecadal oscilla-15
tions decreased in the interval from AD 1700 to 1900, when the bidecadal oscillation maintained strong. The 20th century is distinguished from preceding interval by weak centennial and bidecadal oscillations and strong pentadecadal oscillation.
After analyzing DWI data of AD 1470–1950 and observed summer rainfall of 1951– 1999 from individual station over eastern China (25 stations), Zhu and Wang (2002) 20
found an 80-yr oscillation with the 95% confidence level in some areas. This oscilla-tion over NC was out of phase to that along the MLYRV during the past 530 yr. Our results derived from spectral analysis and wavelet filtering suggested the occurrence of this centennial oscillation from a regional precipitation view. However, the phase relationship between NC and the MLYRV was not constant during the past 1500 yr. 25
“Out-of-phase” as indicated by Zhu and Wang (2002) and “in-phase” were found after and before AD 1100. This phenomenon probably suggests a major shift of climate around AD 1100 over China. Some previous studies (e.g. Wang and Zhang, 1996) indicated that the largest shift of climate in both precipitation and temperature during
CPD
4, 611–643, 2008
Variability of summer precipitation
over eastern China C. Shen et al. Title Page Abstract Introduction Conclusions References Tables Figures ◭ ◮ ◭ ◮ Back Close
Full Screen / Esc
Printer-friendly Version Interactive Discussion
the last two millennia in China occurred around AD 1230. It seems reasonable to speculate that this transition in the phase relationship of centennial oscillation between NC and the MLYRV could have been caused by a major shift of climate over China in 12th or 13th century. A comparison of reconstructed temperature from multi-proxy data in China (Yang et al., 2004) with our results further supports our speculation. The 5
warm period (so-called Medieval Warm Period) ended around AD 1100 in China. This comparison also reveals an interesting fact that dominant long-term oscillation modes varied during the last 1500 yr under different temperature conditions. During the warm periods such as the Medieval Warm Period (AD 800–1100) and 20th century, the cen-tennial oscillation was weak and the pentadecadal oscillation was strong. During the 10
cold periods such as AD 500–800 and AD 1400–1700, both the centennial and pen-tadecadal oscillations were strong, although the penpen-tadecadal oscillation in the MLYRV was not as strong as that in NC during the former cold period. During the normal condi-tions such as periods of AD 1100–1400 and AD 1700–1900, the centennial oscillation was relatively strong whereas pentadecadal oscillation was very weak. The correla-15
tion of temperature conditions with the bidecadal oscillation is not as clear as that with the centennial and pentadecadal oscillations, although strong signals of the bidecadal oscillation more frequently occurred in cold or normal conditions.
3.3 Variability of summer precipitation in modeled data
Here we present the results of millennium simulations using the version of NCAR-20
CCSM2.0. Three experiments including an AD 1000 control run, a run with orbital forcing and solar forcing, and another run with full forcing, were carried out in this study. In the AD 1000 control run, the model was first run fully coupled for 300 yr in a spin up mode with constant 1990 conditions. The run was then continued from year 300 without any forcing changes (fixed at AD 1000 forcing conditions, i.e. solar forcing 25
is 1365.0 W.m−2, the concentration of CO2, CH4, N2O, CFC-11, and CFC-12 are 280,
680, 266, 0, and 0 ppbv, respectively) and was run fully coupled for 1000 yr. The forced simulations were started from fully coupled 300 yr. The orbital parameter is almost
CPD
4, 611–643, 2008
Variability of summer precipitation
over eastern China C. Shen et al. Title Page Abstract Introduction Conclusions References Tables Figures ◭ ◮ ◭ ◮ Back Close
Full Screen / Esc
Printer-friendly Version Interactive Discussion
constant during the last 1000 yr; it is thus neglected in our interpretations of model data.
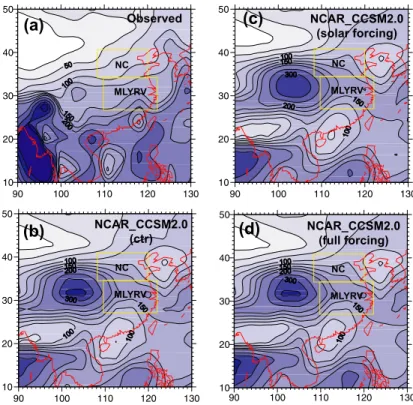
Figure 5 shows the spatial patterns of summer precipitation (May–September) over East Asia (10–50◦N, 90–130◦E) in observed and simulated data from 1950 to 1995. Generally, CCSM2.0 underestimates the summer precipitation in the regions south to 5
30◦N, whereas it overestimates in the regions north to 30◦N, especially the Sichuan Basin. This might be an indication that CCSM2.0’s performance in simulating the effect of the Tibetan Plateau on precipitation needs to be improved. However, the spatial pattern of summer precipitation in the regions beyond the Tibetan Plateau, such as eastern China, is better simulated in the three experiments, although the summer pre-10
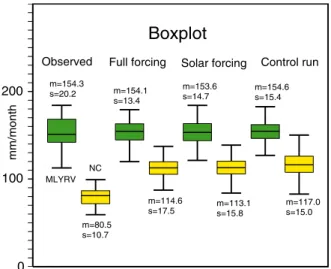
cipitation is obviously underestimated in the southeastern costal region. Nevertheless, the summer precipitation is well simulated in our study regions, the MLYRV and NC, where a zonal gradient of summer precipitation similar to observed pattern exhibits significantly in the three experiments. Figure 6 shows a comparison of distribution statistics (full range, 25th, 50th, 75th quartiles and the mean) in observed and mod-15
eled summer precipitation from 1951 to 1995 in the MLYRV and NC. The simulated means and medians of summer precipitation in three experiments are rather stable and they are close to the observed ones in the MLYRV. The dispersion ranges of simulated summer precipitation for this period in the MLYRV are also comparable to that from observation. The simulated means and medians in NC are about 20–30 mm higher 20
than observed ones. The dispersion range for NC in the experiment with full forcing is smaller than other two experiments and it is close to the observed one. Although the difference in modeled summer precipitation between the two regions is not as distinct as observed one, one-sample T-test indicates that the means of summer precipitation in the two regions are significantly different at the 99.99% confidence level, suggesting 25
that these two regions apparently belong to different regimes of summer precipitation as indicated by observed data. Therefore, it seems reasonable to use these mod-eled data in these two regions to determine the variability of summer precipitation in millennium simulations and then to further compare with proxy data.
CPD
4, 611–643, 2008
Variability of summer precipitation
over eastern China C. Shen et al. Title Page Abstract Introduction Conclusions References Tables Figures ◭ ◮ ◭ ◮ Back Close
Full Screen / Esc
Printer-friendly Version Interactive Discussion
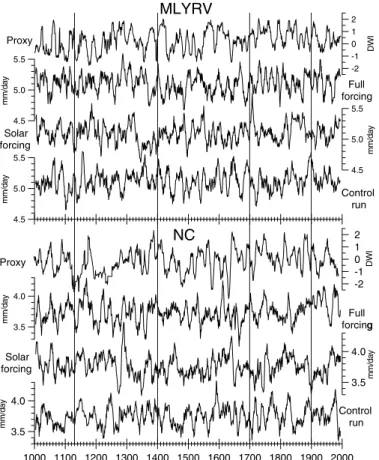
Figure 7 shows time series of simulated summer precipitation in the MLYRV and NC during the last millennium. 10-yr moving averages are taken for three purposes, i.e. maximizing the signal-to-noise ratio, emphasizing the decadal to centennial variability, and maintaining a consistence with proxy data for a model-data comparison. The gen-eral impression from the figure is that the difference of simulated summer precipitation 5
is relatively large among three experiments and the summer precipitation varies in an apparent periodic manner. This large difference is not unexpected since the control run with fixed forcing only reproduces the internal variability of summer precipitation and the other two runs driven by solar forcing and full forcing probably capture both internal and external variability. The model-data comparison for the MLYRV and NC indicates 10
that the full forcing run produces the temporal pattern similar most to that observed in proxy data. We note that the temporal pattern in full forcing run matches that in the solar forcing run and proxy data well in its the early 180 yr (AD 1000–1180). This is presumably due to inactive volcanic activities during in this period. The structure of temporal pattern in full forcing run is similar to that in proxy data from AD 1180–1900, 15
although these peaks and valleys in these time series do not parallel exactly between model and proxy data. The difference in temporal patterns between two runs of solar forcing and full forcing becomes larger during this period. The poor matches between model and proxy data as well as different runs occur in the last century. Therefore, it seems reasonable to speculate that different combinations of forcing conditions would 20
modulate the variability in summer precipitation during the different periods.
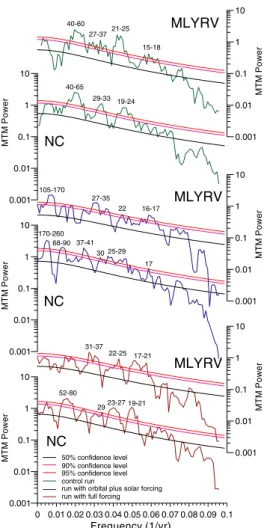
Proxy data of summer precipitation exhibits some significant decadal to centennial oscillations during the last 1500 yr. To examine possible attributions of these oscilla-tions, we also conduct MTM analysis on the modeled summer precipitation from three runs. As shown by Fig. 8, only decadal to multidecadal periodicities are well presented 25
for the MLYRV and NC in the control run. The most prominent oscillation mode for both regions is the pentadecadal (40–60-yr) periodicity, which is significant at the 95% confidence level. Other significant oscillation modes for the MLYRV include 15–18-yr, 21–25-yr, and 27–37-yr cycles. The latter two cycles are also found in NC. No
signif-CPD
4, 611–643, 2008
Variability of summer precipitation
over eastern China C. Shen et al. Title Page Abstract Introduction Conclusions References Tables Figures ◭ ◮ ◭ ◮ Back Close
Full Screen / Esc
Printer-friendly Version Interactive Discussion
icant centennial band (65–170-yr) oscillation shows up in the control run. In the solar forcing run, the dominant oscillations with the 95% confidence level in the MLYRV are 16–17-yr, 22-yr, 27–35, and 105–170-yr periodicities, whereas they are 17-yr, 25–29-yr, 30-25–29-yr, 37–41-25–29-yr, 68–90-25–29-yr, and 170–260-yr cycles in NC. Additionally, there are two cycles at 50–60-yr and 65–80-yr significant at the 90% confidence level in the MLYRV. 5
In the full forcing run, the major oscillation modes for the MLYRV are 17–21-yr, 22– 25-yr, and 37–41-yr variations, which are significant at the 95% confidence level. A 50–72-yr cycle with the 90% confidence level is also seen in the MLYRV. In NC, signif-icant oscillation modes include 19–21-yr, 23–27-yr, 29-yr, and 56–80-yr periodicities. Theses modes are significant at the 95% confidence level.
10
As mentioned above, three dominant cyclic modes revealed by proxy data are bidecadal band (15–35-yr), pentadecadal band (40–60-yr), and centennial band (65– 170-yr) oscillations. Centennial band oscillation is not found in the control run, indi-cating that it is not an internal variability. This oscillation is clearly visible in the solar-forcing and full solar-forcing runs, especially in the solar-solar-forcing run. This suggests that in 15
broad terms the model correctly captures the impact of solar forcing on long-term varia-tion in summer precipitavaria-tion over eastern China, although peaks in the centennial band oscillation revealed by proxy do not match those in the two simulations with solar forc-ing and full forcforc-ing. Since there are chaotic components of internal variability in models and some uncertainties in the forcing reconstructions, it is not realistic to anticipate that 20
models reproduce the exact variability registered in proxy data. Therefore, this centen-nial oscillation could be linked to external forcing. The most potential pacemaker of this centennial oscillation in summer precipitation is the century-type periodicity known as Gleissberg cycle in solar forcing, as suggested by some previous studies (e.g. Zhu and Wang, 2002). The change in the length of this variation in proxy data (from 68 to 25
about 170 yr) may reflect the respective changes in the length of the Gleissberg cycle, which has been considered not constant and varies from about 65 to more than 130 yr (70–80-yr and 100–120-yr modes dominate) (Ogurtsov et al., 2002). The behavior of the amplitude of this centennial oscillation shows significant episode changes in proxy
CPD
4, 611–643, 2008
Variability of summer precipitation
over eastern China C. Shen et al. Title Page Abstract Introduction Conclusions References Tables Figures ◭ ◮ ◭ ◮ Back Close
Full Screen / Esc
Printer-friendly Version Interactive Discussion
data. This might be partially due to the change in the amplitude of the Gleissberg cycle during different period, and partially due to the change in land surface temperature as mentioned above.
Another dominant oscillation registered in proxy data is the pentadecadal oscillation (40–60-yr). This oscillation is not significant in short observation records (1951–2004 5
and 1880–2002; Ding et al., 2007). The predominant oscillation mode in observation records is bidedacadal or 30–40-yr periodicity (Li et al., 2004; Ding et al., 2007). It is interesting to note that this oscillation clearly stands up in the control run with the 99% confidence level. This might be an indication that this oscillation is an internal fluctuation of the climate system. It has been suggested that the multidecadal variation 10
of summer precipitation over eastern China is associated with the internal process of the ocean-atmosphere, such as ENSO events and PDO (Li et al., 2005; Zhou et al., 2006). Several studies have characterized the PDO as emerging from a phase-locked interaction between oscillations with ca. 20 and 50-yr periods, and regime shifts occur when the oscillations change phase simultaneously (Nakamura et al., 1997; Minobe, 15
1999, 2000). The amplitude of the pentadecadal variation, an oscillation providing the basic regime timescale of PDO is not constant through time as indicated by Fig. 3 and some previous studies (e.g. Shen et al., 2006). Therefore, this oscillation is likely an internal variability of the ocean-atmosphere system and its length and amplitude might be modulated by external forcing or other internal processes. Schlesinger and Ra-20
mankutty (1994) found that there is a 65–70-yr oscillation in temperature of Northern Hemisphere and it is the statistical result of 50–88-yr oscillations. Comparing observa-tions with model simulaobserva-tions, they suggested that this oscillation arises from the internal variability of the ocean-atmosphere system. Using a fully coupled ocean-atmosphere model, Delworth et al. (1993) showed a climatic oscillation with a time scale of approx-25
imately 50 yr produced by the ocean-atmosphere interaction. Goswami (2006) noted a quasi 50–60-yr interdecadal fluctuation in interannual variability of the south Asian summer monsoon, the east Asian summer monsoon, and the ENSO. He hypothesized that this oscillation of the Asian monsoon and ENSO is a manifestation of a global
CPD
4, 611–643, 2008
Variability of summer precipitation
over eastern China C. Shen et al. Title Page Abstract Introduction Conclusions References Tables Figures ◭ ◮ ◭ ◮ Back Close
Full Screen / Esc
Printer-friendly Version Interactive Discussion
coupled ocean-atmosphere mode of oscillation. These findings support our interpreta-tion of this pentadecadal oscillainterpreta-tion as an internal variability of the ocean-atmosphere system.
The bidecadal band oscillation (15–35-yr) in proxy data consists of a series of oscil-lation modes. Dominant modes include 15–19-yr, 21–29-yr and 31–35-yr periodicities. 5
These oscillation modes can be found in both control run and forced runs. Thus it is difficult to determine whether it is an internal or external variability. Previous studies suggested that the decadal-interdecadal oscillations within bidecadal band found in the Pacific sea-surface temperature, ENSO events, and PDO are largely internal, resulting from the ocean-atmosphere interaction and the tropical-extratropical interaction (Zhang 10
et al., 1997; Nakamura et al., 1997; Minobe, 1999; Evans et al., 2001; Liu et al., 2002; Deser et al., 2004; Schneider and Cornuelle, 2005; Nonaka et al., 2006). Therefore, the bidecadal band oscillation in our proxy and model data is likely an internal variabil-ity.
3.4 Variability in spatial pattern of summer precipitation in proxy and modeled data 15
As mentioned in the introduction, some studies using relatively short observed data (several decades to one century) indicated an increase in the frequency of drought-in-north/flood-in-south over eastern China during the last few decades (Xu, 2001; Ding et al., 2007). It is evident that records longer than multi-decade are necessary to examine whether this conclusion is solid in the millennium or multi-century context of climate. 20
Here we use both proxy and model data to examine the dominant spatial patterns of anomalous summer precipitation events over eastern China and to determine how un-usual this spatial pattern of summer precipitation recorded in the last few decades. The annually-resolved proxy data of summer precipitation used here is the area-weighted regional DWI developed from the network of DWI over eastern China (Shen et al., 25
2007). It covers the last 530 yr. Model data is from the full forcing run. Both data are standardized using the means and standard deviations of 1951–1995.
CPD
4, 611–643, 2008
Variability of summer precipitation
over eastern China C. Shen et al. Title Page Abstract Introduction Conclusions References Tables Figures ◭ ◮ ◭ ◮ Back Close
Full Screen / Esc
Printer-friendly Version Interactive Discussion
summer precipitation in the MLYRV and NC. We use one standard deviation as the criterion to define an anomalous summer precipitation event. When the standardized DWI values in two regions are within the range of one standard deviation, this year wit-nesses a normal summer in precipitation. As the standardized DWI value in any region is beyond the range of one standard deviation, this year is defined as an anomalous 5
summer precipitation event. Its spatial pattern is then assigned through comparing the standardized DWI values in the two regions. Two modes, coherence and dipole consisting four spatial patterns, are then defined. Coherence mode includes coherent drought and coherent flood, whereas the dipole mode includes drought-in-north/flood-in-south and flood-in-north/drought-drought-in-north/flood-in-south. After this procedure, we use a moving 10
20-yr window to calculate the occurrence probability of four spatial patterns of anoma-lous summer precipitation events and normal conditions.
The distribution statistics of their occurrence probability in 530-yr proxy and model data is shown in the lower panel of Fig. 9. As expected, normal conditions have the highest occurrence probability in both proxy and model data. During the past 530 yr, 15
the most frequent anomalous summer precipitation event was coherent flood with a mean of 0.18. The second one was coherent drought with a mean of 0.1. Two spatial patterns of dipole mode occurred less frequently than the spatial patterns of coher-ence mode. There are some extreme values in the occurrcoher-ence probability of coherent drought, and two dipole patterns. These extreme values indicate some time intervals 20
with extremely high occurrence probability of these spatial patterns. The periods with extremely high probability (0.35 or 0.30) of coherence drought were AD 1481–1490 and 1927–1942. The high frequency of drought-in-north/flood-in-south occurred in AD 1555–1565, 1601–1610, and 1980–2000 (with probability of more than 0.25). The flood-in-north/drought-in-south was the most frequent anomalous summer precipita-25
tion event in AD 1645–1654 and 1955–1964. For the last two decades, the occur-rence probabilities of coherent drought, coherent flood, and flood-in-north/drought-in-south are close to their means of the last 530 yr. The probability of normal conditions is markedly lower than its means, close to a statistically significant level, indicating
CPD
4, 611–643, 2008
Variability of summer precipitation
over eastern China C. Shen et al. Title Page Abstract Introduction Conclusions References Tables Figures ◭ ◮ ◭ ◮ Back Close
Full Screen / Esc
Printer-friendly Version Interactive Discussion
that anomalous summer precipitation events happened more frequently in recent two decades. The probability value of drought-in-north/flood-in-south occurs as an outlier, i.e. this value is significantly different from its mean of the last 530 yr at the 99% con-fidence level. It means that this variability in spatial pattern of summer precipitation during the last two decades is unusual even in the five-century context. Model data 5
seems to support observed result, although there is somewhat difference in the proba-bility distribution of normal conditions and four spatial patterns of anomalous summer precipitation events. For the last two decades, a decrease in the occurrence probability of normal conditions and an increase in the probability of drought-in-north/flood-in-south are visibly apparent, although statistically they are not significantly different from 10
their means.
4 Concluding remarks
This study analyzes observational, proxy, and model data to investigate the variabil-ity of summer precipitation over eastern China during the last millennium with a focus on the middle and lower Yangtze River Valley and North China. On the interannual 15
scale, 2–3-yr and 5–7-yr cycles, typical TBO and ENSO signals are well presented in observational data over the MLYRV and NC. Oscillations on the decadal scale are not as distinct as these on the interannual scale in the instrumental times. Spectral analy-sis of regional proxy data of summer precipitation reveals three statistically significant oscillation bands, i.e. bidecadal (15–35-yr), pendadecadal (40–60-yr), and centennial 20
(65–170-yr) band during the past 1500 yr. The time evolutions of these bands revealed by the wavelet filtering indicate that the amplitudes of these oscillation bands are not constant through time. They vary substantially from one period to another over the past 1500 yr. A comparison of the behaviors of these oscillation bands with temperature conditions in China shows that these periods distinguished by the temporal evolutions 25
of oscillations corresponds those episodes with different temperature conditions very well. Weak centennial oscillation and strong pentadecadal oscillation occurred in warm
CPD
4, 611–643, 2008
Variability of summer precipitation
over eastern China C. Shen et al. Title Page Abstract Introduction Conclusions References Tables Figures ◭ ◮ ◭ ◮ Back Close
Full Screen / Esc
Printer-friendly Version Interactive Discussion
conditions during the MWP and 20th century. During the cold periods of AD 500–800 and AD 1400–1700, both the centennial and pentadecadal oscillations were strong. When the temperature was in relatively normal conditions, pentadecadal oscillation was very weak while the centennial oscillation was relatively strong. Our analyses also show that the phase relationship in centennial oscillation between NC and the MLYRV 5
was not constant during the past 1500 yr. It changed from “in-phase” to “out-of-phase” at about AD 1100. It may suggest a major shift of climate in China around AD 1100.
A comparison of observational data with modeled data from millennium simulations using NCAR-CCSM2.0 shows that the model correctly reproduces the tempo-spatial patterns of summer precipitation over East Asia in broad terms. Analyses of model 10
results indicate that the model also captures the impact of climate forcing on long-term variation in summer precipitation over eastern China. A model/data intercomparison suggests that the centennial oscillation might be linked to the fluctuation of solar forc-ing (Gleissberg cycle), and the pentadecadal and bidecadal oscillations be associated with internal variability of climate system. However, further analyses on the model 15
results such as ocean and land temperature, atmospheric circulations, and moisture transportation are needed to separate the factors governing these oscillations and bet-ter understand underlying mechanisms.
In this study, we also analyze the occurrence probability of spatial patterns of anoma-lous summer precipitation events using proxy and model data. Our analyses on both 20
model and proxy data demonstrate that an increase in the frequency of drought-in-north/flood-in-south over eastern China during the last two decades is unusual in the past five centuries. The study of Menon et al. (2002) suggested that this trend might be related to increased black carbon aerosols.
Acknowledgements. This work is supported by a grant from the Office of Biological and
En-25
vironmental Sciences, Office of Sciences, US Department of Energy (DOE) to SUNY-Albany; and the China Meteorological Administration, Chinese Academy of Sciences, the National Nat-ural Science Foundation of China. The millennium simulations of climate were conducted by Y. Peng as a part of her Ph.D dissertation.
CPD
4, 611–643, 2008
Variability of summer precipitation
over eastern China C. Shen et al. Title Page Abstract Introduction Conclusions References Tables Figures ◭ ◮ ◭ ◮ Back Close
Full Screen / Esc
Printer-friendly Version Interactive Discussion
References
Allen, M. R. and Ingram, W. J.: Constraints of future changes in climate and the hydrologic cycle, Nature, 419, 224–231, 2003.
Ammann, C. M., Joos, F., Schimel, D. S., Otto-Bliesner, B. L., and Tomas, R. A.: Solar influence on climate during the past millennium: results from transient simulations with the NCAR
5
Climate System Model, Proc. Natl. Acad. Sci. USA, 104, 3713–3718, 2007.
Barnnet, T. P., Hasselmann, K., Chelliah, M., Delworth, T., Hegerl, G., Jones, P., Rasmussen, E., Roeckner, E., Ropelewski, C., Santer, B., and Tett, S.: Detection and attribution of climate change : A status report, B. Am. Meteorol. Soc., 12, 2631–2659, 1999.
Bauer, E., Claussen, M., Brovkin, V., and Huenerbein, A.: Assessing climate forcing of the Earth
10
system for the past millennium, Geophys. Res. Lett., 30, 1276, doi:10.1029/2002GL016639, 2003.
Bradley, R. S., Briffa, K. R., Cole, J., Hughes, M. K., and Osborn, T. J.: The climate of the last millennium, in: Paleoclimate, Global Change and the Future, edited by: Alverson, K., Bradley, R. S., and Pedersen, T. F., Springer-Verlag, Berlin, 105–141, 2003.
15
Chang, C. P., Zhang, Y., and Li, T.: Interanual and interdecadal variation of the East Asian sum-mer monsoon rainfall and tropical SSTs: Part 1, Roles of the Subtropical Ridge, J. Climate, 13, 4310–4325, 2000.
Clemens, S. C., Wang, P., and Prell, W. L. (Eds.): Asian monsoons and global linkages on milankovitch and sub-milankovitch time scales, Mar. Geol., 201, 1–250, 2003.
20
CNMA (Chinese National Meteorological Administration): Yearly Charts of Dryness/wetness in China for the Last 500-year Period, Chinese Cartographic Publishing House, Beijing, 1981. Crowley, T. J.: Causes of climate change over the past 1000 years, Science, 289, 270–277,
2000.
Crowley, T. J., Baum, S. K., Kim, K.-Y., Hegerl, G. C., and Hyde, W. T.: Modelling ocean
25
heat content changes during the last millennium, Geophys. Res. Lett., 30(18), 1932, doi:10.1029/2003GL017801, 2003.
Delworth, T., Manbe, M., and Stouffer, R. J.: Interdecadal variations of the thermohaline circu-lation in a coupled ocean-atmosphere model, J. Climate, 6, 1993–2011, 1993.
Deser, C., Phillips, A. S., and Hurrell, J.W.: Pacific interdecadal climate variability: linkages
30
between the tropics and the North Pacific during boreal winter since 1900, J. Climate, 17, 3109–3124, 2004.
CPD
4, 611–643, 2008
Variability of summer precipitation
over eastern China C. Shen et al. Title Page Abstract Introduction Conclusions References Tables Figures ◭ ◮ ◭ ◮ Back Close
Full Screen / Esc
Printer-friendly Version Interactive Discussion Ding, Y., Wang, Z., and Sun, Y.: Inter-decadal variation of the summer precipitation in
East China and its association with decreasing Asian summer monsoon, Int. J. Climatol., doi:10.1002/joc.1615, 2007.
Ding, Y.: Monsoons over China, Kluwer Academic Publishers, Dordrecht, 419 pp., 1991. Evans, M. N., Cane, M. A., Schrag, D. P., Kaplan, A., Linsley, B. K., Villalba, R., and Wellington,
5
G. M.: Support for tropically-driven Pacific decadal variability based on paleoproxy evidence, Geophys. Res. Lett., 28, 3689–3692, 2001.
Feddema, J. J., Oleson, K. W., Bonan, G. B., Mearns, L. O., Buja, L. E., Meehl, G. A., and Washington, W. M.: The importance of land-cover change in simulating future climates, Sci-ence, 310, 1674–1678, 2005.
10
Fu, C.: impacts of human-induced land cover change on East Asia monsoon, Global Planet. Change, 37, 219–229, 2003.
Ghil, M., Allen, M. R., Dettinger, M. D., Ide, K., Kondrashov, D., Mann, M. E., Robertson, A. W., Saunders, A., Tian, Y., Varadi, F., and Yiou, P.: Advanced spectral methods for climatic time series, Rev. Geophys., 40, doi:10.1029/2000RG000092, 2002.
15
Giorgi, F.: Climate change prediction, Climatic Change, 73, 239–265, 2005.
Goswami, B. N.: The Asian monsoon: interdecadal variability, in: The Asian Monsoon, edited by: Wang, B., Springer-Verlag, Berlin, 295–326, 2006
Gupta, A.K., Das, M., and Anderson, D.M.: Solar influence on the Indian summer monsoon during the Holocene, Geophys. Res. Lett., 32, L17703, doi:10.1029/2005GL022685, 2005.
20
Hulme, M.: A 1951–80 global land precipitation climatology for the evaluation of general circu-lation models, Clim. Dynam., 7, 57–72, 1992.
Hulme, M.: Global changes in precipitation in the instrumental period. In: Global Precipitation and Climate Change, edited by: Desbois, M. and D ´esalmand, F. , Springer-Verlag, 387–405, 1994.
25
IPCC: Climate change 2001: The scientific basis, edited by: Houghton, J. T., Ding, Y., Griggs, D. J., Noguer, M., Van der Linden, P. J., Dai, X., Maskell, K., and Johnson, C. A., Cambridge University Press, Cambridge, 2001.
IPCC: Climate Change 2007: The Physical Science Basis. Contribution of Working Group I to the Fourth Assessment Report of the Intergovernmental Panel on Climate Change (IPCC),
30
edited by: Solomon, S., Qin, D., Manning, M., Chen, Z., Marquis, M., Averyt, K. B., Tignor, M., and Miller, H. L., Cambridge University Press, Cambridge, UK and New York, NY, 2007. Jones, P. D. and Mann, M. E.: Climate over past millennia, Rev. Geophys., 42, 1–42, 2004.
CPD
4, 611–643, 2008
Variability of summer precipitation
over eastern China C. Shen et al. Title Page Abstract Introduction Conclusions References Tables Figures ◭ ◮ ◭ ◮ Back Close
Full Screen / Esc
Printer-friendly Version Interactive Discussion Jones, P. D., Osborn, T. J., and Briffa, K. R.: The evolution of climate over the last millennium,
Science, 292, 662–667, 2001.
Lau, K.-M. and Wu, H. T.: Principal modes of rainfall–SST variability of the Asian summer monsoon: a reassessment of the monsoon–ENSO relationship, J. Climate, 14, 2880–2895, 2001.
5
Li, C., He, J., and Zhu, J.: A review of decadal/interdecadal climate variation studies in China, Adv. Atmos. Sci., 21, 425–436, 2004.
Li, Q., Yang, S., Kousky, V. E., Higgins, R. W., Lau, K. M., and Xie, P.: Features of cross-Pacific climate shown in the variability of China and US precipitation, Int. J. Climatol., 25, 1675–1696, 2005.
10
Liu, Z., Wu, L., Gallimore, R., and Jacob, R.: Search for the origins of Pacific decadal climate variability, Geophys. Res. Lett., 29, 1404, doi:10.1029/2001GL013735, 2002.
Menon, S., Hansen, J., Nazarenko, L., and Luo, Y.: Climate Effects of Black Carbon Aerosols in China and India, Science, 297, 2250–2253, 2002.
Minobe, S.: Resonance in bidecadal and pentadecadal climate oscillations over the North
15
Pacific: Role in climatic regime shifts, Geophys. Res. Lett., 26, 855–858, 1999.
Minobe, S.: Spatio-temporal structure of the pentadecadal variability over the North Pacific, Prog. Oceanogr., 47, 381–408, 2000.
Nakamura, H., Lin, G., and Yamagata, T.: Decadal climate variability in the North Pacific during the recent decades, B. Am. Meteorol. Soc., 78, 2215–2225, 1997.
20
Nonaka, M., Nakamura, H., Tanimoto, Y., Kagimoto, T., and Sasaki, H.: Decadal variability in the Kurishio-Oyashio extension simulated by an eddy-resolving OGCM, J. Climate, 19, 1970–1989, 2006.
Ogurtsov, M. G., Kocharov, G. E., Lindholm, M., Meril ¨ainen, J., and Eronen, M.: Evidence of solar variation in the tree-ring based climate reconstruction of northern Fennoscandia, Sol.
25
Phys., 205, 403–417, 2002.
Samel, A. N., Wang, W-C., and Liang, X. Z.: The Monsoon rainband over China and relation-ships with the Eurasian circulation, J. Climate, 12, 115–131, 1999.
Schlesinger, M. E. and Ramankutty, N.: An oscillation in the global climate system of period 65-70 years, Nature, 367, 723–726, 1994.
30
Schneider, N. and Cornuelle, B. D.: The forcing of the Pacific decadal oscillation, J. Climate, 18, 4355–4373, 2005.
CPD
4, 611–643, 2008
Variability of summer precipitation
over eastern China C. Shen et al. Title Page Abstract Introduction Conclusions References Tables Figures ◭ ◮ ◭ ◮ Back Close
Full Screen / Esc
Printer-friendly Version Interactive Discussion
AD reconstructed from proxy data of summer rainfall over eastern China, Geophys. Res. Lett., 33, doi:10.1029/2005GL024804, 2006.
Shen, C., Wang ,W-C., Hao, Z., and Gong, W.: Characteristics of Anomalous
Pre-cipitation Events over Eastern China during the Past Five Centuries, Clim. Dynam., doi:10.1007/s00382-007-0323-0, 2007.
5
Shen, S. and Lau, K. M.: Biennial oscillation associated with the east Asian monsoon and tropical sea surface temperatures, J. Meteorol. Soc. Jpn, 73, 105–124, 1995.
Torrence, C. and Compo, G. P.: A practical guide to wavelet analysis, B. Am. Meteorol. Soc., 79, 61–78, 1998.
Waliser, D. E.: Intraseasonal variability, in: The Asian Monsoon, edited by: Wang, B.,
Springer-10
Verlag, Berlin, 203–257, 2006.
Wang, B. (Ed.): The Asian monsoon, Springer-Verlag, Berlin, 787 pp., 2006.
Wang, B., Wu, R., and Fu, X.: Pacific–East Asian teleconnection: how does ENSO affect East Asian climate?, J. Climate, 13, 1517–1536, 2000.
Wang, J. and Zhang, P.: Abrupt change of climate in Chinese historical times. In: Historical
15
climate change in China, edited by: Shi, Y. and Zhang, P., Shandong Science and Technology Press, Jinan, 464–467, 1996.
Webster, P. J., Magana, V. O., Palmer, T. N., Shukla, J., Tomas, R. A., Yanai, M., and Yasunari, T.: Monsoons: processes, predictability, and the prospects for prediction, J. Geophys. Res., 14, 14 451–14 510, 1998.
20
Wu, T. and Qian, Z.: The relation between the Tibetan winter snow and the Asian summer monsoon and rainfall: an observational investigation, J. Climate, 16, 2038–2051, 2003. Xu, Q.: Abrupt change of the mid-summer climate in central east China by the influence of
atmospheric pollution, Atmos. Environ., 35, 5029–5040, 2001.
Yang, B., Braeuning, A., Johnson, K. R., and Shi, Y.: General characteristics of temperature
25
variation in China during the last two millennia, Geophys. Res. Lett., 29, 381–384, 2002. Yang, S., and Lau, K.-M.: Interannual variability of the Asian monsoon, in: the Asian monsoon,
edited by: Wang, B., Springer-Verlag, Berlin, 259–293, 2006.
Yoshimori, M., Raible, C. C., Stocker, T. F., and Renold, M.: On the interpretation of low-latitude hydrological proxy records based on Maunder Minimum AOGCM simulations, Clim. Dynam.,
30
27, 493–513, 2006.
Zhang, D., Li, X., and Liang, Y.: Supplement of Yearly Charts of Dryness/wetness in China for the Last 500-year Period, 1993–2000, Journal of Applied Meteorological Science, 14,
CPD
4, 611–643, 2008
Variability of summer precipitation
over eastern China C. Shen et al. Title Page Abstract Introduction Conclusions References Tables Figures ◭ ◮ ◭ ◮ Back Close
Full Screen / Esc
Printer-friendly Version Interactive Discussion 379–389, 2003.
Zhang, Y., Wallace, J. M., and Battisti, D. S.: ENSO-like interdecadal variability: 1900–93, J. Climate, 10, 1004–1020, 1997.
Zhao, S., Peng, C., Jiang, H., Tian, D., Lei, X., and Zhou, X.: Land use change in Asia and the ecological consequences, Ecol. Res., 21, 890–896, 2006.
5
Zheng, J., Wang, W.-C., Ge, Q., Man, Z., and Zhang, P.: Precipitation variability and extreme events in eastern China during the past 1500 years, Terr. Atmos. Ocean. Sci., 17, 579–592, 2006.
Zhou, W., Li, C., and Chan, J. C. L.: The interdecadal variations of the summer monsoon rainfall over South China, Meteorol. Atmos. Phys., 93, 165–175, 2006.
10
Zhu, W. and Wang, S.: 80 yr oscillation of summer rainfall over North China and East Asia summer monsoon, Geophys. Res. Lett., 29, 1672, doi:10.1029/2001GL013997, 2002.
CPD
4, 611–643, 2008
Variability of summer precipitation
over eastern China C. Shen et al. Title Page Abstract Introduction Conclusions References Tables Figures ◭ ◮ ◭ ◮ Back Close
Full Screen / Esc
Printer-friendly Version Interactive Discussion
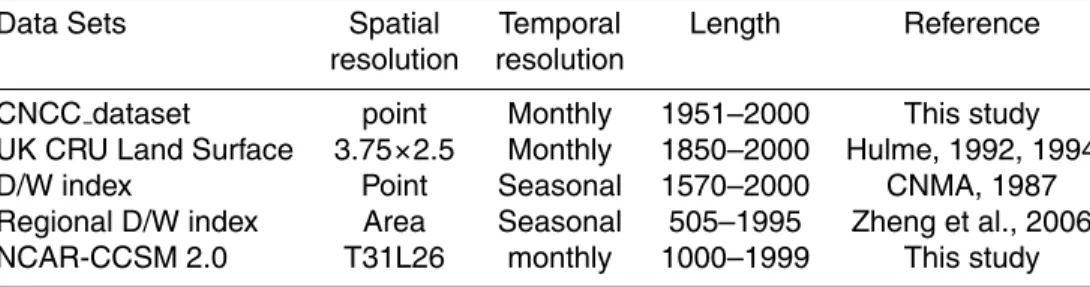
Table 1. Observed, modeled, and proxy data of summer precipitation over eastern China.
Data Sets Spatial Temporal Length Reference
resolution resolution
CNCC dataset point Monthly 1951–2000 This study
UK CRU Land Surface 3.75×2.5 Monthly 1850–2000 Hulme, 1992, 1994
D/W index Point Seasonal 1570–2000 CNMA, 1987
Regional D/W index Area Seasonal 505–1995 Zheng et al., 2006
CPD
4, 611–643, 2008
Variability of summer precipitation
over eastern China C. Shen et al. Title Page Abstract Introduction Conclusions References Tables Figures ◭ ◮ ◭ ◮ Back Close
Full Screen / Esc
Printer-friendly Version Interactive Discussion PC2 PC1 115°E 115°E 120°E 120°E 125°E 125°E 25°N N 30°N N 35°N N Legend Stations Rivers -0.19 - -0.14 -0.14 - -0.10 -0.10 - -0.05 -0.05 - -0.00 -0.00- 0.04 0.04 - 0.09 0.09 - 0.14 0.14 - 0.184 0.18 - 0.23 300 km Yangtze Riverr Yellow River PC1 115°E 115°E 120°E 120°E 125°E 125°E 25°N 30°N 35°N Legend Stations Rivers -0.22 - -0.18 -0.18 - -0.13 -0.13- -0.09 -0.09 - -0.05 -0.05 - -0.00 -0.00 - 0.04 0.04 - 0.08 0.08- 0.13 0.13 - 0.17 290 km Pearl River PC2 North China MLYRV SEC Be iji n g T ia n jin Sh iji a zh u a n g T a iyu a n D e zh o u Ji n a n C h a n g zh i An ya n g L in fe n g H e ze L in yi Z h e n g zh o u Xu zh o u N a n ya n g Be n g b u F u ya n g Xi n ya n g N a n jin g H e if e i Sh a n g h a i Y ich a n g W u h a n An q in g H a n g zh o u N in g b o Ji u jia n g T u n xi N a n ch a n g C h a n g sh a W e n zh o u Ji a n F u zh o u Y o n g a n G a n zh o u C h e n zh o u G u lin Z h a n g zh o u W u zh o u Sh a n g to u G u a n g zh o u (15.2%) (19.4%) Yellow River Yangtze River Pearl River 0.3 0.2 0.1 0 -0.1 -0.2 -0.3 0.3 0.2 0.1 0 -0.1 -0.2 -0.3 PC L o a d in g
Fig. 1. Result of PCA on the observed data from 1951 to 2000 consisting of 37 stations over
CPD
4, 611–643, 2008
Variability of summer precipitation
over eastern China C. Shen et al. Title Page Abstract Introduction Conclusions References Tables Figures ◭ ◮ ◭ ◮ Back Close
Full Screen / Esc
Printer-friendly Version Interactive Discussion 1900 1920 1940 1960 1980 2000 Year (AD) AD 120 160 200 240 (mm) -2 0 2 4 MLYRV -4 -2 0 2 4 40 60 80 100 120 (mm) NC a b 0 0.1 0.2 0.3 0.4 0.5 Frequency (1/yr) 0 1 2 3 NTM Power 0 1 2 3 MTM Power MLYRV NC c 50% confidence level 90% confidence level 95% confidence level Observed
Decadal-centennial band (10-100-yr) (19.4%)- r
Observed
Decadal-centennial band (10-100-yr) (18.3%)
2-yr 5-yr 7-yr 26-27-yr- -3-yr 5-yr 7-yr
Fig. 2. (a) Observed summer precipitation in the MLYRV and its Wavelet filtered (Tpass
=10–100-yr, paul basis) time series. (b) Observed summer precipitation in NC and its Wavelet filtered (Tpass=10–100-yr, paul basis) time series. (c) MTM results of the MLYRV and NC summer
precipitation time series. Resolution and taper number used in the MTM analysis are 2 and 3, respectively.
CPD
4, 611–643, 2008
Variability of summer precipitation
over eastern China C. Shen et al. Title Page Abstract Introduction Conclusions References Tables Figures ◭ ◮ ◭ ◮ Back Close
Full Screen / Esc
Printer-friendly Version Interactive Discussion -4 -2 0 2 4 -4 -2 0 2 4 -1 0 1 -1 0 1 -1 0
1 centennial band (65-170-yr)
bidecadal band (15-35-yr)
pentadecadal band (40-60-yr)
MLYRV NC (a) (b) (c) (d) (e) MLYRV (36.3%) NC (39.1%) 500 600 700 800 900 1000 1100 1200 1300 1400 1500 1600 1700 1800 1900 2000 Year (AD) -1 0 1
Reconstructed temperature for whole China (f)
MLYRV (17.8%) NC (17.4%)
MLYRV (21.3%) NC (24.0%)
Fig. 3. The normalized time series of 10-yr moving averages of DWI for the MLYRV (a) and NC
(b). Wavelet filtered DWI time series for the MLYRV and NC in bidecadal band (Tpass
=15–35-yr, paul basis) (c), pentadecadal band (Tpass=40–60-yr, paul basis) (d), and centennial band
(Tpass=65–170-yr, paul basis). A curve of reconstructed temperature for whole China (Yang et
al., 2004) is also shown for a comparison of summer precipitation variability over eastern China with temperature variation in China.
CPD
4, 611–643, 2008
Variability of summer precipitation
over eastern China C. Shen et al. Title Page Abstract Introduction Conclusions References Tables Figures ◭ ◮ ◭ ◮ Back Close
Full Screen / Esc
Printer-friendly Version Interactive Discussion 0.01 0.1 1 10 100 0 0.01 0.02 0.03 0.04 0.05 0.06 0.07 0.08 0.09 0.1 Freque nc y (1/yr) 0.01 0.1 1 10 100 120-170 43-52 36-39 NC MLYRV 30-33 26-28 21-2318-19 15-17 13 86-130 68-76 43-48 31-35 -20-29 -17-19 Centennial band (65-170-yr) Pentadecadal band
(40-60-yr) Bidecadal band
(15-35-yr) 100-110 NTM Power NTM Power 50% confidence level 90% confidence level 95% confidence level
Fig. 4. MTM results of the MLYRV and NC DWI time series. Resolution and taper number used
CPD
4, 611–643, 2008
Variability of summer precipitation
over eastern China C. Shen et al. Title Page Abstract Introduction Conclusions References Tables Figures ◭ ◮ ◭ ◮ Back Close
Full Screen / Esc
Printer-friendly Version Interactive Discussion 90 100 110 120 130 10 20 30 40 50 90 100 110 120 130 10 20 30 40 50 90 100 110 120 130 10 20 30 40 50 Observed NCAR_CCSM2.0 (ctr) NCAR_CCSM2.0 (full forcing) (a) (b) (d) 90 100 110 120 130 10 20 30 40 50 NCAR_CCSM2.0 (solar forcing) NC MLYRV NC MLYRV NC MLYRV NC MLYRV (c)
Fig. 5. Spatial patterns of summer precipitation (unit: mm/month) in observed data (a), and
modeled data of three experiments, i.e. control run (b), orbital and solar forcing driven run (c), and full forcing driven run (d). All data are 45-yr averages of 1951–1995.
CPD
4, 611–643, 2008
Variability of summer precipitation
over eastern China C. Shen et al. Title Page Abstract Introduction Conclusions References Tables Figures ◭ ◮ ◭ ◮ Back Close
Full Screen / Esc
Printer-friendly Version Interactive Discussion
Observed Full forcing Solar forcing Control run
m=154.3 s=20.2 MLYRV NC m=80.5 s=10.7 m=154.1 s=13.4 m=114.6 s=17.5 m=113.1s=15.8 m=117.0 s=15.0 m=154.6 s=15.4 m=153.6 s=14.7 Boxplot 200 100 0 mm/month
Fig. 6. Boxplots summarizing the distribution statistics of observed and modeled summer
pre-cipitation (May–September) from 1951 to 1995. In each boxplot the box extends from the lower (first) to the upper (third) quartile, with the line inside the box denoting the median. Lines indi-cating the tails extend outward from the quartiles to the minimum/maximum value. The mean values and standard deviations are also shown.
CPD
4, 611–643, 2008
Variability of summer precipitation
over eastern China C. Shen et al. Title Page Abstract Introduction Conclusions References Tables Figures ◭ ◮ ◭ ◮ Back Close
Full Screen / Esc
Printer-friendly Version Interactive Discussion 1000 1100 1200 1300 1400 1500 1600 1700 1800 1900 2000 Year (AD) 3.5 4.0 mm/day -2 -1 0 1 2 4.5 5.0 5.5 mm/day 4.5 5.0 5.5 mm/day 4.5 5.0 5.5 mm/day MLYRV -2 -1 0 1 2 DWI 3.5 4.0 mm/day 3.5 4.0 mm/day Proxy Control run Solar forcing Full forcing Control run Full forcingg Solar forcing Proxy NC DWI
Fig. 7. A comparison of summer precipitation from proxy data and modeled data in the MLYRV
and NC. All data are 10-yr moving averages. The dot lines represent the period boundaries recognized by temporal evolutions of decadal to centennial oscillations in Sect. 3.2.
CPD
4, 611–643, 2008
Variability of summer precipitation
over eastern China C. Shen et al. Title Page Abstract Introduction Conclusions References Tables Figures ◭ ◮ ◭ ◮ Back Close
Full Screen / Esc
Printer-friendly Version Interactive Discussion 0 0.01 0.02 0.03 0.04 0.05 0.06 0.07 0.08 0.09 0.1 Frequency (1/yr) 0.001 0.01 0.1 1 10 0.001 0.01 0.1 1 10 0.001 0.01 0.1 1 10 0.001 0.01 0.1 1 10 0.001 0.01 0.1 1 10 0.001 0.01 0.1 1 10 40-60 40-65 27-37 NC 29-33 21-25 19-24 25-29 30 105-170 22 16-17 170-260 27-35 68-90 37-41 15-18 52-80 17 NC NC MLYRV MLYRV MLYRV 31-37 22-25 17-21 2923-27 19-21 -control run
run with orbital plus solar forcing run with full forcing
MTM Power
MTM Power
MTM Power
MTM Power
MTM Power
MTM Power 50% confidence level 90% confidence level 95% confidence level
Fig. 8. MTM results of summer precipitation in three experiments of millennium simulation.
CPD
4, 611–643, 2008
Variability of summer precipitation
over eastern China C. Shen et al. Title Page Abstract Introduction Conclusions References Tables Figures ◭ ◮ ◭ ◮ Back Close
Full Screen / Esc
Printer-friendly Version Interactive Discussion 1.0 0.8 0.6 0.4 0.2 0.0 1.0 0.8 0.6 0.4 0.2 0.0 Pro b a b ili ty Pro b a b ili ty CD CF Normal DNFS FNDS CD CF DNFS FNDS
occurrence probability of spatial patterns in modeled data ocurrence probability
during the last two decades (1980-1999) extreme values mean
Normal
occurrence probability of spatial patterns in proxy data -3 -2 -1 0 1 2 3 MLYRV -3 -2 -1 0 1 2 3 NC coherent flood coherent drought drought-in-north flood-in-south -3 -2 -1 0 1 2 3 -3 -2 -1 0 1 2 3 NC ocurrence probability during the last two decades (1980-1999) extreme values mean flood-in-north drought-in-south coherent flood coherent drought drought-in-north flood-in-south flood-in-north drought-in-south MLYRV (a) (c) (b) (d)
Fig. 9. Four-quarter plots of standardized proxy data (DWI) (a) and modeled data (experiment
with full forcing) (b) of summer precipitation during AD 1470–1999 over the MLYRV and NC showing the spatial pattern of anomalous summer precipitation events. The last 30 yr (1970– 1999) are presented by red dots. The proxy and modeled data are standardized using their means and standard deviations of 1951–1995. Boxplots show the probability distributions of different spatial patterns of anomalous summer precipitation events revealed by proxy (c) and modeled (d) data. The shaded box around the median represents the inner quartile range (IQR), which identifies the region between the 25th and 75th percentiles. The whiskers extend-ing from the IQR represent the largest/smallest value that is still within the median ±1.5(IQR). Any value beyond the whiskers is subjectively considered to be an extreme value or an outlier.


![[PDF] Android apprendre à développer des applications mobile cours PDF - Free PDF Download](data:image/gif;base64,R0lGODlhAQABAIAAAP///wAAACH5BAEAAAAALAAAAAABAAEAAAICRAEAOw==)