HAL Id: insu-03041888
https://hal-insu.archives-ouvertes.fr/insu-03041888
Submitted on 2 Feb 2021
HAL is a multi-disciplinary open access
archive for the deposit and dissemination of
sci-entific research documents, whether they are
pub-lished or not. The documents may come from
teaching and research institutions in France or
abroad, or from public or private research centers.
L’archive ouverte pluridisciplinaire HAL, est
destinée au dépôt et à la diffusion de documents
scientifiques de niveau recherche, publiés ou non,
émanant des établissements d’enseignement et de
recherche français ou étrangers, des laboratoires
publics ou privés.
Comparison of ozone profiles from ground-based lidar,
electrochemical concentration cell balloon sonde,
ROCOZ-A rocket ozonesonde, and Stratospheric Aerosol
and Gas Experiment satellite measurements
I. Mcdermid, Sophie Godin, R. Barnes, C. Parsons, A. Torres, M. Mccormick,
W. Chu, P. Wang, J. Butler, P. Newman, et al.
To cite this version:
I. Mcdermid, Sophie Godin, R. Barnes, C. Parsons, A. Torres, et al.. Comparison of ozone
pro-files from ground-based lidar, electrochemical concentration cell balloon sonde, ROCOZ-A rocket
ozonesonde, and Stratospheric Aerosol and Gas Experiment satellite measurements.
Journal of
Geophysical Research: Atmospheres, American Geophysical Union, 1990, 95 (D7), pp.10037-10042.
�10.1029/JD095iD07p10037�. �insu-03041888�
JOURNAL OF GEOPHYSICAL RESEARCH, VOL. 95, NO. D7, PAGES 10,037-10,042, JUNE 20, 1990
Comparison of Ozone Profiles From Ground-Based Lidar, Electrochemical
Concentration Cell Balloon Sonde, ROCOZ-A Rocket Ozonesonde,
and Stratospheric Aerosol and Gas Experiment
Satellite
Measurements
I. S. MCDERMID, 1 S. M. GODIN, 1 R. A. BARNES, 2 C. L. PARSONS, 3 A. TORRES, 3 M.P. MCCORMICK, 4 W. P. CHU, 4 P. WANG, 5 J. BUTLER, 6 P. NEWMAN, 7
J. BURRIS, 7 R. FERRARE, 7 D. WHITEMAN, 7 AND T. J. MCGEE 7
A series of coordinated atmospheric ozone profile measurements was made during October and November 1988. The instruments making observations and their locations were as follows. The Jet Propulsion Laboratory (JPL) and Goddard Space Flight Center differential absorption lidar systems were located at the JPL-Table Mountain Facility 34.4øN, 117.7øW. The electrochemical concentration cell balloon sondes and the rocket ozonesondes were both launched from Point Mugu Naval Air Station at 34.2øN, 119.2øW. Stratospheric Aerosol and Gas Experiment (SAGE II) satellite measure- ments were at various latitudes and longitudes but only measurements made within 1000 km of both of the above sites were considered for this intercomparison study. It was found that at least for the time of year of the study, SAGE II measurements agreed only when they were made much closer than 1000 km (<500 km) from the other sites, and this is explained in terms of the large latitudinal gradient observed in the ozone concentration profile. Agreement to 5% was seen between the instruments, over the altitude range from 20 to 50 km, when the measurements were made close together in both time and
space.
INTRODUCTION
It is now unquestionably recognized that the stratospheric ozone layer must be preserved in order to protect the Earth' s ecosystems from damage caused by increased levels of ultraviolet radiation. The threat posed to the stability of the ozone layer by the continued production and release of a number of chemical species, in particular the chlorine- and bromine-containing halocarbons (CFCs and halons), is also recognized (see, for example, Watson et al. [1988], World Meteorological Organization (WMO) [1989]). Following a mandate from the United States Congress, the National Aeronautics and Space Administration (NASA) has imple- mented a long-term Upper Atmospheric Research Program (UARP) whose goal is to develop a comprehensive under- standing of upper atmospheric processes. As part of this program, NASA has developed a number of instruments to measure stratospheric ozone concentrations and is presently concerned with the establishment, with international collab- oration, of a series of ground-based stations to provide long-term measurements of a number of key chemical spe- cies and atmospheric parameters. A measurement of high priority for this Network for the Detection of Stratospheric
1Jet
Propulsion
Laboratory,
Table Mountain
Facility,
California
Institute of Technology, Wrightwood.2Chemal,
Incorporated,
Wallops
Island,
Virginia.
3Wallops
Flight Facility Operations,
NASA Goddard
Space
Flilght Center, Wallops Island, Virginia."tmospheric Sciences Division, NASA Langley Research Cen- ter, Hampton, Virginia.
5Science
and Technology
Corporation,
Hampton,
Virginia.
6S. T. Systems
Incorporated,
Lanham,
Maryland.
7Laboratory
for Atmospheres,
NASA Goddard
Space Flight
Center, Greenbelt, Maryland.Copyright 1990 by the American Geophysical Union. Paper number 89JD03774.
0148-0227/90/89JD-03774505.00
Change (NDSC) is the vertical distribution of ozone [UARP,
1986].
This study describes an intercomparison of a number of instruments capable of measuring stratospheric ozone con- centrations. One of the goals of this intercomparison is to validate the lidar technique and systems for their proposed role in NDSC. In order for long-term network measurements to be successful it will be necessary to ensure the quality of the results it provides by rigorous calibration procedures and intercomparisons. This paper presents one phase of a series of intercomparison tests of strat0spheric ozone-measuring
instruments.
EXPERIMENTAL PROCEDURE
The instruments taking part in this intercomparison have all been fully described elsewhere, and only the basis of the technique employed is described here. The Jet Propulsion Laboratory (JPL) and Goddard Space Flight Center (GSFC) lidars are ultraviolet differential absorption lidar systems (UV-DIAL) and are very similar in most respects [McDer- mid, 1987; McDermid and Godin, 1989; McDermid et al., 1990; McGee et al., 1989]. They are dual wavelength sys- tems using 308 nm as the probe wavelength and 353 nm (JPL) and 355 nm (GSFC) as the reference. The JPL lidar is a permanent, fixed facility, and the GSFC system is incorpo- rated into two trailers which allow it to be transported to other locations. A major use for this system will be to check the operation and provide a transfer standard within NDSC.
The ROCOZ-A rocket ozonesonde is a four-filter sequen- tial-sampling ultraviolet radiometer [Holland et al., 1985; Barnes et al., 1986, 1989]. The instrument is launched by a Super-Loki booster rocket to an apogee of 70-80 km, where the payload is ejected and parachutes back to the ground.
The radiometer measures the solar UV irradiance over its
filter wavelengths as it descends through the atmosphere. The amount of ozone in the path between the radiometer and
10,038 MCDERMID ET AL..' COMPARISON OF OZONE PROFILE MEASUREMENTS
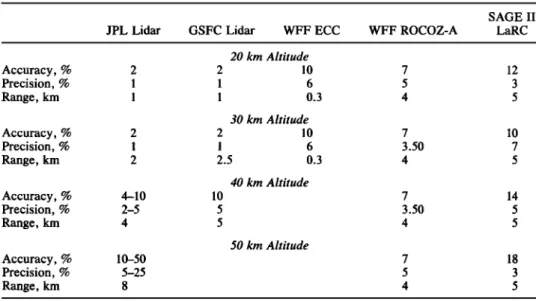
TABLE 1. Accuracy, Precision, and Altitude Resolution of the Instruments Used in This Comparison
SAGE II JPL Lidar GSFC Lidar WFF ECC WFF ROCOZ-A LaRC
20 km Altitude Accuracy, % 2 2 10 7 12 Precision, % 1 1 6 5 3 Range, km 1 1 0.3 4 5 30 km Altitude Accuracy, % 2 2 10 7 10 Precision, % 1 1 6 3.50 7 Range, km 2 2.5 0.3 4 5 40 km Altitude Accuracy, % 4-10 10 7 14 Precision, % 2-5 5 3.50 5 Range, km 4 5 4 5 50 km Altitude Accuracy, % 10-50 7 18 Precision, % 5-25 5 3 Range, km 8 4 5
the Sun is then calculated from the attenuation of the solar
flux. Radar is used to track and measure the height of the instrument throughout its descent.
The electrochemical concentration cell (ECC) is a small, balloon-borne sensor and was developed at NOAA [Komhyr and Harris, 1971] to measure vertical profiles of ozone. The
sensor is based on an iodine-iodide redox concentration cell
which generates an electric current when air containing ozone is pumped through it. Each individual ECC sensor is calibrated in the laboratory prior to deployment [Barnes et al., 1985].
The Stratospheric Aerosol and Gas Experiment (SAGE II) instrument is a seven-channel, limb-scanning, sun photom- eter using the solar occultation technique. It was launched onboard the Earth radiation budget satellite (ERBS) in October 1984. The error budget of the SAGE II instrument has been considered in depth and ozone profile measure- ments have been validated through correlative measure-
ments with coincident ROCOZ-A and ECC sonde measure-
ments [Cunnold et al., 1988, 1989].
An interesting feature of this group of instruments is that with the exception of the ECC sonde, they all measure ozone number density as a function of absolute altitude. This provides the opportunity for direct comparison of ozone profiles without the uncertainty introduced when the mea- surements have to be converted to, or from, pressure units. It was necessary to make this conversion for the ECC data but, since the balloon package also includes temperature and pressure measurements, the error is minimized by having temperature and pressure profiles that were measured simul- taneously in time and space. The accuracies and precisions
of the ozone measurements from the different instruments
are summarized in Table 1.
The two lidar systems were located at the JPL Table Mountain Facility (TMF) (34.4øN, 117.7øW). These systems operated only at night, and since the laser light from the two experiments was found to interfere, they were operated sequentially. The ECC balloon sondes and the ROCOZ-A rocket sondes were both launched from Point Mugu Naval Air Station (34.2øN, 119.2øW). These sensors were launched sequentially and typically in the morning and early after-
noon. SAGE II satellite measurements were at various
latitudes and longitudes, but only measurements made within 1000 km of both TMF and Point Mugu were consid- ered in this intercomparison. The SAGE II measurements were either at sunrise or sunset. Figure 1 is a map which shows the locations of TMF and Point Mugu and also the tangent positions for the SAGE II measurements on the dates indicated on the figure. The dates on which measure- ments were made by each of the instruments are shown in
Table 2. Three dates have been selected for this detailed
intercomparison as are indicated in Table 2. These dates represent the only occasions when an ozone measurement was made by each of the techniques (even though there was no GSFC measurement on the night of October 31- November 1, the lidar technique was represented by the JPL system). •' 35 • 3o 20 -135 -130 -125 -120 -115 -110 -105 -100 LONGITUDE (W)
Fig. 1. This map, showing the region of the SW coast of the United States and the NW coast of Mexico, indicates the relative locations of the measurements. The lidars were operated at Table
Mountain (TMF) and the ECC sondes and ROCOZ-A sondes were
launched from Point Mugu, which is 135 km from TMF. The tangent points of the SAGE II measurements are indicated by the asterisks and labeled with the date (PST).
MCDERMID ET AL.: COMPARISON OF OZONE PROFILE MEASUREMENTS 10,039
TABLE 2. Pacific Standard Time Date on Which Each of the Instruments Made Ozone Profile Measurements Date in JPL GSFC
1988 Lidar Lidar ECC ROCOZ-A SAGE II
Oct. 25-26 ß ß ß Oct. 26-27 ß ß ß Oct. 27-28 ß ß Oct. 28-29 ß Oct. 29-30 ß ß Oct. 30-31 ß ß Nov. 31-01 ß ß Nov. 01-02 ß ß ß Nov. 02-03 ß Nov. 03-04 ß ß ß Nov. 04--05 ß ß Nov. 05-06 ß ß ß Nov. 06-07 ß ß Nov. 07-08 ß ß ß Nov. 08-09 ß ß ß Nov. 09-10 ß Nov. 10-11 ß ß Nov. 11-12 ß ß RESULTS October 31
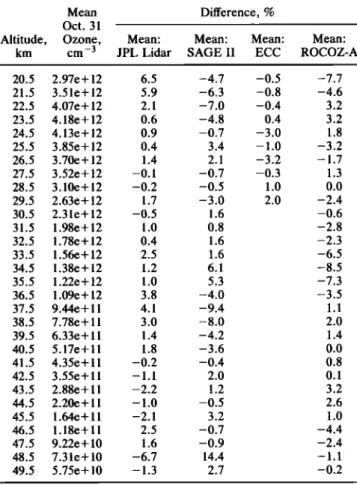
The SAGE II measurement on this date was at 34.5øN, 114.9øW and was made at sunrise, 0602 Pacific standard time (PST) (1402 UT). The offset from TMF was 253 km almost directly east. The ECC was launched from Point Mugu at 0900 PST (1700 UT), and the ROCOZ-A was launched at 1217 PST (2017 UT). There were two measurements made by the JPL lidar, one before dawn at 0100 PST (0900 UT), and one after sunset at 2220 PST 0620 UT, November 1). To provide a single profile for this date, the two lidar profiles were averaged. Figure 2 shows the ozone concentration profiles from the four different instruments. Since the pro- files agree well, it is difficult to discern the differences from this plot. In order to see the magnitude of the differences, each profile was first interpolated, using a cubic spline routine, to provide data points at the standard SAGE II altitudes, i.e., from 20.5 to 49.5 km in 1-km steps. A mean
TABLE 3. Comparison of Each of the Individual Profile
Measurements Made on November 1, 1988, With the
Average of All Measurements, Excluding That
From SAGE II
Mean Difference, %
Oct. 31
Altitude, Ozone, Mean: Mean: Mean: Mean: km cm -3 JPL Lidar SAGE II ECC ROCOZ-A
20.5 2.97e+ 12 6.5 -4.7 -0.5 -7.7 21.5 3.51e+ 12 5.9 -6.3 -0.8 -4.6 22.5 4.07e+ 12 2.1 -7.0 -0.4 3.2 23.5 4.18e+ 12 0.6 -4.8 0.4 3.2 24.5 4.13e+ 12 0.9 -0.7 -3.0 1.8 25.5 3.85e+ 12 0.4 3.4 - 1.0 -3.2 26.5 3.70e+ 12 1.4 2.1 -3.2 -1.7 27.5 3.52e+ 12 -0.1 -0.7 -0.3 1.3 28.5 3.10e+ 12 -0.2 -0.5 1.0 0.0 29.5 2.63e+ 12 1.7 -3.0 2.0 -2.4 30.5 2.31e+ 12 -0.5 1.6 -0.6 31.5 1.98e+ 12 1.0 0.8 -2.8 32.5 1.78e+ 12 0.4 1.6 -2.3 33.5 1.56e+ 12 2.5 1.6 -6.5 34.5 1.38e+ 12 1.2 6.1 -8.5 35.5 1.22e+ 12 1.0 5.3 -7.3 36.5 1.09e+ 12 3.8 -4.0 -3.5 37.5 9.44e+ 11 4.1 -9.4 1.1 38.5 7.78e+ 11 3.0 -8.0 2.0 39.5 6.33e+ 11 1.4 -4.2 1.4 40.5 5.17e+ 11 1.8 -3.6 0.0 41.5 4.35e+ 11 -0.2 -0.4 0.8 42.5 3.55e+ 11 -1.1 2.0 0.1 43.5 2.88e+ 11 -2.2 1.2 3.2 44.5 2.20e+ 11 - 1.0 -0.5 2.6 45.5 1.64e+ 11 -2.1 3.2 1.0 46.5 1.18e+ 11 2.5 -0.7 -4.4 47.5 9.22e+ 10 1.6 -0.9 -2.4 48.5 7.31e+ 10 -6.7 14,4 -1.1 49.5 5.75e+ 10 - 1.3 2.7 -0.2 Read 2.97e+ 12 as 2.97 x 10¹².
profile was computed from all of the measurements, and the percentage difference of each individual measurement from the mean profile was than calculated. These results are given
in Table 3. -- LIDAR JPL o SAGE II x ROCOZ-A ß .-ECC 20 a
O.OE+00 1.0E+ 12 2.0E+12 3.0E+12 4.0E+12 5.0E+ 12
OZONE
NUMBER
DENSITY
(cm
-3)
Fig. 2. Ozone profiles measured on October 31, 1988, by the
instruments indicated in the legend. A numerical comparison of these profiles is given in Table 3.
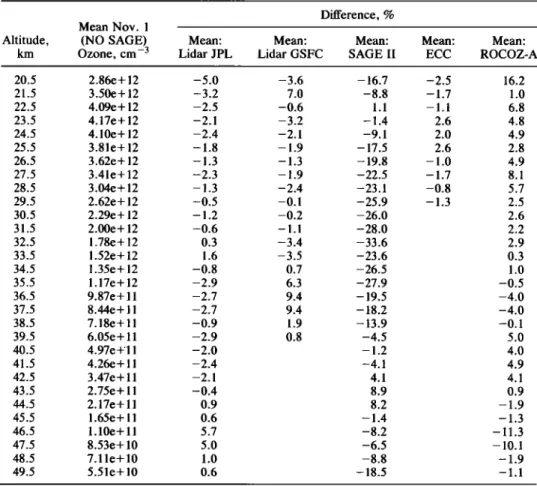
November 1
SAGE II made a sunrise (0614 PST, or 1414 UT) measure- ment at 29.6øN, 119.6øW which is offset 562 km from TMF. At Point Mugu the ECC sonde was launched at 0903 PST (1703 UT), and the ROCOZ-A sonde was launched at 1225 PST (2025 UT). The GSFC lidar made the first measurement after sunset at a mean time of 2130 PST (0530 UT, November 2). For the JPL lidar there were measurements made after sunset of the previous day (2220 PST, October 31, or 0620 UT, November 1) and before dawn on the following day (0130 PST (0930 UT), November 2). As for October 31, these two JPL profiles were averaged to provide a mean profile for November 1. Figure 3 shows the profiles from the five different instruments. In this figure it is clear that the SAGE II measurement does not agree with the others. To deter- mine the differences between the measurements, the same procedure was carried out as for October 31 except that the SAGE II data were omitted when calculating the mean ozone profile. The results are given in Table 4.
10,040 MCDERMID ET AL.' COMPARISON OF OZONE PROFILE MEASUREMENTS 20 0.0E+00 I
"- 0 0
0 ß 1.0E+ 12 -- LIDAR JPL --- LIDAR GSFC o SAGE I I x ROCOZ-A ß -. ECC oo
o
x o x . o X-.. ß X2.0E+ 12 3.0E+ 12 4.0E+ 12
OZONE
NUMBER
DENSITY
(cm
-3)
5.0E+12
Fig. 3. Ozone profiles measured on November 1, 1988, by the instruments indicated in the legend. The disparity with the SAGE II measurement is due to the latitudinal ozone gradient illustrated in Figure 5.
45
i
--
LIDAR
JPL
•
---
LIDAR
GSFC
.
o SAGE
II
'l•.
x ROCOZ-A
' x..•:.•X..x
...
2•
-'..•.•x.•<.
•.•.
...
.>k.x o20
,
ß
. (,.oo•,.,-•
'• 0
O.00E+00 1.00E+ 12 2.00E+ 12 3.00E+ 12 4.00E+ 12 5.00E+ 12
OZONE
NUMBER
DENSITY
(cm
-3)
Fig. 4. Ozone profiles measured on November 5, 1988, by the full set of instruments. Note the large variations in the lower stratosphere.
November 5
For this date the ECC sonde was launched at 1056 PST
(1856 UT) and the ROCOZ-A was launched at 1437 PST (2237 UT). The SAGE II measurement was made at sunset 1613 PST (0013 UT, November 6), at 35.1øN, 108.9øW, which is 810 km from TMF. On this day the JPL lidar
operated first after sunset with a mean measurement time of 1900 PST (0300 UT, November 6) and was followed by the GSFC lidar at a mean time of 2300 PST (0700 UT, November 6). The profiles are shown in Figure 4. Since there were considerable differences in the profiles for this date it was felt inappropriate to consider daily means, as for the two
dates considered above.
TABLE 4. Comparison of Individual Measurements Made on November 1, 1988, to the Average of All Measurements, Excluding That From SAGE II
Difference, %
Mean Nov. 1
Altitude, (NO SAGE) Mean: Mean: Mean: Mean: Mean:
km Ozone, cm -3 Lidar JPL Lidar GSFC SAGE II ECC ROCOZ-A 20.5 2.86e+ 12 -5.0 -3.6 - 16.7 -2.5 16.2 21.5 3.50e+ 12 -3.2 7.0 -8.8 - 1.7 1.0 22.5 4.09e+ 12 -2.5 -0.6 1.1 - 1.1 6.8 23.5 4.17e+ 12 -2.1 -3.2 -1.4 2.6 4.8 24.5 4.10e+ 12 -2.4 -2.1 -9.1 2.0 4.9 25.5 3.81e+ 12 - 1.8 - 1.9 - 17.5 2.6 2.8 26.5 3.62e+ 12 - 1.3 - 1.3 - 19.8 - 1.0 4.9 27.5 3.41e+ 12 -2.3 -1.9 -22.5 -1.7 8.1 28.5 3.04e+ 12 - 1.3 -2.4 -23.1 -0.8 5.7 29.5 2.62e+ 12 -0.5 -0.1 -25.9 - 1.3 2.5 30.5 2.29e+ 12 - 1.2 -0.2 -26.0 2.6 31.5 2.00e+ 12 -0.6 - 1.1 -28.0 2.2 32.5 1.78e+ 12 0.3 -3.4 -33.6 2.9 33.5 1.52e+ 12 1.6 -3.5 -23.6 0.3 34.5 1.35e+ 12 -0.8 0.7 -26.5 1.0 35.5 1.17e+ 12 -2.9 6.3 -27.9 -0.5 36.5 9.87e+ 11 -2.7 9.4 - 19.5 -4.0 37.5 8.44e+ 11 -2.7 9.4 -18.2 -4.0 38.5 7.18e+ 11 -0.9 1.9 -13.9 -0.1 39.5 6.05e + 11 -2.9 0.8 -4.5 5.0 40.5 4.97e+ 11 -2.0 - 1.2 4.0 41.5 4.26e+ 11 -2.4 -4.1 4.9 42.5 3.47e+11 -2.1 4.1 4.1 43.5 2.75e+ 11 -0.4 8.9 0.9 44.5 2.17e + 11 0.9 8.2 - 1.9 45.5 1.65e+ 11 0.6 - 1.4 - 1.3 46.5 1.10e+ 11 5.7 -8.2 - 11.3 47.5 8.53e+ 10 5.0 -6.5 -10.1 48.5 7.11e+ 10 1.0 -8.8 - 1.9 49.5 5.51e+ 10 0.6 - 18.5 - 1.1 Read 2.86e+ 12 as 2.86 x 10¹².
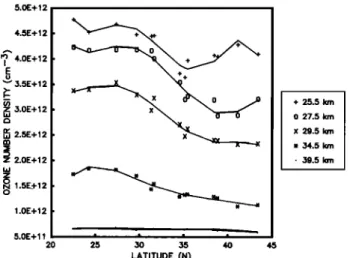
MCDERMID ET AL.' COMPARISON OF OZONE PROFILE MEASUREMENTS 10,041 5.0E+ 12 4.5E+ 12 • 4.0E+12 "• 3.5E+12 z 3.0E+12 w 2.5E+12 z 2.0E+12 z o (• 1.5E-t- 12 1.0E+12 5.0E+11 •
20
;5
;0
35
4•3
4.5
LATITUDE (N) 25.5 km 27.5 km 29.5 km 34.5 km 39.5 kmFig. 5. Ozone number density as a function of latitude for various fixed altitudes as indicated in the legend. These data were
obtained from all of the SAGE II measurement locations shown in
Figure 1.
DISCUSSION
The ozone profiles measured on October 31 by the lidar, ECC, ROCOZ-A, and SAGE II show agreement, for the most part, to better than 5% over the entire altitude range from 20 to 50 km, as is shown in Table 3. This date represents the closest approach of the SAGE II satellite instrument, and the best agreement would be expected for this date. For the following day, November 1 (Table 4), the instruments again show agreement to approximately the 5% level but with the exception of the SAGE II measurement, and for November 5 there is substantial disagreement be- tween the measurements below approximately 35 km.
The differences in the ozone profile retrieved by the SAGE II instrument can readily be explained in terms of the latitude of the measurement. In Figure 5 the SAGE II measurements made from October 30 through November 9 have been plotted, for various fixed altitudes, as a function of latitude. For altitudes between 25 and 35 km there is clearly a very steep gradient in the ozone concentration. This gradient is at a maximum between --•30 ø and --•35øN with a magnitude of the order of 4-5% change in the ozone concentration per degree of latitude. Thus for SAGE II measurements made even only a small distance to the north or south of TMF, agreement with the lidar, ECC, and ROCOZ-A profiles should not be expected, at least for altitudes below --•40 km. This ozone gradient seems to disappear above 40 km, and all of the profiles are expected to agree between 40 and 50 km. As can be seen in Figures 2-4, this is the case.
On November 5 there appears to be some geophysical, atmospheric disturbance occurring below 30 km, since there is virtually no agreement between any of the instruments in this region, although the two lidars agree well above 28 km. The available meteorological information for this period has been examined in an attempt to explain these observations. The National Meteorological Center (NMC) data for the days between November 4 and 6 do not show any indication that this is a result of horizontal motion, but the changes observed appear to have occurred on a much faster time
scale than can be resolved from the NMC data. The ECC
and ROCOZ-A sondes made temperature profile measure- ments approximately 3.5 hours apart which show that there
may have been a stratospheric cooling in the 25-km region. This could be an indication of vertical upwelling as air parcels adiabatically rise and cool. This is consistent with the observations, since a vertical upwelling would uplift air with a relatively lower ozone density. Since the time scale and resolution of the NMC data are insufficient to support this conclusion, it is obvious that simultaneous meteorolog- ical data are required to interpret rapid changes in ozone,
such as are described above.
During this intercomparison study the lidars and the ECC sondes made measurements over a longer period than is discussed here where we have considered only the measure- ments when all instruments were operating. The comparison
between the two lidars and between the lidars and the ECC
sondes have been considered separately elsewhere (I. S. McDermid et al., measurement intercomparison of the JPL and GSFC stratospheric ozone lidar system, submitted to Applied Optics, 1989, T. J. McGee et al., Lidar observations of ozone changes induced by subpolar airmass motion over Table Mountain (34.4øN), submitted to Journal of Geophys- ical Research, 1989]. In these other studies we were able to show more clearly the importance of meteorological infor- mation when making intercomparisons but the overall con-
clusions in these other studies are the same as those deter- mined here.
CONCLUSION
This intercomparison has shown that agreement to better than 5% can be obtained between the lidars, ECC sondes, ROCOZ-A sondes, and SAGE II when the measurements are made close together in both space and time. It also indicates that temporally and spatially coincident meteoro- logical data are necessary in interpreting and explaining apparent anomalies in the ozone data.
Acknowledgments. The work described in this paper was car- ried out at the Jet Propulsion Laboratory, California Institute of Technology, and at the NASA Goddard Space Flight Center, Langley Research Center, and Wallops Island Flight Facility. Fund- ing was provided by the National Aeronautics and Space Adminis- tration Upper Atmosphere Research program. We are grateful to the National Research Council for the award of an associateship to
S.M.G.
REFERENCES
Barnes, R. A., A. R. Bandy, and A. L. Torres, Electrochemical concentration cell ozonesonde accuracy and precision, J. Geo- phys. Res., 90, 7881-7887, 1985.
Barnes, R. A., A. C. Holland, and H. S. Lee, An improved rocket ozonesonde (ROCOZ-A), 2, Preparation of stratospheric ozone profiles, J. Geophys. Res., 91, 14,521-14,531, 1986.
Barnes, R. A., M. A. Chamberlain, C. L. Parsons, and A. C. Holland, An improved rocket ozonesonde (ROCOZ-A), 3, North-
em mid-latitude ozone measurements from 1983 to 1985, J.
Geophys. Res., 94, 2239-2254, 1989.
Cunnold, D. M., W. P. Chu, R. A. Barnes, M.P. McCormick, R. E. Veiga, and D. A. Chu, Error analysis and validation of SAGE II ozone measurements, paper presented at the Quadrennial Ozone Symposium, IAMAP Int. Ozone Comm., G6ttingen, Federal Republic of Germany, Aug. 1988.
Cunnold, D. M,, W. P. Chu, R. A. Barnes, M.P. McCormick, and R. E. Veiga, Validation of SAGE II ozone measurements, J. Geophys. Res., 94, 8447-8460, 1989.
Holland, A. C., R. A. Barnes, and H. S. Lee, Improved rocket ozonesonde (ROCOZ-A), 1, Demonstration of precision, Appl. Opt., 24, 3286-3295, 1985.
10,042 MCDERMID ET AL.: COMPARISON OF OZONE PROFILE MEASUREMENTS
Komhyr, W. D., and T. B. Harris, Development of an ECC ozone-sonde, NOAA Tech. Rep. ERL 200-APCL 18, Natl. Oce- anic Atmos. Admin., Boulder, Colo., 197!.
McDermid, I. S., Ground-based lidar and atmospheric studies, $urv. Geephys., 9, 107-122, 1987.
McDermid, I. S., and S. M. Godin, Stratospheric ozone measure- ments using a ground-based, high-power lidar, Laser Applications in Meteorology and Earth and Atmospheric Remote Sensing, edited by M. M. Sokolowski, Prec. $PIE lnt. Sec. Opt. Eng., 1062, 225-232, 1989.
McDermid, I. S., S. M. Godin, and L. O. Lindqvist, Ground-based laser DIAL system for long-term measurements of stratospheric ozone, Appl. Opt., in press, 1990.
McGee, T. J., R. Ferrare, J. J. Butler, P. Newman, D. Whiteman, and J. F. Burris, STROZ-LITE: NASA Goddard's Stratospheric Ozone Lidar Trailer Experiment, NASA-GSFC Tech. Dec., 1989. Upper Atmospheric Research Program (UARP), Network for the Detection of Stratospheric Change, Report of the Workshop, NASA Boulder, Colo., March 5-7, 1986.
Watson, R. T., et al., Present state of knowledge of the upper atmosphere 1988: An assessment report, NASA Ref. Publ. 1208,
1988.
World Meteorological Organization, Report of the International Ozone Trends Panel--1988, Rep. 18, Geneva, 1989.
R. A. Barnes, Chemal, Incorporated, P.O. Box 44, Wallops
Island, VA 23337.
J. Burris, R. Ferrare, T. J. McGee, P. Newman, D. Whiteman, Laboratory for Atmospheres, NASA Goddard Space Flight Center, Greenbelt, MD 20771.
J. Butler, S. T. Systems Incorporated, 4400 Forbes Boulevard, Lanham, MD 20706.
W. P. Chu and M.P. McCormick, Atmospheric Sciences Divi- sion, NASA Langley Research Center, Hampton, VA 23665.
S. M. Godin and I. S. McDermid, Jet Propulsion Laboratory, Table Mountain Facility, California Institute of Technology, Wright-
wood, CA 92397.
C. L. Parsons and A. Torres, Wallops Flight Facility Operations, NASA Goddard Space Flight Center, Wallops Island, VA 23337.
P. Wang, Science and Technology Corporation, 101 Research Drive, Hampton, VA 23666.
(Received October 31, 1989; revised December 19, 1989; accepted December 20, 1989.)