HAL Id: hal-00301346
https://hal.archives-ouvertes.fr/hal-00301346
Submitted on 20 Jul 2004HAL is a multi-disciplinary open access archive for the deposit and dissemination of sci-entific research documents, whether they are pub-lished or not. The documents may come from teaching and research institutions in France or abroad, or from public or private research centers.
L’archive ouverte pluridisciplinaire HAL, est destinée au dépôt et à la diffusion de documents scientifiques de niveau recherche, publiés ou non, émanant des établissements d’enseignement et de recherche français ou étrangers, des laboratoires publics ou privés.
Kinetic nucleation and ions in boreal particle formation
events
L. Laakso, T. Anttila, K. E. J. Lehtinen, P. P. Aalto, M. Kulmala, U. Hõrrak,
J. Paatero, M. Hanke, F. Arnold
To cite this version:
L. Laakso, T. Anttila, K. E. J. Lehtinen, P. P. Aalto, M. Kulmala, et al.. Kinetic nucleation and ions in boreal particle formation events. Atmospheric Chemistry and Physics Discussions, European Geosciences Union, 2004, 4 (4), pp.3911-3945. �hal-00301346�
ACPD
4, 3911–3945, 2004 Kinetic nucleation L. Laakso et al. Title Page Abstract Introduction Conclusions References Tables Figures J I J I Back Close Full Screen / EscPrint Version Interactive Discussion
© EGU 2004 Atmos. Chem. Phys. Discuss., 4, 3911–3945, 2004
www.atmos-chem-phys.org/acpd/4/3911/ SRef-ID: 1680-7375/acpd/2004-4-3911 © European Geosciences Union 2004
Atmospheric Chemistry and Physics Discussions
Kinetic nucleation and ions in boreal
particle formation events
L. Laakso1, T. Anttila1, 3, K. E. J. Lehtinen1, P. P. Aalto1, M. Kulmala1, U. H ˜orrak2, J. Paatero3, M. Hanke4, and F. Arnold4
1
Department of Physical Sciences, P.O. Box 64, FIN-00014 University of Helsinki, Finland
2
Institute of Environmental Physics, University of Tartu, 18 ¨Ulikooli Street, Tartu, 50090, Estonia
3
Finnish Meteorological Institute, Air Quality Research, Sahaajankatu 20E, FIN-00880 Helsinki, Finland
4
Max-Planck-Institute f ¨ur Kernphysik (MPI-K), P.O. Box 103980, D-69029 Heidelberg, Germany
Received: 13 May 2004 – Accepted: 2 June 2004 – Published: 20 July 2004 Correspondence to: L. Laakso (lauri.laakso@iki.fi)
ACPD
4, 3911–3945, 2004 Kinetic nucleation L. Laakso et al. Title Page Abstract Introduction Conclusions References Tables Figures J I J I Back Close Full Screen / EscPrint Version Interactive Discussion
© EGU 2004 Abstract
In order to gain a more comprehensive picture on different mechanisms behind at-mospheric particle formation, measurement results from QUEST 2-campaign are an-alyzed with an aid of an aerosol dynamic model. A special emphasis is laid on air ion and charged aerosol dynamics. Conducted model simulations indicate that kinetic 5
nucleation of ammonia and sulphuric acid together with condensation of sulphuric acid and low-volatile organic vapours onto clusters and particles explain basic features of particle formation events as well as ion characteristics. However, observed excess of negative ions in the diameter range 1.5–3 nm and overcharge of 3–5 nm particles demonstrate that ions are also involved in particle formation. These observations can 10
be explained by preferential condensation of sulphuric acid onto negatively charged clusters and particles. According to model simulations, the relative contribution of ion-based particle formation seem to be smaller than kinetic nucleation of neutral clusters. Conducted model simulations also corroborate the recently-presented hypothesis ac-cording to which a large number of so-called thermodynamically stable clusters (TSCs) 15
having a diameter between 1–3 nm exist in the atmosphere. TSCs were found to grow to the observable sizes only under favorable conditions, e.g. when the pre-existing par-ticle concentration was low.
1. Introduction
A considerable number of field measurements indicate that formation of nanometer-20
size particles and their growth into climatically relevant size range takes place regularly under various atmospheric conditions (Kulmala et al.,2004c). However, the overall im-portance of this phenomenon is highly uncertain at the present due to many poorly un-derstood links between the first step in particle formation, i.e. nucleation of nanometer-sized stable clusters, and an ultimate influence of new particles on the radiative bal-25
ACPD
4, 3911–3945, 2004 Kinetic nucleation L. Laakso et al. Title Page Abstract Introduction Conclusions References Tables Figures J I J I Back Close Full Screen / EscPrint Version Interactive Discussion
© EGU 2004 investigation of mechanisms behind new particle formation is warranted.
Several theories have been put forward to explain nucleation and subsequent growth of stable clusters into detectable sizes. Regarding nucleation, binary nucleation of water and sulphuric acid as well as ternary nucleation involving ammonia as a third compound has been proposed as plausible candidates (Korhonen et al.,1999). The 5
nucleation potential of organic compounds is still an open question (Gaman et al., 2004;Gao et al., 2001;Bonn and Moortgat, 2003). Nucleation of iodine compounds is likely to explain massive particle bursts observed in coastal areas (ODowd et al., 2002;Burkholder et al.,2004). Furthermore, ion-induced nucleation according to which stable clusters are formed upon atmospheric ions has also been investigated (Arnold, 10
1980;Laakso et al.,2002;Harrison and Carslaw,2003;Wilhelm et al.,2004;Yu and Turco,2000).
Observed particle growth has been hitherto explained by condensation of various or-ganic and inoror-ganic vapours, heterogeneous reactions and self-coagulation (Kulmala et al., 2000a; Kerminen et al., 1997; Zhang and Wexler, 2002; Anttila et al., 2003). 15
Any plausible theory, however, must predict sufficiently high growth rates since freshly-nucleated clusters are scavenged away very rapidly by pre-existing particles ( Kermi-nen et al., 2001). In particular, it has been suggested that the presence of electric charges in freshly-formed clusters enhance the uptake of polar molecules such as sul-furic acid thereby giving a growth advantage to charged clusters over neutral ones (Yu 20
and Turco,2001;Nadykto and Yu,2003;Nadykto et al.,2004). Atmospheric ions are thus expected to be involved in both nucleation and growth but their overall importance to particle formation is an open question at the present, due to a lack of comprehensive set of field measurements against which different explanations could be validated.
In order to gain a more comprehensive picture on different nucleation and growth 25
mechanisms, the present article analyzes measurement results obtained during QUEST 2-campaign carried out in SMEAR II-station (Vesala et al., 1998; Kulmala et al.,2001) during March 2003. Results are interpreted utilizing a relatively simple box model that covers the appropriate aerosol dynamical processes as well as the
ef-ACPD
4, 3911–3945, 2004 Kinetic nucleation L. Laakso et al. Title Page Abstract Introduction Conclusions References Tables Figures J I J I Back Close Full Screen / EscPrint Version Interactive Discussion
© EGU 2004 fects of charges on the simulated processes. The principal goals of the study are the
following:
1. to present air ion and charging state measurements,
2. to assess the importance of air ions on new particle formation taking place in the measurement site,
5
3. compare the measurements and model simulations for the measurement period, and
4. to investigate the possibility of kinetic nucleation to explain the evolution of observed ion size distributions.
10
The different measurements and the applied numerical model are described in Sects. 2 and 3, respectively. The measurement results are discussed in Sect. 4.1 and they are compared with model simulations in Sect. 4.2. Conclusions follow at Sect. 5.
2. Measurements
Several different instruments were utilized during the measurement period. The mobil-15
ity distribution of ions was measured with Balanced Scanning Mobility Analyzer (BSMA) and neutral particles with differential mobility particle sizer (DMPS). Ionizing radia-tion was measured by glass-fibre filters and scintillaradia-tion gamma spectrometer (Laakso et al.,2004). In addition, the natural charging state of the particles was measured. Sul-phuric acid was observed by a Chemical Ionization Mass Spectrometer (CI-MS) and 20
ACPD
4, 3911–3945, 2004 Kinetic nucleation L. Laakso et al. Title Page Abstract Introduction Conclusions References Tables Figures J I J I Back Close Full Screen / EscPrint Version Interactive Discussion
© EGU 2004 2.1. BSMA
The Balanced Scanning Mobility Analyzer manufactured by Airel Ltd., Estonia, consists of two plain aspiration-type differential mobility analyzers, one for positive and second for negative ions (Tammet, 2004). The two aspiration condensers are connected as a balanced bridge circuit that allows continuous variation of the driving voltage and 5
scanning of the mobility distribution of charged clusters and nanoparticles called air ions. Large airflow rate 44 liters per second helps to suppress the loss of air ions in the inlet of the instrument. The inlet can be closed or opened for ions using a controlled electrostatic filter and the background signal is eliminated making every second scan with closed inlet. A mobility distribution is calculated according to the results of 9 10
scans performed during 3 min. The electric mobility range of 0.032–3.2 cm2 V−1s−1is divided into 16 fractions that are equally spaced in a logarithmic scale. The mobility distribution is converted to a size distribution using the algorithm developed byTammet (1995). The size distribution is divided into 12 size classes that are equally distributed in a logarithmic space and span the diameter range 0.4–6.3 nm. The sampling height 15
was about 1.6 m above the ground. 2.2. AIS
The Air Ion Spectrometer (AIS, manufactured by AIREL Ltd, Estonia) is measuring the mobility distribution of air ions (naturally charged clusters and aerosol particles) in the range of 0.00075–2.4 cm2V−1s−1. The spectrometer consists of two identical cylindri-20
cal aspiration-type differential mobility analyzers, one for measuring positive ions and second for negative ions. Each mobility analyzer has 21 collector electrodes provided with individual electrometrical amplifiers for the measuring of electrical current carried by ions of different mobilities. The simultaneous measurements enable to record the air ion mobility distribution, which is showing considerable variation in ion concentra-25
tion and evolution in time. The air sample containing ions (flow rate is 500 cm3s−1) is sucked into the mobility analyzer through the electronically controlled electrostatic
ACPD
4, 3911–3945, 2004 Kinetic nucleation L. Laakso et al. Title Page Abstract Introduction Conclusions References Tables Figures J I J I Back Close Full Screen / EscPrint Version Interactive Discussion
© EGU 2004 filter (switched on/off). The measurements with closed inlet for ions are used for the
verification of the offset level and noise of electrometrical amplifiers. The both mobility analyzers have a closed loop of clean sheath air. The unipolar charging of aerosol particles in corona chargers and subsequent removal of charged particles by elec-trostatic filtration is used to create clean sheath airflow of 1000 cm3s−1. The mean 5
mobility distributions of positive and negative air ions and distribution uncertainties are calculated averaging the results of 20 measurements recorded during 5-min period. The mobility distribution of ions in the range of 0.00075–2.4 cm2V−1s−1 is presented by 28 logarithmically uniformly distributed fractions: 12 fractions in the mobility range of 0.075–2.4 cm2V−1s−1 and 16 fractions (two fractions per electrometrical channel) in 10
the range of 0.00075–0.075 cm2V−1s−1. The corresponding diameter ranges of single charged particles calculated according to the algorithm byTammet(1995) are 0.46–4.6 and 4.6–55 nm, respectively.
2.3. DMPS
Neutral particles were measured by the differential mobility particle sizer (DMPS). The 15
system consist of two parallel DMPS devices: the first classified the particles between 3 and 10 nm and the second device classified particles in the size range 10 and 500 nm. Both devices used Hauke-type differential mobility analyzer (DMA) (Winklmayr et al., 1991) and closed loop sheath flow arrangement (Jokinen and M ¨akel ¨a,1997). The first device has a 10.9 cm long DMA and the second one a 28 cm long DMA. Before sizing 20
aerosol is neutralized with a 74 MBq 2(mCi) Krypton-85 beta source. The particle counter of the 1st device was TSI model 3025 and the 2nd device used a TSI model 3010. The time resolution is 10 min. The sampling height was about 2 m above the ground.
ACPD
4, 3911–3945, 2004 Kinetic nucleation L. Laakso et al. Title Page Abstract Introduction Conclusions References Tables Figures J I J I Back Close Full Screen / EscPrint Version Interactive Discussion
© EGU 2004 2.4. Charging state measurements
The natural charging state of the particles having a diameter between 3–5 nm was measured with a special DMPS setup. There were two similar inlets, one with a neutral-izer (see Sect.2.3), another without a neutralizer (a dummy-one). The DMPS-system switched between these two inlets every 75 s. When the concentration measured with-5
out the charger was divided by the corresponding charged particle concentration, the natural charging state of the aerosol was obtained. If the value is equal to one, aerosol particles are in a charge equilibrium, whereas values less than one represent under-charged particles and values larger than one indicate overcharge of the particles. The system was calibrated with 4 nm ammonium sulphate particles which were measured 10
through both inlets. There were 33% more losses in the neutralizer compared to the dummy inlet and therefore the concentrations measured through charger were cor-rected by a factor of 1.5.
2.5. Gaseous sulphuric acid measurements
Gaseous sulphuric acid (GSA) was measured by a chemical ionization mass spec-15
trometer apparatus (CIMS) built by MPI-K Heidelberg. The instrument is essentially the same as the one used for measurements of atmospheric OH and HO2 and RO2 radicals except for the chemical conversion parts (Hanke et al.,2002). In brief the CIMS used in QUEST 2 consists of four major elements including an ion trap mass spectrom-eter, a flow reactor, an ion source, and a GSA-source used for calibration . Through the 20
flow reactor is passed atmospheric air (at ambient atmospheric pressure). In the ion source are produced reagent ions of the type NO3-(HNO3)n(with n being mostly 1) and subsequently introduced into the flow reactor. There these ions undergo ion-molecule reactions of the type NO3-(HNO3)n+H2SO4 HSO4-(HNO3)n+HNO3 whose rate coe ffi-cients are close to the ion-molecule collision rate coefficients. Using the mass spec-25
trometer the abundance ratio of product and reagent ions is measured. Building on this ion abundance ratio the sulphuric acid concentration in the flow reactor is determined.
ACPD
4, 3911–3945, 2004 Kinetic nucleation L. Laakso et al. Title Page Abstract Introduction Conclusions References Tables Figures J I J I Back Close Full Screen / EscPrint Version Interactive Discussion
© EGU 2004 The latter is typically only about 50% of the ambient atmospheric GSA-concentration
due to sulphuric acid losses to the walls of the sampling line and the flow reactor. In order to quantify these sulphuric acid losses a sulphuric acid source is used for careful calibrations. Also carefully determined is the sulphuric acid background signal of the CIMS-instrument which dictates the GSA-detection limit. During QUEST 2 the 5
GSA-detection limit was as low as about 1·105cm−3 corresponding to an atmospheric mole fraction of 4·10−15or (4 ppq). The time-resolution of the GSA-measurements was better than 1 second but usually sulphuric acid concentrations were integrated over 60 s to reduce the statistical error. The absolute uncertainty of the measured GSA-concentration is plus or minus 30%. A paper addressing in detail the CIMS used and 10
the GSA-measurements made during the QUEST 2-campaign is in preparation1.
3. Model description
A modified version of the model AEROION (Laakso et al., 2002) is applied here in simulating the time evolution of neutral as well as charged clusters and particles. The processes covered by the model are nucleation, coagulation and condensation of sul-15
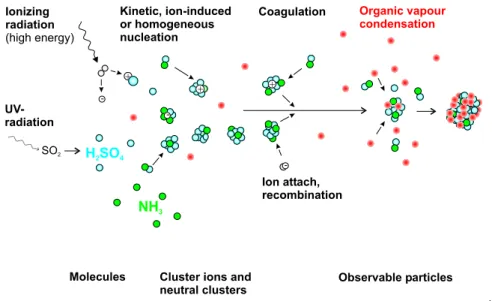
phuric acid and a low-volatile organic vapour. The effects of charges on these pro-cesses are taken into account comprehensively. The model is expressed schematically in the Fig.1.
The model distributes neutral particles into 52 size sections which span the radius range from around 0.3 nm (radius of one sulphuric acid molecule) to 1000 nm. Each 20
size bin is also divided to 3 charge bins, −1, 0 and+1 elementary charges. Because the chemical composition of the cluster ions may differ from the composition of the neutral clusters and particles, two additional sections are reserved for negative and positive cluster ions. All particles are assumed to consist of water, sulphate, ammonium
1
Scholz, S., Hanke, M., ¨Ucker, J., and Arnold, F.: Gaseous Sulfuric Acid Measurements
ACPD
4, 3911–3945, 2004 Kinetic nucleation L. Laakso et al. Title Page Abstract Introduction Conclusions References Tables Figures J I J I Back Close Full Screen / EscPrint Version Interactive Discussion
© EGU 2004 and an organic compound. Furthermore, the model utilizes measured size distributions
for particles larger than 40 nm in diameter. These particles are assumed to be in a charge balance which is determined from the properties of small ions. In practice, this leads to slightly more negative (52.5%) than positive particles (47.5%) in the diameter range above 40 nm. However, it should be noted that this assumption did not have a 5
significant effect on results.
The ion production rate and temperature were taken from the observations and the particle water uptake was calculated similarly than in the AEROION model using aver-age of measured RH.
Nucl eati on. A previous analysis of the measurement data indicates that nucleation
10
taking place in the measurement site is limited by gas-phase kinetics rather than ther-modynamics of ammonia-water-sulphuric acid system (Kulmala et al.,2000b, Kulmala, submitted, 20042), Ammonia is assumed to stabilize the clusters (Korhonen et al., 1999;Lee et al.,2003) and therefore the nucleation rate is determined by the collision rate of ammonium bisulphate clusters. Since the gas-phase concentration of ammonia 15
is clearly higher than that of sulphuric acid (Finlayson-Pitts and Pitts,2000), it is rea-sonable to assume that the formation rate of ammonium bisulphate clusters is limited by that of sulphuric acid molecules. Accordingly, the nucleation rate is calculated using the following equation:
J= K C2. (1)
20
Here J is the nucleation rate, K is the coagulation kernel between ammonium bisul-phate clusters and C is the gas-phase concentration of sulphuric acid.
Coagul ati on. Coagulation is treated similarly than in the AEROION model, except
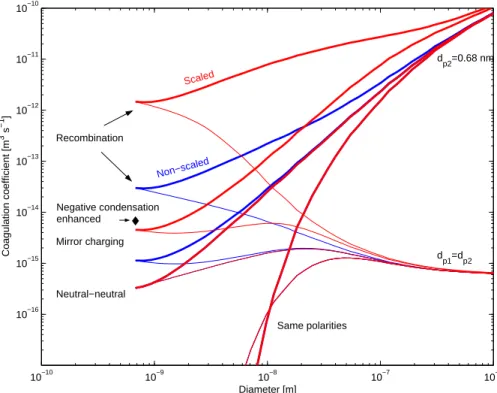
that general coagulation equation of Fuchs is applied in determining coagulation rates (Marlow,1980). The calculated coagulation coefficients are shown in Fig.2.
25
2
Kulmala, M., Laakso, L., Lehtinen, K., Riipinen, I., Dal Maso, M., Anttila, T., H ˜orrak, U., Vana, M., and Tammet, H.: Initial steps of aerosol growth, Atmos. Chem. Phys., submitted, 2004.
ACPD
4, 3911–3945, 2004 Kinetic nucleation L. Laakso et al. Title Page Abstract Introduction Conclusions References Tables Figures J I J I Back Close Full Screen / EscPrint Version Interactive Discussion
© EGU 2004 As can be seen, the coagulation coefficients do not reach ion-ion recombination
coefficient at the small cluster limit which is at around 0.7 nm in diameter. However, the problem with the current coagulation theories incorporating the effects of force fields is that there are no proper approaches for the kinetic region. This prevents rigorous calculations and therefore the coagulation coefficients were simply scaled so that they 5
matched the value of ion-ion recombination coefficient and ion-neutral reaction rate at the small cluster limit. Both of these approaches are used in the model calculations.
Ion-aerosol attachment coefficients are calculated based on Fuchs theory (Fuchs, 1964) as in the earlier version of the model. In some calculations the two ion classes were replaced with charged clusters consisting of a single pair of sulphuric acid and 10
ammonia molecules. This was done in aim to investigate the effect of chemical com-position of the ions to the system. We assumed the average measured properties both for positive and negative cluster ions, 1.4·10−4cm2V−1s−1and 1.6·10−4cm2V−1s−1, re-spectively. These properties were taken from the BSMA-measurements (vide infra).
Cond ensati on. The condensation of ammonium and sulphuric acid is treated in as
15
coagulation between molecules and particles. Ammonia is assumed to condense si-multaneously with sulphuric acid so that inorganic salt present in clusters and particles is effectively ammonium bisulphate. The gas-phase concentration of sulphuric acid was taken from the measurements.
Preliminary model calculations indicated that observed particle formation and growth 20
rates can not be produced unless low-volatile organic vapours are assumed to con-dense onto clusters and particles. Here we have applied the model developed by ( Kul-mala et al.,2004a) to calculate the saturation vapour pressure of the organic vapour above a cluster surface. According to Kulmala et al. (2004a) growth of nanometer-sized clusters due to condensation organic vapours is analogous to the cloud droplet 25
formation: the clusters ”activate” with respect to the organic vapour after they have reached a certain threshold diameter dcrit. In order to minimize computational burden the activation process is treated here assuming that organic vapour does not con-dense onto clusters having a diameter smaller than dcrit whereas above this size the
ACPD
4, 3911–3945, 2004 Kinetic nucleation L. Laakso et al. Title Page Abstract Introduction Conclusions References Tables Figures J I J I Back Close Full Screen / EscPrint Version Interactive Discussion
© EGU 2004 organic vapour condenses onto clusters and larger particles irreversibly, i.e. without any
thermodynamic barrier. Based on detailed thermodynamic calculations, the following equation for dcritwas derived Kerminen et al. (submitted, 2004)3:
dcrit = a+ b · T + c · ln(Sos)
1+ d · T + e · ln(Sos). (2)
Here dcrit is given in nanometers, a=6.49, b=−0.01556, c=0.039, d=−0.02, e=0.174, 5
Sos is the ambient saturation ratio of the organic vapour and T is the temperature. This parameterization was shown to mimic closely activation behaviour predicted by the original model (Kerminen et al., submitted). Practice, dcrit has values around 2 nm under considered conditions.
The condensation rate of the organic vapour onto activated particles and clus-10
ters was calculated using the Fuchs-Sutugin formula which takes into account mirror Coulomb interactions (Fuchs and Sutugin,1971;Lushnikov and Kulmala,2004). The gas-phase concentration of the organic vapour was assumed to be constant during each day and during the whole period it varied between 2.9–5.1 ·107cm−3 (Kulmala, submitted). Furthermore, the saturation vapour concentration of the organic vapour 15
was assumed to be equal to 1 ·106(Anttila et al.,2003;Kulmala et al.,2004a). 3
Kerminen, V.-M., Anttila, T., Lehtinen, K. E. J., and Kulmala, M.: Parameterization for atmo-spheric new-particle formation: application to a system involving sulfuric acid and condensable water-soluble organic vapors, Aerosol Science & Technology, submitted, 2004.
ACPD
4, 3911–3945, 2004 Kinetic nucleation L. Laakso et al. Title Page Abstract Introduction Conclusions References Tables Figures J I J I Back Close Full Screen / EscPrint Version Interactive Discussion © EGU 2004 4. Results 4.1. Measurements 4.1.1. Meteorology
Figures 3 and 4 represent the temperature (T ), relative humidity (RH) and global radiation during the days 83–88 (24–29 March 2003). All these quantities exhibit 5
quite similar diurnal variation throughout the whole measurement period. Only dur-ing the night 84–85 there were some changes due to the temperatures below zero, which made the air drier. We also looked at satellite pictures for this period (http: //www.sat.dundee.ac.uk), all days were clear except day 88 when there were some clouds. This can also be seen from the global radiation measurements.
10
4.1.2. DMPS measurements
Effect of pre-existing particle population on new particle formation can be conveniently quantified in terms of a so-called condensation sink (CS), i.e. the loss rate of con-densing vapours onto pre-existing particles. This concept is especially useful since it provides also a measure for the loss rate of freshly-formed clusters/particles due to 15
coagulation (Dal Maso et al.,2002). This approach is also called as Fuchs surface or Fuchs area.
Figure 5shows the value of CS during the considered days. As seen, the value of CS was relatively low during the measurement period except for the day 86 and the evening of the day 88.
20
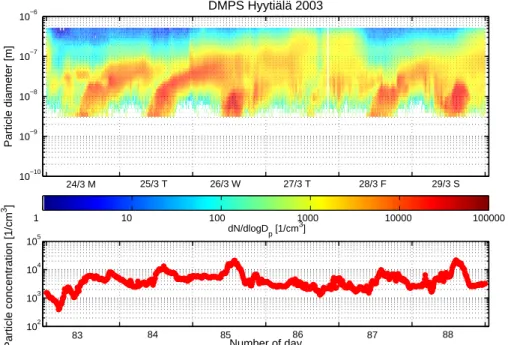
In Fig.6particle size distributions measured by DMPS are shown for the considered period. During the days 83, 84, 85, 87, and 88 apparent particle formation took place whereas during the day 86 the particle formation was much weaker and lasted for a shorter period.
By comparing DMPS size distributions with the time evolution of CS, it is seen that 25
ACPD
4, 3911–3945, 2004 Kinetic nucleation L. Laakso et al. Title Page Abstract Introduction Conclusions References Tables Figures J I J I Back Close Full Screen / EscPrint Version Interactive Discussion
© EGU 2004 the value of CS decreases always before a pronounced particle formation takes place.
In contrast, a large value of CS prevented particle formation in the morning of the day 86 and only a small particle burst is took place later during the day. Furthermore, particle formation was relatively weak during the days 85 and 88 which is probably caused by large values of CS. For example, the value of CS starts to increase during 5
the afternoon of the day 88, suppressing the growth of the nucleation mode particles. Overall, these observations illustrate the extreme sensitivity of new particle formation to the value of CS (M ¨onkk ¨onen et al.,2003).
4.1.3. Ions
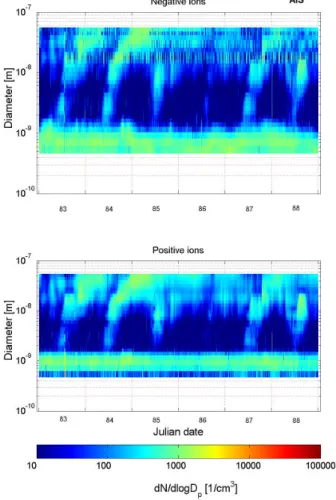
In Figs. 7and 8, the evolution of the size distribution of negative and positive cluster 10
ions and naturally charged particles (aerosol ions) based on BSMA and AIS measure-ments are shown, respectively, for various days during the period 24–29 March 2003. There are several things that can be seen from the measurements. First, the growing modes consisting of freshly-formed clusters and particles are seen from ion measure-ments. These modes start growing from the sizes of cluster ions below 2 nm in diam-15
eter. The growing mode in the size distribution of negative ions is more pronounced (enhanced concentrations) compared with positive ions in the size range below 5 nm. This feature (a clear preference of negative ions) was also found from the laboratory experiments (Wilhelm et al.,2004).
The sign preference can be due to particle formation mechanism or the sign prefer-20
ence of condensation rate . The latter property could be connected with the geometry of sulphuric acid molecules (Nadykto et al.,2004). The same also applies for condens-ing organic vapours, but the effect might be smaller because these compounds do not likely condense onto clusters having a diameter below 2 nm (see the previous section). The stability of the nanoclusters might be also influenced by a different composition 25
of negative and positive cluster ions (Eisele and Tanner,1990;Luts and Salm,1994; Beig and Brasseur,2000). For example,Lovejoy et al.(2004) observed that negative sulphuric acid ions grow without any energetic barrier. A purely neutral nucleation tends
ACPD
4, 3911–3945, 2004 Kinetic nucleation L. Laakso et al. Title Page Abstract Introduction Conclusions References Tables Figures J I J I Back Close Full Screen / EscPrint Version Interactive Discussion
© EGU 2004 to create a ”gap” between cluster ions and larger charged particles since the charge
probability increases with the particle size. This is also due to the finite time needed for the particle charging. However, this trend is balanced by the decreasing number concentrations with the increasing particle size. For example, if we have 105 neutral clusters (diameter e.g. 0.8 nm) with the charging probability of 1%0approximately 100 5
ion clusters is obtained and if the number of clusters (diameter e.g. 1.2 nm) is 104with the charging probability is 1%, again 100 ion clusters results.
The measurements show that the number concentration of ion clusters in the small-est size class 0.3–0.5 nm decreases slightly during the particle formation events. This feature is insensitive to the value of CS and is therefore probably connected to the 10
particle formation.
The size (or mobility) distribution of cluster ions depends on the chemical composi-tion of air (on amount of trace gases) and the concentracomposi-tion of aerosol particles. The latter affects the lifetime of cluster ions in the air. The lifetime depends also on the ion-ization rate, and therefore on the concentration radioactive substances in the ground 15
and in the air (e.g. radon). Variation of radon concentration due to the mixing causes approximately 10% difference for the ion production rate between the day and night (Laakso et al., 2004). One explanation for the observed decrease is possibly higher concentrations of condensable vapours which allows growing ions to reach larger sizes in a shorter time.
20
Another interesting observation is that during the days 85 and 88 there is a “gap” in the concentrations of ions having sizes 1.5–3 nm (Figs.7 and 8). During these days the value of CS is relatively high and and the gap is thus probably linked to the larger coagulation rates of charged clusters. It is also possible that during the high CS days nucleation mechanism differs from that of clean days.
ACPD
4, 3911–3945, 2004 Kinetic nucleation L. Laakso et al. Title Page Abstract Introduction Conclusions References Tables Figures J I J I Back Close Full Screen / EscPrint Version Interactive Discussion
© EGU 2004 4.1.4. Fractional concentrations of ions and particles and the charging state of 3-5nm
particles
In Fig. 9 the fractional concentration of ions (from BSMA) and particles are shown. As seen, the concentrations of ion clusters were relatively constant during the aerosol formation events. This indicates that ion-induced nucleation can not be the only or the 5
main particle formation mechanism. If we assume that clusters are produced via clas-sical ion-induced nucleation, the nucleation rate depends on the sulphuric acid concen-tration and on the ion production rate. Because the dependence on the sulphuric acid concentration is exponential the nucleation rate should sometimes reach the ion pro-duction rate. This would decrease the cluster ion concentrations notably and increase 10
significantly the concentration of charged particles having sizes 1.5–3 nm, which is in contrast to the observations.
On the other hand, mixing of the air parcels under turbulent conditions may prevent such drastic decrease in the concentrations and change this conclusion (Nilsson et al., 2001).
15
The alternative explanation of the nearly constant concentration of cluster ions is that the nucleation rate is well below the ionization rate. It was noted that the ob-served formation rate of 3 nm size particles in the boreal forest was in the range of 0.001–1 cm−3s−1 (M ¨akel ¨a et al.,2000), which never exceeded the ion-pair production rate typical for continental areas. The question is how rapidly cluster ions or critical 20
clusters (e.g. H2SO4 clusters) grow from initial size up to 3 nm, and how large are the concentration losses due to coagulation. The observations (BIOFOR) indicated that the ion sink has a minimum before the burst of 3 nm particles or even at the time of peak concentration of nanoparticles. So the changes in cluster ion concentration due to ion-induced nucleation can be masked by the changes in the ion sink.
25
Second interesting feature is that particles were slightly negatively overcharged (indi-cation for ion-induced nucleation) during particle formation events that took place when the value of CS was low. Otherwise particles remained undercharged. Overall, these
ACPD
4, 3911–3945, 2004 Kinetic nucleation L. Laakso et al. Title Page Abstract Introduction Conclusions References Tables Figures J I J I Back Close Full Screen / EscPrint Version Interactive Discussion
© EGU 2004 observations indicates that atmospheric ions are able to influence particle formation
taking place in the measurement site.
The third feature worth noting is that the relative concentrations of negative and positive ions in the size range of 3–5 nm depend on the ion size: negative ions were dominant in the smallest size fractions whereas particles having a diameter above 5
5 nm were always equally charged. There are three possible explanations for the first observation: 1) ion-induced nucleation has a negative sign preference (Kusaka et al., 1995; Wilhelm et al., 2004), 2) smaller (negative) ions charge particles more easily due to their higher mobility, and 3) the condensation rate onto positive and negative particles is different. Because large differences in the concentration and mobility of the 10
negative and positive cluster ions are not observed, the first explanation can not be the dominant one but the other two mechanisms determine charge dynamics of small ions. In the size range 3–5 nm, the proportion of negative ions to positive ions was ob-served to depend on the pre-existing particle concentration. When CS had a high value these concentrations were equal whereas negative ions were otherwise domi-15
nant. This could be explained by the smaller ion growth rates which allow more time to reach a charge balance. The discussed feature is, however, quite unexpected: high CS scavenge cluster ions effectively and therefore the probability of discharging events is lower when the value of CS is higher. Consequently, a net negative charge should exist in the opposite case than what was observed.
20
4.2. Model simulations
The measurement results were analyzed using the developed numerical model as tool. Main goals were to find whether kinetic nucleation of ammonium bisulphate clusters together with condensation of sulphuric acid and organic vapours can explain the basic features of the observed particle formation. Regarding ion dynamics, the principal 25
goals were to explain the following two findings:
ACPD
4, 3911–3945, 2004 Kinetic nucleation L. Laakso et al. Title Page Abstract Introduction Conclusions References Tables Figures J I J I Back Close Full Screen / EscPrint Version Interactive Discussion
© EGU 2004 2. a net unipolar charge existed in the particles with sizes 1.5–3 and 3–5 nm in
di-ameter.
The conducted model runs are divided into the following four cases: 1. coagulation coefficients obey enhanced Fuchs coagulation coefficients,
2. coagulation coefficients are scaled to reach ion-ion recombination coefficients in 5
the limit of molecular sizes,
3. coagulation coefficients obey enhanced Fuchs coagulation coefficients. In addi-tion, the condensation rate of sulphuric acid onto negative particles is 50% larger than onto the positive particles,
4. coagulation coefficients are scaled to reach ion-ion recombination coefficients and 10
the condensation rate of sulphuric acid onto negative particles is 50% larger than onto the positive particles.
Each of these four cases is divided further into three subcases:
a) cluster ions consist of a compound X of which mass and mobility are varied, b) positive ions consist of the compound X and negative ones ammonium bisulphate, 15
c) both negative and positive ions consist of ammonium bisulphate. 4.2.1. General features
New particles were formed in equal or higher amounts as observed in all model runs, the maximum difference being within a factor of three. The timing of particle formation events was also predicted well in all cases. Furthermore, the high value of CS inhibited 20
particle formation during the day 86, and particle formation characteristic for polluted days 85 and 88 were different than for the days 83, 84 and 87. However, the charge
ACPD
4, 3911–3945, 2004 Kinetic nucleation L. Laakso et al. Title Page Abstract Introduction Conclusions References Tables Figures J I J I Back Close Full Screen / EscPrint Version Interactive Discussion
© EGU 2004 characteristics and concentrations of nanometer-sized ions were different in different
cases.
Particles were always undercharged in cases 1c and 2c. Assuming different compo-sition for negative and positive cluster ions, slightly more negative than positive 1.5– 3 nm particles were formed. In addition, the modelled concentration of the 1.5–3 and 5
3–5 nm charged particles were of the same order of the magnitude as measured, vary-ing from 100 cm−3 to 800 cm−3. These sets of model runs reproduced also the over-charged/undercharged events. However, of all combinations, the measurements were best explained when different condensation rates of sulphuric acid onto negative and positive particles were assumed, i.e. by simulation sets 3) and 4) listed above. The 10
results from these model runs are shown in Figs.10and11and they can be compared with the corresponding observations shown in Figs.6–8and9.
4.2.2. Existence of neutral clusters
The model calculations suggest also that a large number of thermodynamically stable clusters (TSCs) exist below the DMPS detection limit (Fig.10). The number concentra-15
tion of cluster having diameter between 1 and 3 nm varied between 105cm−3during the particle formation events and approximately 10 cm−3 in the night. The corresponding variation in charged cluster concentration was about 500 cm−3 and 10 cm−3. A small fraction of these charged clusters belong to large cluster ions.
Freshly-formed TSCs are scavenged away rapidly by larger particles and their ex-20
istence requires a continuous source of new clusters. The model results indicate that a majority of TSCs are neutral. Furthermore, most of TSCs can not be distinguished from the cluster ions because they are not able to reach larger sizes due to the e ffec-tive coagulation scavenging. These clusters stabilize the cluster ion distribution and cause the observed fact that the cluster ion concentration is not influenced by particle 25
formation. Initial ions may charge these clusters and, on the other hand, TSCs may form by recombination of ion clusters (Arnold,1980).
mo-ACPD
4, 3911–3945, 2004 Kinetic nucleation L. Laakso et al. Title Page Abstract Introduction Conclusions References Tables Figures J I J I Back Close Full Screen / EscPrint Version Interactive Discussion
© EGU 2004 bility measurements complicated. The best approach for this is perhaps an ion mass
spectrometer which would measure ion masses in the size range 50–500 amu (cf. Eichkorn et al.,2002;Wilhelm et al.,2004). If one would detect combinations of sul-phuric acid and ammonia, the existence of stable ammonium bisulphate clusters could be inferred. However, e.g. the mass of initial core ions could make the interpretation 5
of the results complicated. There are also other possibilities for these measurements based on the properties of traditional condensation particle counters.
4.2.3. Possibility of binary ion-induced nucleation
The possibility of binary water-sulphuric acid nucleation was also investigated. Theory for ion-induced binary nucleation predicts that the critical cluster size is approximately 10
3–6 sulphuric acid molecules. According to the performed model calculations, however, this leads to significantly larger ion concentrations in the diameter range 1.5–3 nm than what was observed. Furthermore, assuming that 1) clusters are produced via ternary ion-induced nucleation and 2) ammonium bisulphate clusters are stable, the number concentration of charged clusters remained many orders of magnitude lower than that 15
of neutral clusters. Thus, even if charged clusters grow faster, the main contribution to over 3 nm particle concentrations result from neutral clusters.
4.2.4. Role of condensing organic vapours in particle formation
Two sets of model simulations were performed to investigate the sensitivity of the re-sults to the properties of the organic vapour.
20
First the organic vapour was removed entirely from the system, i.e. its gas-phase concentration was set equal to zero. This lead to so small growth rates that no particles appeared to the diameter range >3 nm. It can be thus concluded the observed gas-phase concentrations of sulphuric acid cannot explain the particle formation taking place in the measurement site.
25
ACPD
4, 3911–3945, 2004 Kinetic nucleation L. Laakso et al. Title Page Abstract Introduction Conclusions References Tables Figures J I J I Back Close Full Screen / EscPrint Version Interactive Discussion
© EGU 2004 particles without any thermodynamic barrier, i.e. its saturation vapour pressure was set
equal to zero. Because the organic vapour condensed onto all clusters regardless of their size this resulted in a particle concentrations that were more than one order of magnitude higher than the observed ones. This result gives a support to the existence of a certain threshold size below which low-volatile organic vapours do not contribute 5
to the cluster growth.
5. Conclusions
Basic features of the measurement results were successfully explained using an aerosol dynamic model that incorporates recent insights into nucleation and conden-sational growth of freshly-formed clusters. This leads to the following conclusions. 10
Nucleation taking place in the measurement site is probably limited by gas-phase kinetics rather than thermodynamics, i.e. by collision rate of ammonium bisulphate clusters. Kinetic nucleation produces a large number of mainly neutral stable clusters. Moreover, a clear majority of freshly-formed clusters are predicted to have sizes below 3 nm in diameter. This finding corroborates the recently presented hypothesis accord-15
ing to which a large number of so-called thermodynamically stable clusters (TSCs) exist below the detection limit of current instrumentation (Kulmala et al.,2000b).
The obtained results are also in agreement with the following picture on cluster and particle growth in boreal forests. First, freshly-formed TSCs are grown by self-coagulation and condensation of sulphuric acid into a threshold size which is around 20
2 nm in diameter. After reaching this size, clusters ”activate” with respect to low-volatile organic vapour(s) that grow the activated clusters rapidly into detectable sizes via con-densation. A distinguishable particle formation ensues only under favourable condi-tions since TSCs are scavenged away very rapidly by background particles. This high-lights the role of a pre-existing particle population in modulating atmospheric particle 25
formation.
over-ACPD
4, 3911–3945, 2004 Kinetic nucleation L. Laakso et al. Title Page Abstract Introduction Conclusions References Tables Figures J I J I Back Close Full Screen / EscPrint Version Interactive Discussion
© EGU 2004 charge of 3–5 nm particles demonstrate that ions are also involved in particle
forma-tion. These observations can be explained if sulphuric acid condenses preferably onto negatively charged clusters and particles. According to both model simulations the relative importance of ion-based particle formation is probably smaller than kinetic nu-cleation of neutral clusters and subsequent growth driven by condensation of sulphuric 5
acid and organic vapours.
References
Anttila, T., Kerminen, V.-M., Kulmala, M., Laaksonen, A., and ODowd, C.: Modelling the forma-tion of organic particles in the atmosphere, Atmos. Chem. Phys. Disc., 3, 6147–6178, 2003.
3913,3921 10
Arnold, F.: Multi-Ion complexes in the Stratosphere-Implications for trace gases and aerosol,
Nature, 284, 610–611, 1980. 3913,3928
Beig, G. and Brasseur, G.: Model of tropospheric ion composition: A first attempt, J. Geophys.
Res., 105, 22 671–22 684, 2000. 3923
Bonn, B. and Moortgat, G.: Sesquiterpene ozonolysis: Origin of atmospheric new particle
15
formation from biogenic hydrocarbons, Geophys. Res. Lett., 30, 1585–1588, 2003. 3913
Burkholder, J. B., Lovejoy, E. R., Ravishankara, A. R., and Curtius, J.: Laboratory studies of
the homogeneous nucleation of iodine oxides, Atmos. Chem. Phys, 4, 19–34, 2004. 3913
Dal Maso, M., Kulmala, M., Lehtinen, K., M ¨akel ¨a, J., Aalto, P., and O’Dowd, C.: Condensation and coagulation sinks and formation of nucleation mode particles in coastal and boreal forest
20
boundary layers, J. Geophys. Res., 107, 10.1029/2001JD001053, 2002. 3922
Eichkorn, S., Wilhelm, S., Aufmhoff, H., Wohlfrom, K., and Arnold, F.: Cosmic ray-induced aerosol formation: First evidence from aircraft-based ion mass spectrometer measurements,
Geophys. Res. Lett., 29 (14), doi:10.1029/2002GL015044, 2002. 3929
Eisele, F. and Tanner, D.: Identification of ions in continental air, J. Geophys. Res., 95, 20 539–
25
20 550, 1990. 3923
Finlayson-Pitts, B. J. and Pitts, J. N.: Chemistry of the Upper and Lower Atmosphere, Academic
Press, 2000. 3919
ACPD
4, 3911–3945, 2004 Kinetic nucleation L. Laakso et al. Title Page Abstract Introduction Conclusions References Tables Figures J I J I Back Close Full Screen / EscPrint Version Interactive Discussion
© EGU 2004
Fuchs, N. A. and Sutugin, A. G.: High-dispersed aerosols, in Topics in Current Aerosol
Re-search, edited by Hidy, G. M. and Brock, J. R., Pergamon, Oxford, 2, 1–60, 1971. 3921
Gaman, A. I., Kulmala, M., Vehkam ¨aki, H., Napari, I., Mircea, M., and Facchini, M. C.: Binary homogeneous nucleation in water-succinic acid and water-glutaric acid systems, J. Chem.
Phys., 120, 282–291, 2004. 3913
5
Gao, S., Hegg, A., Frick, G., Caffrey, P., Pasternack, L., Cantrell, C., Sullivan, W., Ambrusko,
J., Albrechcinski, T., and Kirchstetter, T.: Experimental and modelling studies of secondary organic aerosol formation and some applications to the marine boundary layer, J. Geophys.
Res., 106, 27 619–27 634, 2001. 3913
Hanke, M., Uecker, J., Reiner, T., and Arnold, F.: Atmospheric peroxy radicals: ROXMAS, a
10
new mass-spectrometric methodology for speciated measurements of HO2and Sigma RO2
and first results, Int. J. Mass. Spectrom., 213, 91–99, 2002. 3917
Harrison, R. and Carslaw, K.: Ion-aerosol cloud processes in the lower atmosphere, Rev.
Geo-phys., 41, doi:10.1029/2002RG000 114, 2003. 3913
Jokinen, V. and M ¨akel ¨a, J. M.: Closed loop arrangement with critical orifice for DMA
15
sheath/excess flow system, J. Aerosol Sci., 28, 643–648, 1997. 3916
Kerminen, V.-M., Wexler, A. S., and Potukuchi, S.: Growth of freshly nucleated particles in the
troposphere: roles of NH3, H2SO4, HNO3, and HCl, J. Geophys. Res., 102, 3715–3724,
1997. 3913
Kerminen, V. M., Pirjola, L., and Kulmala, M.: How signifigantly does coagulation scavening limit
20
atmospheric particle production?, J. of Geophys. Res., 106, 24 119–24 125, 2001. 3913
Korhonen, P., Kulmala, M., Laaksonen, A., Viisanen, Y., McGraw, R., and Seinfeld, J.: Ternary
nucleation of H2SO4, NH3 and H2O in the atmosphere, J. Geophys. Res., 104, 26 349–
26 353, 1999. 3913,3919
Kulmala, M.: How particles nucleate and grow, Science, 302, 1000–1001, 2003.
25
Kulmala, M., Korhonen, P., Laakso, L., and Pirjola, L.: Nucleation in boreal forest boundary
layer, Environ. Chem. Physics, 22, 46–53, 2000a. 3913
Kulmala, M., Pirjola, L., and M ¨akel ¨a, J. M.: Stable sulphate clusters as a source of new
atmo-spheric particles, Nature, 404, 66–69, 2000b. 3919,3930
Kulmala, M., H ¨ameri, K., Aalto, P., M ¨akel ¨a, J., Pirjola, L., Nilsson, E. D., Buzorius, G., Rannik,
30
¨
U., Dal Maso, M., Seidl, W., Hoffmann, T., Jansson, R., Hansson, H.-C., O‘Dowd, C., and Viisanen: Overview of the international project on biogenic aerosol formation in the boreal
ACPD
4, 3911–3945, 2004 Kinetic nucleation L. Laakso et al. Title Page Abstract Introduction Conclusions References Tables Figures J I J I Back Close Full Screen / EscPrint Version Interactive Discussion
© EGU 2004
Kulmala, M., Kerminen, V.-M., Anttila, T., Laaksonen, A., and ODowd, C. D.:
Or-ganic aerosol formation via sulphate cluster activation, J. Geophys. Res., 109,
doi:10.1029/2003JD003 961, 2004a. 3920,3921
Kulmala, M., Vehkam ¨aki, H., Pet ¨aj ¨a, T., Dal Maso, M., Lauri, A., Kerminen, V.-M., Birmili, W., and McMurry, P.: Formation and growth rates of ultrafine atmospheric particles: a review of
5
observations, J. Aerosol Sci., 35, 143–176, 2004b. 3912
Kusaka, I., Wang, Z.-G., and Seinfeld, J. H.: Ion-induced nucleation, II, Polarizable multipolar
molecules, J. Chem. Phys., 103, 8993–9009, 1995. 3926
Laakso, L., M ¨akel ¨a, J., Pirjola, L., and Kulmala, M.: Model studies on ion-induced nucleation in
the atmosphere, J. Geophys. Res., 107, doi:10.1029/2002JD002 140, 2002. 3913,3918
10
Laakso, L., H ˜orrak, U., Paatero, J., Pet ¨aj ¨a, T., Tammet, H., Joutsensaari, J., Lehtinen, K., and Kulmala, M.: Ion production rate in a boreal forest based on ion, particle and radiation
measurements, Atmos. Chem. Phys. Disc., accepted, 2004. 3914,3924
Lee, S.-H., Reeves, J., Wilson, J., Hunton, D., Viggiano, A., Miller, T., Ballenthin, J., and Lait, L.: Particle Formation by Ion Nucleation in the Upper Troposphere and Lower Stratosphere,
15
Science, 301, 1886–1889, 2003. 3919
Lovejoy, E., Curtius, J., and Froyd, K.: Atmospheric ion-induced nucleation of sulfuric acid and
water, J. Geophys. Res., 109, doi:10.1029/2003JD004 460, 2004. 3923
Lushnikov, A. and Kulmala, M.: A new flux-matching theory of particle charging, Europhysical
journal D, in print, 2004. 3921
20
Luts, A. and Salm, J.: Chemical composition of small atmospheric ions near the ground, J.
Geophys. Res., 99, 10 781–10 785, 1994. 3923
M ¨akel ¨a, J. M., Dal Maso, M., Pirjola, L., Keronen, P., Laakso, L., Kulmala, M., and Laaksonen, A.: Charasteristics of the atmospheric particle formation events observed at a boreal forest
site in southern Finland, Boreal Environment Research, 5, 299–313, 2000. 3925
25
Marlow, W.: Derivation of aerosol collision rates for singular attractive contact potentials, J.
Chem. Phys., 73, 6284–6287, 1980. 3919
M ¨onkk ¨onen, P., Koponen, I. K., Lehtinen, K. E. J., Uma, R., Srinivasan, D., H ¨ameri, K., and Kulmala, M.: Death of nucleation and Aitken mode particles: observations at extreme at-mospheric conditions and their theoretical explanation, J. Aeros. Sc., 35, 6, 781–787, 2004.
30
3923
Nadykto, A. and Yu, F.: Uptake of neutral polar vapour molecules by charged
ACPD
4, 3911–3945, 2004 Kinetic nucleation L. Laakso et al. Title Page Abstract Introduction Conclusions References Tables Figures J I J I Back Close Full Screen / EscPrint Version Interactive Discussion
© EGU 2004
doi:10.1029/2003JD003 664, 2003. 3913
Nadykto, A. B., Al Natsheh, A., Yu, F., Mikkelsen, K., and Ruuskanen, J.: Effect of molecular structure and hydration on the uptake of gas-phase sulfuric acid by charged clusters/ultrafine
particles, Aerosol Science and Technology, in press, 2004. 3913,3923
Nilsson, E., Rannik, ., Kulmala, M., Buzorius, G., and ODowd, C.: Effects of the
continen-5
tal boundary layer evolution, convection, turbulence and entrainment on aerosol tormation,
Tellus, 53B, 441–461, 2001. 3925
ODowd, C. D., Jimenez, J. L., Bahreini, R., Flagan, R. C., Seinfeld, J. H., H ¨ameri, K., Pirjola,
L., Kulmala, M., Jennings, S. G., and Hoffmann, T.: Marine aerosol formation from biogenic
iodine emissions, Nature, 417, 632–636, 2002. 3913
10
Ramanathan, V., Crutzen, P. J., Kiehl, J. T., and Rosenfeld, D.: Aerosol, climate and the
hydro-logical cycle, Science, 294, 2119–2124, 2001. 3912
Tammet, H.: Size and mobility of nanometer particles, clusters and ions, J. Aerosol. Sci., 26,
459–475, 1995. 3915,3916
Tammet, H.: Balanced Scanning Mobility Analyzer, 16th International Conference on
Nucle-15
ation & Atmospheric Aerosols (ICNAA) in Kyoto, 2004. 3915
Vesala, T., Haataja, J., Aalto, P., Altimir, N., Buzorius, G., Garam, E., H ¨ameri, K., Ilvesniemi, H., Jokinen, V., Keronen, P., Lahti, T., Markkanen, T., M ¨akel ¨a, J., Nikinmaa, E., Palmroth, S., and Palv: Long-term field measurements of atmosphere-surface interactions in boreal forest combining forest ecology, micrometeorology, aerosol physics and atmospheric chemistry,
20
Trends in Heat, Mass & Momentum Transfer, 4, 17–35, 1998. 3913
Wilhelm, S., Eichkorn, S., Wiedner, D., Pirjola, L., and Arnold, F.: Ion-induced aerosol formation: new insights from laboratory measurements of mixed cluster ions HSO−4(H2SO4)a(H2O)wand
H+(H2SO4)a(H2O)w, Atmos. Env., 38, 1735–1744, 2004. 3913,3923,3926,3929
Winklmayr, W., Reischl, G., Lindner, A., and Berner, A.: A new electromobility spectrometer for
25
the measurement of aerosol size distributions in the size range from 1 to 1000 nm, J. Aerosol
Sci., 22, 289–296, 1991. 3916
Yu, F. and Turco, R. P.: Ultrafine aerosol formation via ion-mediated nucleation, Geophys. Res.
Lett., 27, 883–886, 2000. 3913
Yu, F. and Turco, R. P.: From molecular clusters to nanoparticles: Role of ambient ionization in
30
tropospheric aerosol formation, J. Geophys. Res., 106, 4797–4814, 2001. 3913
Zhang, K. M. and Wexler, A.: A hypothesis for growth of fresh atmospheric nuclei, J. Geophys.
ACPD
4, 3911–3945, 2004 Kinetic nucleation L. Laakso et al. Title Page Abstract Introduction Conclusions References Tables Figures J I J I Back Close Full Screen / EscPrint Version Interactive Discussion
© EGU 2004
4 L. Laakso et al.: Kinetic nucleation
+ -SO2 + + Ionizing radiation (high energy) UV-radiation Coagulation -Organic vapour condensation Ion attach, recombination H SO2 4 Kinetic, ion-induced or homogeneous nucleation
Particle size increases, time increases Molecules Cluster ions and
neutral clusters
Observable particles
-NH3
Fig. 1. Schematic picture of the aerosol-ion model.
Here J is the nucleation rate, K is the coagulation kernel be-tween ammonium bisulphate clusters and C is the gas-phase concentration of sulphuric acid.
Coagulation. Coagulation is treated similarly than in the AEROION model, except that general coagulation equation of Fuchs is applied in determining coagulation rates (Marlow, 1980). The calculated coagulation coefficients are shown in Figure 2.
As can be seen, the coagulation coefficients do not reach ion-ion recombination coefficient at the small cluster limit which is at around 0.7 nm in diameter. However, the prob-lem with the current coagulation theories incorporating the effects of force fields is that there are no proper approaches for the kinetic region. This prevents rigorous calculations and therefore the coagulation coefficients were simply scaled so that they matched the value of ion-ion recombination coef-ficient and ion-neutral reaction rate at the small cluster limit. Both of these approaches are used in the model calculations. Ion-aerosol attachment coefficients are calculated based on Fuchs theory (Fuchs, 1964) as in the earlier version of the model. In some calculations the two ion classes were replaced with charged clusters consisting of a single pair of sulphuric acid and ammonia molecules. This was done in aim to investigate the effect of chemical composi-tion of the ions to the system. We assumed the average measured properties both for positive and negative cluster ions, 1.4·10−4cm2V−1s−1 and 1.6·10−4 cm2V−1s−1,
re-spectively. These properties were taken from the BSMA-measurements (vide infra).
Condensation. The condensation of ammonium and sul-phuric acid is treated in as coagulation between molecules and particles. Ammonia is assumed to condense
simultane-ously with sulphuric acid so that inorganic salt present in clusters and particles is effectively ammonium bisulphate. The gas-phase concentration of sulphuric acid was taken from the measurements.
Preliminary model calculations indicated that observed particle formation and growth rates can not be produced unless low-volatile organic vapours are assumed to con-dense onto clusters and particles. Here we have applied the model developed by (Kulmala et al., 2004a) to calcu-late the saturation vapour pressure of the organic vapour above a cluster surface. According to Kulmala et al. (2004a) growth of nanometer-sized clusters due to condensation or-ganic vapours is analogous to the cloud droplet formation: the clusters ”activate” with respect to the organic vapour af-ter they have reached a certain threshold diameaf-ter dcrit. In
order to minimize computational burden the activation pro-cess is treated here assuming that organic vapour does not condense onto clusters having a diameter smaller than dcrit
whereas above this size the organic vapour condenses onto clusters and larger particles irreversibly, i.e. without any ther-modynamic barrier. Based on detailed therther-modynamic calcu-lations, the following equation for dcritwas derived
(Kermi-nen et al., 2004): dcrit=
a+ b · T + c · ln(Sos)
1 + d · T + e · ln(Sos)
(2) Here dcrit is given in nanometers, a= 6.49, b= -0.01556,
c= 0.039, d= -0.02, e=0.174, Sos is the ambient saturation
ratio of the organic vapour and T is the temperature. This parameterization was shown to mimic closely activation be-haviour predicted by the original model (Kerminen et al., 2004). Practice, dcrit has values around 2 nm under
con-sidered conditions.
Fig. 1. Schematic picture of the aerosol-ion model.
ACPD
4, 3911–3945, 2004 Kinetic nucleation L. Laakso et al. Title Page Abstract Introduction Conclusions References Tables Figures J I J I Back Close Full Screen / EscPrint Version Interactive Discussion
© EGU 2004
L. Laakso et al.: Kinetic nucleation 5
10−10 10−9 10−8 10−7 10−6 10−16 10−15 10−14 10−13 10−12 10−11 10−10 Diameter [m] Coagulation coefficient [m 3 s −1 ] dp2=0.68 nm dp1=dp2 Negative condensation enhanced Mirror charging Neutral−neutral Recombination Same polarities Scaled Non−scaled
Fig. 2. Coagulation coefficients. Non-scaled coagulation coefficients result from Fuchs generalized theory whereas scaled coagulation
coefficients are forced to reach ion-ion recombination and ion-neutral reaction coefficients.
The condensation rate of the organic vapour onto activated particles and clusters was calculated using the Fuchs-Sutugin formula which takes into account mirror Coulomb interac-tions (Fuchs and Sutugin, 1971; Lushnikov and Kulmala, 2004). The gas-phase concentration of the organic vapour was assumed to be constant during each day and during the
whole period it varied between 2.9-5.1 ·107
cm−3(Kulmala
et al., 2004b). Furthermore, the saturation vapour
concentra-tion of the organic vapour was assumed to be equal to 1 ·106
(Anttila et al., 2003; Kulmala et al., 2004a).
4 Results
4.1 Measurements
4.1.1 Meteorology
Figures 3 and 4 represent the temperature (T), relative hu-midity (RH) and global radiation during the days 83-88 (24.3.-29.3.2003). All these quantities exhibit quite simi-lar diurnal variation throughout the whole measurement pe-riod. Only during the night 84-85 there were some changes due to the temperatures below zero, which made the air drier. We also looked at satellite pictures for this period (http://www.sat.dundee.ac.uk), all days were clear except day 88 when there were some clouds. This can also be seen from the global radiation measurements.
4.1.2 DMPS measurements
Effect of pre-existing particle population on new particle formation can be conveniently quantified in terms of a so-called condensation sink (CS), i.e. the loss rate of condens-ing vapours onto pre-existcondens-ing particles. This concept is es-pecially useful since it provides also a measure for the loss rate of freshly-formed clusters/particles due to coagulation (Dal Maso et al., 2002). This approach is also called as Fuchs surface or Fuchs area.
Figure 5 shows the value of CS during the considered days. As seen, the value of CS was relatively low during the mea-surement period except for the day 86 and the evening of the day 88.
In Figure 6 particle size distributions measured by DMPS are shown for the considered period. During the days 83, 84, 85, 87, and 88 apparent particle formation took place whereas during the day 86 the particle formation was much weaker and lasted for a shorter period.
By comparing DMPS size distributions with the time evo-lution of CS, it is seen that the value of CS decreases al-ways before a pronounced particle formation takes place. In contrast, a large value of CS prevented particle formation in the morning of the day 86 and only a small particle burst is took place later during the day. Furthermore, particle forma-tion was relatively weak during the days 85 and 88 which is probably caused by large values of CS. For example, the value of CS starts to increase during the afternoon of the day
Fig. 2. Coagulation coefficients. Non-scaled coagulation coefficients result from Fuchs
gener-alized theory whereas scaled coagulation coefficients are forced to reach ion-ion recombination and ion-neutral reaction coefficients.
ACPD
4, 3911–3945, 2004 Kinetic nucleation L. Laakso et al. Title Page Abstract Introduction Conclusions References Tables Figures J I J I Back Close Full Screen / EscPrint Version Interactive Discussion
© EGU 2004
6 L. Laakso et al.: Kinetic nucleation
−4 −2 0 2 4 6 8 10 Temperature [ °C] 30 40 50 60 70 80 90 100 DOY RH [%] 83 84 85 86 87 88
Fig. 3. Temperature and relative humidity
−100 0 100 200 300 400 500 600 DOY Golabl radiation [W m −2 ] 83 84 85 86 87 88
Fig. 4. Global radiation
88, suppressing the growth of the nucleation mode particles. Overall, these observations illustrate the extreme sensitivity of new particle formation to the value of CS (M ¨onkk¨onen
et al., 2003).
Fig. 3. Temperature and relative humidity.
ACPD
4, 3911–3945, 2004 Kinetic nucleation L. Laakso et al. Title Page Abstract Introduction Conclusions References Tables Figures J I J I Back Close Full Screen / EscPrint Version Interactive Discussion
© EGU 2004
6 L. Laakso et al.: Kinetic nucleation
−4 −2 0 2 4 6 8 10 Temperature [ °C] 30 40 50 60 70 80 90 100 DOY RH [%] 83 84 85 86 87 88
Fig. 3. Temperature and relative humidity
−100 0 100 200 300 400 500 600 DOY Golabl radiation [W m −2 ] 83 84 85 86 87 88
Fig. 4. Global radiation
88, suppressing the growth of the nucleation mode particles. Overall, these observations illustrate the extreme sensitivity of new particle formation to the value of CS (M ¨onkk¨onen
et al., 2003).
Fig. 4. Global radiation.
ACPD
4, 3911–3945, 2004 Kinetic nucleation L. Laakso et al. Title Page Abstract Introduction Conclusions References Tables Figures J I J I Back Close Full Screen / EscPrint Version Interactive Discussion
© EGU 2004
L. Laakso et al.: Kinetic nucleation 7
1 2 3 4 5 6 7 8 9 x 10⁻³ DOY Condensation sink [s −1 ] 83 84 85 86 87 88
Fig. 5. Condensation sink
4.1.3 Ions
In Figures, 7 and 8, the evolution of the size distribution of negative and positive cluster ions and naturally charged par-ticles (aerosol ions) based on BSMA and AIS measurements are shown, respectively, for various days during the period March 24-29, 2003. There are several things that can be seen from the measurements. First, the growing modes consist-ing of freshly-formed clusters and particles are seen from ion measurements. These modes start growing from the sizes of cluster ions below 2 nm in diameter. The growing mode in the size distribution of negative ions is more pronounced (en-hanced concentrations) compared with positive ions in the size range below 5 nm. This feature (a clear preference of negative ions) was also found from the laboratory experi-ments (Wilhelm et al., 2004).
The sign preference can be due to particle formation mech-anism or the sign preference of condensation rate . The latter property could be connected with the geometry of sulphuric acid molecules (Nadykto et al., 2004). The same also ap-plies for condensing organic vapours, but the effect might be smaller because these compounds do not likely condense onto clusters having a diameter below 2 nm (see the previous section).
The stability of the nanoclusters might be also influenced by a different composition of negative and positive cluster ions (Eisele and Tanner, 1990; Luts and Salm, 1994; Beig
and Brasseur, 2000). For example, Lovejoy et al. (2004) ob-served that negative sulphuric acid ions grow without any en-ergetic barrier. A purely neutral nucleation tends to create a ”gap” between cluster ions and larger charged particles since the charge probability increases with the particle size. This is also due to the finite time needed for the particle charging. However, this trend is balanced by the decreasing number concentrations with the increasing particle size. For
exam-ple, if we have 105
neutral clusters (diameter e.g. 0.8 nm)
with the charging probability of 1%0approximately 100 ion
clusters is obtained and if the number of clusters (diameter
e.g. 1.2 nm) is 104
with the charging probability is 1%, again 100 ion clusters results.
The measurements show that the number concentration of ion clusters in the smallest size class 0.3-0.5 nm decreases slightly during the particle formation events. This feature is insensitive to the value of CS and is therefore probably connected to the particle formation.
The size (or mobility) distribution of cluster ions depends on the chemical composition of air (on amount of trace gases) and the concentration of aerosol particles. The latter affects the lifetime of cluster ions in the air. The lifetime depends also on the ionization rate, and therefore on the concentra-tion radioactive substances in the ground and in the air (e.g. radon). Variation of radon concentration due to the mixing causes approximately 10% difference for the ion production rate between the day and night (Laakso et al., 2004). One
Fig. 5. Condensation sink.
ACPD
4, 3911–3945, 2004 Kinetic nucleation L. Laakso et al. Title Page Abstract Introduction Conclusions References Tables Figures J I J I Back Close Full Screen / EscPrint Version Interactive Discussion
© EGU 2004
8 L. Laakso et al.: Kinetic nucleation
102 103 104 105 Particle concentration [1/cm 3 ] Number of day 10−10 10−9 10−8 10−7 10−6 Particle diameter [m] DMPS Hyytiälä 2003 dN/dlogD p [1/cm 3] 24/3 M 1 10 100 1000 10000 100000 25/3 T 26/3 W 27/3 T 28/3 F 29/3 S 83 84 85 86 87 88
Fig. 6. Particle concentration measured by DMPS during the days 83-89
explanation for the observed decrease is possibly higher con-centrations of condensable vapours which allows growing ions to reach larger sizes in a shorter time.
Another interesting observation is that during the days 85 and 88 there is a ”gap” in the concentrations of ions hav-ing sizes 1.5-3 nm (Figure 7 and 8). Durhav-ing these days the value of CS is relatively high and and the gap is thus proba-bly linked to the larger coagulation rates of charged clusters. It is also possible that during the high CS days nucleation mechanism differs from that of clean days.
4.1.4 Fractional concentrations of ions and particles and the charging state of 3-5nm particles
In Figure 9 the fractional concentration of ions (from BSMA) and particles are shown. As seen, the concentrations of ion clusters were relatively constant during the aerosol formation events. This indicates that ion-induced nucleation can not be the only or the main particle formation mechanism. If we assume that clusters are produced via classical ion-induced nucleation, the nucleation rate depends on the sulphuric acid concentration and on the ion production rate. Because the dependence on the sulphuric acid concentration is
exponen-tial the nucleation rate should sometimes reach the ion pro-duction rate. This would decrease the cluster ion concentra-tions notably and increase significantly the concentration of charged particles having sizes 1.5-3 nm, which is in contrast to the observations.
On the other hand, mixing of the air parcels under turbu-lent conditions may prevent such drastic decrease in the con-centrations and change this conclusion (Nilsson et al., 2001). The alternative explanation of the nearly constant concen-tration of cluster ions is that the nucleation rate is well below the ionization rate. It was noted that the observed forma-tion rate of 3 nm size particles in the boreal forest was in the range of 0.001-1 cm−3s−1(M¨akel¨a et al., 2000), which never exceeded the ion-pair production rate typical for con-tinental areas. The question is how rapidly cluster ions or critical clusters (e.g. H2SO4clusters) grow from initial size up to 3 nm, and how large are the concentration losses due to coagulation. The observations (BIOFOR) indicated that the ion sink has a minimum before the burst of 3 nm particles or even at the time of peak concentration of nanoparticles. So the changes in cluster ion concentration due to ion-induced nucleation can be masked by the changes in the ion sink.
Fig. 6. Particle concentration measured by DMPS during the days 83–89.