HAL Id: hal-00316659
https://hal.archives-ouvertes.fr/hal-00316659
Submitted on 1 Jan 2000
HAL is a multi-disciplinary open access
archive for the deposit and dissemination of sci-entific research documents, whether they are pub-lished or not. The documents may come from teaching and research institutions in France or abroad, or from public or private research centers.
L’archive ouverte pluridisciplinaire HAL, est destinée au dépôt et à la diffusion de documents scientifiques de niveau recherche, publiés ou non, émanant des établissements d’enseignement et de recherche français ou étrangers, des laboratoires publics ou privés.
Letter to the Editor: A comparison of F-region ion
velocity observations from the EISCAT Svalbard and
VHF radars with irregularity drift velocity
measurements from the CUTLASS Finland HF radar
J. A. Davies, T. K. Yeoman, M. Lester, S. E. Milan
To cite this version:
J. A. Davies, T. K. Yeoman, M. Lester, S. E. Milan. Letter to the Editor: A comparison of F-region ion velocity observations from the EISCAT Svalbard and VHF radars with irregularity drift velocity measurements from the CUTLASS Finland HF radar. Annales Geophysicae, European Geosciences Union, 2000, 18 (5), pp.589-594. �hal-00316659�
Letter to the editor
A comparison of F-region ion velocity observations
from the EISCAT Svalbard and VHF radars with irregularity
drift velocity measurements from the CUTLASS Finland HF radar
J. A. Davies, T. K. Yeoman, M. Lester, S. E. Milan
Radio and Space Plasma Physics Group, Department of Physics and Astronomy, University of Leicester, University Road, Leicester, LE1 7RH, UK
e-mail: [email protected]
Received: 24 September 1999 / Revised: 21 February 2000 / Accepted: 24 February 2000 Abstract. During August 1998, the UK EISCAT special
programme SP-UK-CSUB, which combines operation of both the mainland VHF and Svalbard UHF inco-herent scatter radars, was run for several hours around magnetic midnight on four consecutive days. The CUTLASS Finland HF coherent scatter radar was, at these times, operating in a discretionary mode, sounding on all 16 beams, one at high-time resolution. This study presents a comparison of the velocities measured by coherent and incoherent techniques during the SP-UK-CSUB experiments. Agreement, particularly between the ion velocities measured by the EISCAT Svalbard radar and irregularity drift measurements by the Fin-land radar, is remarkable, thereby validating the scien-ti®c integrity of both data sets. This work highlights the substantive contribution to our understanding of the solar-terrestrial environment which can be made by use in concert of incoherent and HF coherent scatter radars. Key words: Ionosphere (ionospheric irregularities; plasma convection; instruments and techniques)
1 Introduction
Irregularity drift velocity measurements by coherent scatter radars have been compared to bulk plasma velocity measurements by other instrumentation, in-cluding satellite borne probes and incoherent scatter radars. Haldoupis and Schlegel (1990), and authors referenced therein, con®rmed experimentally previous theoretical evidence that the phase velocity of E-region irregularities, measured with the STARE VHF coherent scatter radar, is limited in magnitude to near the ion-acoustic speed. Evidence, both theoretical (e.g. Keskinen
and Ossakow, 1983) and observational (Villain et al., 1985; Ruohoniemi et al., 1987; Baker et al., 1990; Davies et al., 1999), suggests that the motion of F-region irregularities measured by HF coherent scatter radars, which, unlike their VHF or UHF counterparts, are not limited to E-region observation at high-latitude due to the refractive nature of radio propagation at HF, is determined by the ambient plasma ¯ow. This has also been found to be true of irregularities generated arti®cially in the F-region by high-power heating facilities (e.g. Eglitis et al., 1998).
The studies by Villain et al. (1985), Ruohoniemi et al. (1987) and Baker et al. (1990) were based on data taken over a restricted time interval and, consequently, on a very limited number of velocity pairs. In contrast, Davies et al. (1999) compared EISCAT UHF radar observations from over 1000 hours of common pro-gramme 1 (CP-1) and common propro-gramme 2 (CP-2) experiments to the drift velocity of natural irregularities, the latter measured by the CUTLASS Finland HF radar. Despite their extensive database, Davies et al. (1999) still found themselves limited to a relatively small number of velocity pairs, the EISCAT mainland site being by no means optimally located within the Finland radar ®eld-of-view from which to receive F-region returns. Here, irregularity drift speeds measured by the CUTLASS Finland radar are compared to ion velocity observations by the EISCAT mainland VHF radar and the EISCAT Svalbard radar (ESR).
2 Experimental arrangement
The UK EISCAT special programme SP-UK-CSUB, which combines operation of both the VHF radar and the ESR, was run over four four-hour intervals com-mencing at 21 UT on 20, 21, 22 and 23 August 1998. During these times, the CUTLASS radar at Hankasalmi in Finland (e.g. Davies et al., 1999 and references therein) was operating in a discretionary mode in which all 16 beams (numbered clockwise 0 to 15) were sounded at a dwell time of 2 s, but with the radar returning to Correspondence to: J. A. Davies
LET
sound on beam 9 between each; the scan is said to camp on beam 9. In total 75 range gates were sampled along each beam with a gate length of 45 km, and a range to the ®rst gate of 180 km.
The ESR, located at Longyearbyen (e.g. Wannberg et al., 1997) was, during SP-UK-CSUB, directed south-ward, with a geographic azimuth of 161.6° and an elevation of 31.0°. The ESR beam is aligned, at least in azimuth, along beam 9 of the CUTLASS Finland radar ®eld-of-view. The ESR was transmitting the GUP0 radar code, a multi-frequency long pulse. Received signals were integrated over 10 s and the data subse-quently analysed at a temporal resolution of 60 s. Analysis of ESR data is such that the user can vary the range resolution, in this case with gating of 12 km below a range of 330 km, which corresponds to an altitude of around 175 km, and 36 km range gates above 330 km.
In SP-UK-CSUB, the EISCAT VHF radar at Tromsù operated in a split beam mode with one beam (beam 2) directed along the boresight which corresponds to a geographic azimuth of 359.5° and the other (beam 1) phased 14.5° west to an azimuth of 345.0°; both beams are at a elevation of 30°. In SP-UK-CSUB, which is identical to the VHF common programme CP-4, long pulse and power pro®le codes are transmitted. The long pulse, to which data this study is limited, provides line-of-sight observations, on each beam, over 20 gates of range resolution 65.3 km with the ®rst gate centred at a range of 533.0 km. Like those from Svalbard, VHF observations were analysed at 1 min temporal resolu-tion. Beam 1 of the VHF radar is aligned in azimuth along beam 7 of the Finland radar whereas beam 2 is less convenient with regard the present study in this respect, crossing as it does beams 8, 9 and 10 of the Finland radar.
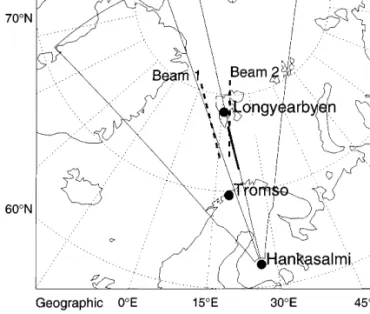
Figure 1 presents a map on which is depicted the ®eld-of-view of the CUTLASS Finland radar, beams 7 and 9 of which are illustrated explicitly. Moreover, coverage by the ESR is represented by a solid line and the VHF radar beams are indicated by dashed lines. The large ®lled circles represent the locations of the radars themselves and the cross within a circle, the geographic pole; the magnetic pole is indicated by the small ®lled circle.
3 Results
The four runs of SP-UK-CSUB are not equally useful with regard a comparison of irregularity drift velocity and F-region ion velocity. During the ®rst run, 20 August 2100 UT±21 August 0100 UT, there are a limited number of coherent echoes observed by the Finland radar within the viewing range of the ESR and VHF radars, mainly in the lower CUTLASS range gates of the common ®eld-of-view. The vast majority of these returns are, however, characterised by very narrow spectral widths and low velocities and, as such, have been identi®ed as ground scatter. For the purpose of the present study this interval is not considered further.
During the third run, ionospheric scatter is observed by the Finland radar within the common viewing area only between 2100 and 2200 UT on August 22. Over the other two runs, there is a preponderance of coherent scatter identi®ed as being of ionospheric origin within that portion of the Finland ®eld-of-view accessible to the incoherent scatter radars.
Figure 2 presents long pulse observations of line-of-sight ion velocity from 2100 UT on 21 August to 0100 UT on 22 August 1998 from the EISCAT Svalbard radar (Fig. 2a), and beams 1 and 2 of the mainland VHF radar (Fig. 2b, c, respectively). Figure 2d, e depicts line-of-sight irregularity drift velocity measure-ments along beam 7 and beam 9, respectively, of the CUTLASS Finland radar. Coherent returns identi®ed as arising from ground scatter are excluded as indeed are all Finland radar data with a line-of-sight irregularity drift velocity of magnitude less than 50 m s)1; the latter
is an attempt to remove potentially misidenti®ed ground scatter (e.g. Davies et al., 1999). Velocities are plotted as a function of geomagnetic latitude. Velocities are de®ned as being positive towards the radar, except in the case of the Svalbard radar where positive velocities represent ¯ow away from the radar in order to retain a consistency between the general orientations of the observations. An in-depth assessment of the geophysical processes arising during this interval is not attempted here, that being the subject of a forthcoming study.
The vagaries of propagation in the HF band is such that the altitude from which scatter originates is not well determined. Elevation angle-of-arrival measurements by the Finland system are consistent with the ionospheric scatter observed in the common viewing area of the three instruments during the SP-UK-CSUB experi-Fig. 1. The geographic location of the ®eld-of-view of the CUTLASS Finland radar, the ESR beam (solid line) and both the VHF radar beams (dashed lines). Beams 7 and 9 of the CUTLASS radar are highlighted explicitly. The locations of the radars are represented by large solid circles. The smaller solid circle indicates the position of the geomagnetic pole while the position of the geographic pole is represented as a cross within a circle
590 J. A. Davies et al.: A Comparison of F-region ion velocity observations
LET
Fig. 2a±e. Line-of-sight velocity measurements during the SP-UK-CSUB experiment run from 2100 UT on 21 August to 0100 UT on 22 August, 1998. Successive panels illustrate data from a the EISCAT
Svalbard radar, b beam 1 of the VHF radar, c beam 2 of the VHF radar, d beam 7 of the CUTLASS Finland radar and e beam 9 of the Finland radar, each as a function of geomagnetic latitude
LET
ments, being of F-region origin. The lowest range gate for VHF observations corresponds to an altitude of some 280 km while the lowest altitude at which the Svalbard radar observes is 108 km. As such, it should be borne in mind that ion velocities in the ®rst six or so ESR range gates, i.e. at altitudes below some 140 km, where ion-neutral collisions are signi®cant, will not be representative of the component of the E ´ B velocity along the radar line-of-sight.
Even a cursory glance reveals good general agree-ment between the observations from the coherent and incoherent systems, and, indeed, between the two incoherent scatter radars themselves. Exact agreement is not anticipated due to disparities between the sampling volumes of the systems (the beam width of the incoherent scatter radars being almost an order of magnitude smaller than that of the HF radar) and the integration periods of the data sets; velocities from both the ESR and VHF radars are integrated over 60 s, whereas beam 9 of the Finland radar is integrated for 2 out of every 4 s and beam 7 for only 2 s out of a total scan time of 64 s. Further discrepancies will be intro-duced due to geometrical factors. Finland velocities can be assumed orthogonal to the local magnetic ®eld, this being the condition necessary for coherent scatter. This need not be so for incoherent scatter, and, indeed, is not so here. It should also be noted that in the calculation of the range from which coherent returns are attributed assumes straight line propagation of HF waves, i.e. refraction eects are neglected and group retardation is
ignored. Although deviations from free-space propaga-tion have been found to be small, less than the length of a single range cell (e.g. Ruohoniemi et al., 1987), they are, nevertheless, not insigni®cant, particularly in stud-ies of this type.
Despite these possible sources of discrepancy, many small-scale ¯ow features observed by the Finland radar appear to be mirrored in the incoherent scatter obser-vations, for example the equatorward velocity burst observed at around 2300 UT both in beam 9 of the CUTLASS ®eld-of-view and by the Svalbard radar. The relationship between F-region ion velocity and irregu-larity drift velocity is investigated on a more quantita-tive basis by employing appropriate observations from all but the ®rst SP-UK-CSUB experiment.
Ion velocities measured by the ESR are compared statistically to the irregularity drift velocities from beam 9 of the Finland radar in Fig. 3a while velocities from beam 1 of the VHF radar are compared to drift speeds from Finland Beam 7 in Fig. 3b; the sign convention of the previous ®gure is maintained, with positive velocities directed towards the Finland radar. As with the previ-ous ®gure, all Finland radar data with a line-of-sight irregularity drift speed less than 50 m s)1, in addition to
those returns conventionally identi®ed as arising from ground scatter, are excluded. Moreover, a 3 dB thresh-old has been applied to the CUTLASS data and a 2% signal-to-noise ratio level to the EISCAT VHF obser-vations. In the situation where there are multiple estimates of irregularity drift velocity within a single
Fig. 3a±c. Scattergram of irregularity drift velocity a measured by the Finland radar versus F-region ion velocity measured by the ESR and b along beam 1 of the VHF radar, during the SP-UK-CSUB experiments. Both ion velocity and irregularity drift speed are binned
with a width of 50 m s)1, with the number of observations in each bin
represented by the colour scale to the right. c Reproduces the data
from the upper panel of Fig. 5 of Davies et al. (1999), in which ion velocity from the UHF radar is plotted against F-region irregularity drift velocity from the Finland radar, in an identical format to a and b. The solid lines indicate a hypothetical equality of irregularity drift and ion velocity
592 J. A. Davies et al.: A Comparison of F-region ion velocity observations
LET
EISCAT integration period, these have been averaged together. Moreover, where there are more than one ion velocity observation within a single CUTLASS range gate, as is the case with the ESR, these too have been averaged together. Although coherent returns of veloc-ity less than 50 m s)1have been excluded, the average of
the irregularity drift velocity over an EISCAT integra-tion period may still be less than that value. ESR range gates centred below 140 km altitude are excluded from the analysis, the velocities therein not being representa-tive of magnetised ¯ow.
The line-of-sight ion velocities measured by the ESR and along beam 1 of the VHF radar must be corrected for geometrical eects in order that direct comparison be made with the Finland drift observations. As noted previously, coherent scatter requires the radar wave vector to be near orthogonal to the magnetic ®eld. Although at approximately the same azimuths as beams 7 and 9 of the Finland radar, the ion velocities measured by the incoherent scatter systems are not perpendicular to the magnetic ®eld, rather at an angle determined by the radar beam elevation and direction of the local geomagnetic ®eld. The ion velocities are corrected such that they represent the ®eld-perpendicular ¯ow, albeit assuming that there is no ®eld-parallel motion of the ion population, an assumption the validity of which is discussed in more detail in the subsequent section, and that the radar beam lies in the same plane as the magnetic ®eld, the latter of which is reasonable under these circumstances of a mainly northward directed beam. The solid lines on Fig. 3 indicate a hypothetical equality of irregularity drift and ion velocity for comparative purposes.
4 Discussion
These observations, made over a four day interval, provide an exceptional opportunity for the comparison of F-region ion velocity with the drift speed of F-region ®eld-aligned irregularities. This is especially noteworthy given that in the work of Davies et al. (1999) coherent returns from the Finland radar were observed in the vicinity of the EISCAT site for a time totalling less than 4 h out of an entire database comprising more than 1000 h of measurements from the two most frequently run UHF common programmes, taken over a three year interval. Due to the geometrical arrangement of the SP-UK-CSUB experiment, the present VHF and ESR observations have the advantage over the UHF obser-vations employed in the velocity comparison of Davies et al. (1999) of being simultaneous over a number of CUTLASS Finland range gates. Moreover, the present study concentrates on latitudes poleward of those considered by Davies et al. (1999) where the nature of HF propagation limits Finland returns from the F-region.
Figure 3c reproduces the data from the upper panel of Fig. 5 of Davies et al. (1999), in which ion velocity from the UHF radar is plotted against the drift velocity of F-region irregularities measured by the Finland
radar, in an identical format to Fig. 3a, b. In this case the ion velocity plotted is the component of the vector velocity (the UHF being a tristatic system) resolved along the direction of the appropriate Finland beam. Davies et al. (1999) dierentiated between E- and F-region drift velocities on the basis of interferometric evidence. Figure 3c, in common with Fig. 3a, b, reveals a number of points corresponding to anomolously high values of irregularity drift velocity, which are attributed to uncorrelated spikes sometimes observed in CUT-LASS data (Davies et al., 1999).
The correspondence, not inconsistent with the equiv-alence of irregularity drift and bulk plasma motion in the F-region, noted by Davies et al. (1999) is surpassed in the present observations, especially with regard the EISCAT Svalbard radar, corrected velocities from which compare remarkably well with the line-of-sight drift velocity measurements from the CUTLASS Fin-land radar. There is signi®cant spread, however, which may be ascribed to a number of potentially deleterious eects such as discrepant temporal and spatial sampling. There does appear, however, to be a small yet systematic oset, of some 50 to 100 m s)1, between the irregularity
drift measurements and the ion velocities determined by the Svalbard radar. It is suggested that this is attribut-able, at least in part, to the assumption that there is no motion of the ion population along the magnetic ®eld direction, used in correcting the incoherent scatter velocity measurements from the Svalbard and VHF radars such that they represent ®eld-perpendicular ¯ows. On the nightside, the general antisunward hori-zontal motion of the neutral atmosphere, in response to pressure gradients set up by solar heating, will drive ions up the magnetic ®eld with a velocity of some several tens of m s)1(e.g. Rodger et al., 1992). Invoking an upward
®eld-aligned velocity of this order does indeed signi®-cantly reduce the oset observed between the HF drift and ESR velocity measurements.
Perhaps one of the most noteworthy features of this work is the number of velocity pairs available for comparison, over 3300 for the ESR and nearly 1500 for the VHF radar compared to a mere 525 simultaneous estimates of UHF ion velocity and F-region irregularity drift speed in the study of Davies et al. (1999); this is even more remarkable given that the latter was derived from a data set more than 50 times as long as the combined lengths of the four runs of SP-UK-CSUB. In addition to the superior geometrical arrangement of the SP-UK-CSUB experiment for a study of this type, with regard the location and extended latitudinal range of the common viewing area, this is possibly also attributable to the conditions associated with the more active part of the solar cycle.
5 Summary and conclusions
During August 1998, the UK EISCAT special pro-gramme SP-UK-CSUB, combining operation of both the mainland VHF and Svalbard incoherent scatter radars, was run in conjunction with discretionary mode
LET
operation of the CUTLASS Finland HF radar. Line-of-sight velocity measurements from the three instruments exhibit a consistency even with regard to small-scale features in the convective ¯ow pattern. The geometrical arrangement of the experiment permits, moreover, the direct statistical comparison of line-of-sight F-region ion velocities measured by the ESR and along one beam of the VHF radar with irregularity drift velocity measure-ments from the Finland radar.
Statistical comparison of ion velocities measured by the ESR and irregularity drift measurements by the Finland radar is particularly satisfying, despite a num-ber of potential sources of discrepancy, demonstrating once again that the CUTLASS system provides an invaluable spatial context in which to interpret small-scale features in the high-altitude ionosphere identi®ed by incoherent scatter techniques and, indeed, how signi®cant a contribution to our understanding of solar-terrestrial physics can be made by collaborative use of observations from incoherent and HF coherent scatter radars.
Acknowledgements. The authors wish to acknowledge support from the EISCAT group at the Rutherford Appleton Laboratory and other members of the UK campaign team. Additional thanks are due to N. M. Wade. EISCAT is funded collaboratively by the research councils of Finland, France, the Federal Republic of Germany, Japan, Norway, Sweden and the UK funding body, PPARC. CUTLASS is funded jointly by PPARC, the Swedish Institute for Space Physics and the Finnish Meteorological Institute.
The Editor-in-chief thanks C. Senior for her help in evaluating this paper.
References
Baker, K. B., R. A. Greenwald, J. M. Ruohoniemi, J. R. Dudeney, M. Pinnock, P. T. Newell, M. E. Greenspan, and C. I. Meng, Simultaneous HF radar and DMSP observations of the cusp, Geophys. Res. Lett., 17, 1869±1872, 1990.
Davies, J. A., M. Lester, S. E. Milan, and T. K. Yeoman, A comparison of velocity measurements from the CUTLASS Finland radar and the EISCAT UHF system, Ann. Geophysicae, 17, 892±902, 1999.
Eglitis, P., T. R. Robinson, M. T. Rietveld, D. M. Wright, and G. E. Bond, The phase speed of arti®cial ®eld-aligned irregu-larities observed by CUTLASS during HF modi®cation of the auroral ionosphere, J. Geophys. Res., 103, 2253±2259, 1998. Haldoupis, C., and K. Schlegel, Direct comparison of 1-m
irregularity phase velocities and ion acoustic speeds in the auroral E-region ionosphere, J. Geophys. Res., 95, 18989±19000, 1990.
Keskinen, M. J., and S. L. Ossakow, Theories of high-latitude ionospheric irregularities ± A review, Radio Sci., 18, 1077±1091, 1983.
Rodger, A. S., R. J. Moett, and S. Quegan, The role of ion drift in the formation of ionisation troughs in the mid- and high-latitude ionosphere ± A review, J. Atmos. Terr. Phys., 54, 1±30, 1992. Ruohoniemi, J. M., R. A. Greenwald, K. B. Baker, J.-P. Villain, and
M. A. McCready, Drift motions of small-scale irregularities in the high-latitude F-region: an experimental comparison with plasma drift motions, J. Geophys. Res., 92, 4553±4564, 1987. Villain, J.-P., G. Caudal, and C. Hanuise, A SAFARI-EISCAT
comparison between the velocity of F-region small-scale irreg-ularities and the ion drift, J. Geophys. Res., 90, 8433±8443, 1985. Wannberg G., L. Wolf, L.-G. Vanhainen, K. Koskenniemi, J. RoÈttger, M. Postila, J. Markkanen, R. Jacobsen, A. Stenberg, R. Larsen, S. Eliassen, S. Heck, and A. Huuskonen, The EISCAT Svalbard radar: A case study in modern incoherent scatter radar system design, Radio Sci., 32, 2283±2307, 1997.
594 J. A. Davies et al.: A Comparison of F-region ion velocity observations
LET