HAL Id: hal-01924558
https://hal.archives-ouvertes.fr/hal-01924558
Submitted on 26 May 2021
HAL is a multi-disciplinary open access
archive for the deposit and dissemination of
sci-entific research documents, whether they are
pub-lished or not. The documents may come from
teaching and research institutions in France or
abroad, or from public or private research centers.
L’archive ouverte pluridisciplinaire HAL, est
destinée au dépôt et à la diffusion de documents
scientifiques de niveau recherche, publiés ou non,
émanant des établissements d’enseignement et de
recherche français ou étrangers, des laboratoires
publics ou privés.
Long-lasting seismic repeaters in the Central Basin of
the Main Marmara Fault
J. Schmittbuhl, H. Karabulut, O. Lengline, M. Bouchon
To cite this version:
J. Schmittbuhl, H. Karabulut, O. Lengline, M. Bouchon. Long-lasting seismic repeaters in the Central
Basin of the Main Marmara Fault. Geophysical Research Letters, American Geophysical Union, 2016,
43 (18), pp.9527 - 9534. �10.1002/2016GL070505�. �hal-01924558�
Long-lasting seismic repeaters in the Central Basin
of the Main Marmara Fault
J. Schmittbuhl1,2, H. Karabulut2,3, O. Lengliné1, and M. Bouchon4
1EOST, CNRS/University of Strasbourg, Strasbourg, France,2USIAS, University of Strasbourg, Strasbourg, France,3KOERI, Bogazici University, Istanbul, Turkey,4ISTerre, CNRS/Joseph Fourier University, Grenoble, France
Abstract
The Main Marmara Fault which crosses the whole Marmara Sea is a significant seismic gap along the North Anatolian Fault. Here we show that nine long-lasting strike-slip seismic repeaters exist below the Central Basin within the seismogenic zone, in a 10 km region where deep creep was previously suggested from the analysis of the local seismicity. The typical recurrence time was 8 months during the 2008–2015 period. The cumulative slip of the repeating sequence appears to be compatible with the regional geodetic slip rate if they are assumed to be part of a large single asperity (10 km). The repeaters also exhibit short-term crises and are possibly related to bursts of creep.1. Introduction
One of the first examples of repeating earthquakes is the Parkfield sequence along the San Andreas Fault where on average a moderate event occurred every 22 years between 1857 and 1966 [Bakun et al., 1986]. Repeating earthquakes are nowadays rather restricted to small seismic events, typically a few hundred meters in rupture size, which occur repetitively in time at exactly the same place [Poupinet et al., 1984; Nadeau et al., 1995; Nadeau and McEvilly, 1999]. It suggests the existence of localized asperities which are mechanically decoupled from the rest of the fault and behave as independent oscillators [Rice, 1993]. To get repetitive earth-quakes requires an efficient and persistent reloading of the potential strain energy surounding the asperities. In some cases like the San Andreas Fault, tectonic loading might be sufficient to explain the periodicity of the repeaters in particular when asperities are sufficiently small [Lengliné and Marsan, 2009]. Fast repetitive rup-tures, possibly faster than the tectonic loading, are generally explained by a slow and aseismic slip of the fault area surrounding the asperity [Igarashi et al., 2003; Bourouis and Bernard, 2007; Chen and Lapusta, 2009]. They are also related to the limited relaxation of the strain energy during previous events owing to small stress drop related to a ductile regime [Amitrano, 2003].
The physical processes involved in repeating earthquakes are based on velocity strengthening friction of the fault [Dieterich, 1978; Perfettini et al., 2001, 2003] or the equivalent brittle creep rheology of the surrounding fault zone [Perfettini and Avouac, 2004; Perfettini and Ampuero, 2008]. These mechanisms lead to a logarith-mic relationship between shear stress and fault slip rate which is responsible for a nonlinear recurrence time of repeating earthquakes (e.g., Perfettini et al. [2003] for the variability of the fault response to a stress per-turbation). The physical link between creeping rheology and repeating earthquakes was first established for aftershock sequences and postseismic slip [Schaff et al., 1998]. In this case of a sudden change in the stress conditions, the recurrence time Tris expected to increase as 1∕t with the postseismic time t. During foreshock
sequences, repeaters are shown to emerge at an increasing rate, in connection with accelerating nucleation processes [Bouchon et al., 2011; Kato et al., 2012; Bouchon et al., 2013; Meng et al., 2015]. Creep is also pro-posed to be responsible for time-evolving repeaters related to induced seismicity [Bourouis and Bernard, 2007;
Lengliné et al., 2014]. On the contrary, for steady state loading (i.e., constant loading velocity), the recurrence
time Tr is expected to be rather constant and averageable over time: ̄Tr. In doing so, several observations related to repeating earthquakes are shown to be consistent with long-term creeping rheology of the fault zone [Nadeau and Johnson, 1998; Chen et al., 2007; Chen and Lapusta, 2009; Lengliné and Marsan, 2009]. In particular, the recurrence time of repeating earthquakes is shown to follow a specific statistics: ̄Tr ∼ M
1∕6 0
where M0is the seismic moment [Chen et al., 2007]. Since M0=𝜇AΔu, where 𝜇 is the rigidity, A the rupture
area, and Δu the average seismic slip; changing the rupture area A or the amount of slip Δu is expected to have a direct effect on the recurrence time Tr.
RESEARCH LETTER
10.1002/2016GL070505
Key Points:
• First observation of long-lasting seismic repeaters on the NAF • A long-term recurrence time of
8 months
• The cumulative slip of the repeaters is compatible with the tectonic loading
Supporting Information: • Supporting Information S1 Correspondence to: J. Schmittbuhl, [email protected] Citation: Schmittbuhl, J., H. Karabulut, O. Lengliné, and M. Bouchon (2016), Long-lasting seismic repeaters in the Central Basin of the Main Marmara Fault, Geophys.
Res. Lett., 43, 9527–9534,
doi:10.1002/2016GL070505.
Received 19 JUL 2016 Accepted 6 SEP 2016
Accepted article online 9 SEP 2016 Published online 23 SEP 2016
©2016. American Geophysical Union. All Rights Reserved.
Geophysical Research Letters
10.1002/2016GL070505
As suggested above, there are empirically two classes of repeating events according to their recurrence times. On the one hand, there are transient repeaters for which the repeating time is typically short and evolving in time, increasing during the nucleation phase of large events or decreasing during the postseismic period. The second type of repeating earthquakes, i.e., the long-lasting repeaters, exhibit quasi-stable repeating times and a limited range of magnitudes. On large faults where significant aseismic slip is expected to occur (including aseismic slip variations), both classes might coexist leading to a mix of transient and long-lasting repeaters. One open question is to know if these two families of repeating earthquakes show specific properties or if they are similar but the results of different loading conditions, i.e., transient or constant loading. It would allow to discriminate between transient dynamics of large earthquakes (nucleation or postseismic response) and ongoing constant overall tectonic loading of the fault zone.
In this study we focus on the western part of the North Anatolian Fault (NAF) and more precisely on the Main Marmara Fault (MMF) located below the Sea of Marmara. Recently, Schmittbuhl et al. [2016] concluded from the high-resolution analysis of the recent seismicity that the western part of the fault, i.e., the Central Basin, was hosting a significant creeping zone. Indeed, seismicity has been shown to extend significantly below the lock-ing depth of this region which has been measured as very shallow by Ergintav et al. [2014]. This region of the MMF also hosts moderate earthquakes (M≥ 4). Accordingly, it is a unique example of a strike-slip fault zone with a major seismic gap where transient and long-lasting repeaters might coexist.
2. Material and Methods
2.1. Waveform Database
The recent seismicity (between 2007 and 2012) around the Marmara Sea has been described in detail in Schmittbuhl et al. [2016]. The study was based on an extended regional network of 132 stations. It included broadband stations operated by KOERI (Kandilli Observatory and Earthquake Research Institute) and MAM-TUBITAK (the scientific and technological research council of Turkey), the short-period CINNET sta-tions supported by ANR (the French national research agency), stasta-tions installed during the european REAKT project by KOERI, the permanent cabled KOERI OBS stations, and the temporary OBS stations from IFREMER (French research institute for exploitation of the sea). Locations of events are obtained initially using HYPOCENTER code [Lienert and Havskov, 1995; Havskov and Ottemoller, 1999] assuming a 1-D velocity model for the Marmara basin [Karabulut et al., 2011] and including station delays estimated from the VELEST software [Kissling et al., 1994]. A second step is performed using HYPODD software [Waldhauser and Ellsworth, 2000] to get relative locations [Schmittbuhl et al., 2016]. The database we used here consists of the event waveforms of this seismicity catalog from 2008 to 2012 and extended up to 2015.
2.2. Multiplet Identification From the Regional Catalog
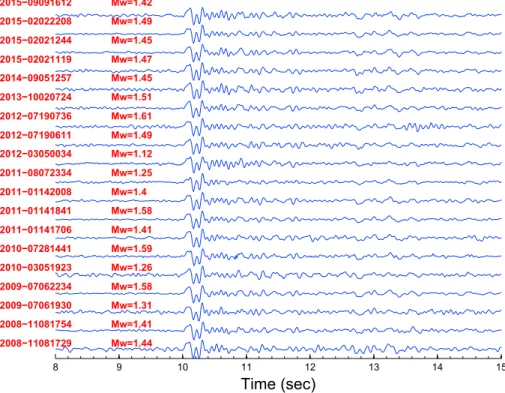
We searched for repeating earthquakes in the regional seismicity catalog of the MMF using a multi-plet analysis [Waldhauser and Ellsworth, 2002]. We used the GISMO toolbox (http://www.giseis.alaska.edu/ Seis/EQ/tools/GISMO/) for computing dendrogram-type hierarchical clustering of event families. Windows of 15 s for both vertical and horizontal components (starting 1 s before P arrival and filtered between 1 and 10 Hz) were introduced to compute the correlations. They are sufficiently long to include all main bulk phase arrivals (P, S, reflected, and converted phases) plus surface waves and a significant part of the coda (see Figure 1 and supporting information Figure S1). Accordingly, events within each multiplet all have similar phases including scattered waves. The second important parameter for setting up multiplets is the threshold for the maximum of the correlation coefficient between pairs of tested waveforms. We use a threshold of 0.9 meaning that the maximum correlation coefficient between waveforms belonging to a given event cluster or multiplet is larger than 0.9. The correlation coefficient is, however, mostly sensitive to larger amplitudes of shear waves and sur-face waves. Using this very selective procedure first on station SLVM and then other available stations close to the fault (OBS3, MARM, etc.), we obtained only nine clusters of events that show occurrences at least for three consecutive years during the 2008–2015 period (see Figure S1 and Table S1). As an example of the selected clusters, EW component waveforms of cluster #1 recorded at station SLVM are shown in Figure 1. Absolute locations of each cluster were defined from the best located event of the cluster (see Figure 2 and Table S1). We see that geographical locations of events are concentrated within the Central Basin of the MMF in a very narrow region (∼10 km along strike). To complete the set of occurrences of each multiplet obtained from the regional catalog, we performed a template search on the continuous waveform database of specific stations [Lengliné et al., 2016] (see Text S1).
Figure 1. Waveforms of a repeater detected at station SLVM (repeater #1 in Table S1) and located in the Central Basin
of the Marmara Sea. Traces of the EW component of the ground velocity are normalized with the maximum amplitude of the waveform. The figure is a zoom on the waveforms around theSarrivals. The origin times of the events are shown on the left with the moment magnitude.
3. Repeater Sources
A central issue is to know whether these multiplets, i.e., repeated waveforms at specific stations, are the results of repetitive ruptures of the same asperities along the fault zone, i.e., repeating events or repeaters. The con-sequence of having repeating events is very important in terms of fault mechanics since it requires a fast healing of the specific fault zone, a possible fast reloading compared to tectonic loading, and a reproducible
Figure 2. Location of repeating events in the Marmara sea during the period 2008–2015 (7.3 years) (in red). Basins along the MMF are from west to east:
Tekirdag Basin (TB), Central Basin (CeB), Kumburgaz Basin (KB), and Cinarcik Basin (CB). Locations of permanent OBS from KOERI are indicated by yellow triangles (operated in 2011–2012). Close regional stations are plotted with blue triangles. Our analysis focuses on waveforms from OBS3 and station SLVM (green triangle) which is one of the closest land stations with the best recovery rate during the studied period. Small black triangles show locations of other regional seismic stations. Traces of faults in black are from Emre et al. [2013]. The focal mechanism in red is that of cluster #4 (see Table S1 and Figure S2).
Geophysical Research Letters
10.1002/2016GL070505
strength of the asperity. Addressing this question is a difficult task for the Central Basin of the MMF since, on the one hand, long-term stations are rather remotely distributed inland (∼25 km from the fault) with a poor azimuthal distribution and, on the other hand, local OBS stations are sparse and only shortly deployed (maximum 2 years for the four permanent OBSs). We therefore study the details of the sources of the identified multiplets: focal mechanisms to check their compatibility with the strike-slip behavior of the MMF, improved locations to estimate possible overlaps of the rupture zones and their relative positions with respect to the seismogenic zone, spectral analysis for estimating moments, and corner frequencies to characterize rupture sizes and stress drops.
3.1. Focal Mechanism
The knowledge of the focal mechanism of the events of the multiplets is important to evaluate if they are attached to the main strike-slip fault zone (MMF) or to secondary normal faults related to the basin architec-ture. The difficulty is that events belonging to the identified multiplets are typically small (with magnitudes between 1 and 2), deep (8 to 15 km), and recorded by only a limited number of stations. Accordingly, individ-ual focal mechanisms are obtained with a poor accuracy. To overcome this difficulty, we computed composite mechanisms for each cluster using the polarity pickings of all available stations [Snoke et al., 1984]. An example of composite focal mechanism for cluster #4 is shown in Figures 2 and S2. It is based on the polarity pickings from 62 stations and 5 events of the cluster. The inverted focal mechanism shows an almost pure strike-slip mechanism with an east-west strike consistent with the MMF in this region.
3.2. Improved Locations
Table S1 shows the minimum and maximum intercluster distances defined as the straight 3-D distance between the absolute location of the best located events of each cluster. From the maximum intercluster dis-tance, we see that all clusters are within a zone of about 13 km (7 km in horizontal distance). The minimum distances between clusters are of the order of the location resolution (1 km). As a consequence, we con-clude that clusters have a spatial spreading (10 km) much larger than the related rupture sizes of the events. Therefore, we cannot evaluate from absolute locations whether some of the clusters are colocated or not. Within each cluster, absolute locations of the events show good geographical colocations but poor resolu-tion in depth, in particular for very small events (Ml ≤ 1.5) with a very limited number of picks. To overcome these location ambiguities, we employ two approaches: The first one is based on the identification of con-verted waves related to the basin geometry, and the second relies on time stretching between seismic phases including coda interferometry.
3.2.1. Converted Waves at the Sedimentary Basin Floor
A critical question is the depth of the repeaters. Indeed, it is important to know whether they are located within the seismogenic zone or not. Since the majority of the events within the nine multiplets have magnitudes less than 2 and are recorded by only a few stations, conventional location estimates exhibit large errors. In order to show that the repeaters are taking place at depths below the Marmara sedimentary basin (i.e., below 6 km), we interpret secondary phases observed in the OBS recordings of the vertical component waveforms (see Figure S1). Events of Figure S1 have been chosen for their large S∕N ratio. They have different waveforms and are aligned on the P arrivals. S arrivals are clearly visible, and S-P times are in the range [3–4 s]. However, in between, clear arrivals emerge following the direct P arrival (∼1.5 s later). These secondary phases have an amplitude larger than P arrivals suggesting that they are not simple P reflections (PwP) at the sea surface (their amplitude would then be equal to or smaller than the P arrivals). We interpret these arrivals to be S-to-P (S/P) and P-to-S (P/S) converted waves at the bottom of the sedimentary basin with a larger magnitude than the P arrivals. To support the interpretation we computed the traveltime/distance curves for a source at 13 km depth using a simple three-layer model: a layer for the basement and a layer for the 6 km sediments overlaid by a sea water layer of 1.2 km thickness (see Figure S3). We see that observed S/P and P/S and S arrival times are very consistent with computed ones for epicentral distances in the range [6–14 km]. The similarity of arrival times suggests that converted waves might have constructive interferences with reflected waves from the surface of the sea (PwP). Observing converted arrivals for all clusters suggests that they are all located below the sedimentary basin in the seismogenic zone of the MMF which is consistent with the absolute locations of the best located event of each multiplet except for cluster #7 (see Table S1).
3.2.2. Waveform Stretching
To get information about the relative locations of each occurrence of a given multiplet, we studied the possible stretching of the similar waveforms. This technique is often used in coda wave interferometry to measure small
changes in wave velocities [Snieder et al., 2002]. Here we use the same technique but for a different purpose: to compare the relative arrival times of each phase for different occurrences of events [Bouchon et al., 2011]. More specifically, we compare all pairs of events recorded at station SLVM by computing the cross-correlation function using the same 2 s moving window along both waveforms after aligning unfiltered waveforms in time on the S arrival (Figure S4). The correlation coefficient is close to 1 for the S phase and stays very high all along the coda wave (during more than 7 s). Interestingly, the time shift at the maximum of correlation is very small, i.e., of the order of ±1 time sample which is 0.01 s. This time shift is shown to be constant and not increasing with time. Similar observations are obtained from the waveforms of the same cluster recorded at other stations (MARM and OBS3). Indeed, no stretching, even in the coda, is observed for different station azimuths. Consequently, the analysis shows that there are strong overlaps of the source areas and very limited perturbations of the surrounding medium during the occurrences of each multiplet. Using the formulation of Snieder and Vrijlandt [2005] which relates the relative positions of the sources𝛿, the average shear velocity
𝛽 ≈ 3500 m/s, and the variance of the time shifts 𝜎𝜏 ≈ 0.01 s, as 𝛿2≈ 3𝜎2𝜏⋅ 𝛽2, we obtain an estimate of the
source position fluctuations:𝛿 ≈ 100 m. It confirms that multiplet sources are colocated within a zone of a hundred meters.
3.3. Spectral Analysis
Spectral analysis of the displacement waveforms typically provides interesting features of the seismic source when a simple fault model is assumed [Udías et al., 2014]. Here since the events are small and recorded at large distances, i.e., in far-field conditions, we based our analysis on the extended fault model of Madariaga [1976] and the spectrum model of Boatwright [1978] (see supporting information: Text S2 and Figure S5). The model predicts a link between the source dimension a and the corner frequency fcas follows: fc= 0.21𝛽s∕a
for a rupture velocity v = 0.9𝛽 and a P/S velocity ratio 𝛼∕𝛽 = 1.73. We measured the attenuation factor to be
Q = 200 and the source radius a ≈ 60 − 120 m. Details of the estimated parameters for each cluster are given
in Table S2. Our observations from spectral analysis suggest that the rupture size of all events within a multi-plet are similar and of the order of 100 m. From coda wave interferometry, we see that position fluctuations are of the order of the same size of 100 m. These results lead to the conclusion that the observed mutiplets, i.e., repeated waveforms, are repeating events (or repeaters) on the same fault asperity. They are shown to be on the MMF with a pure strike-slip mechanism within the seismogenic zone below the Marmara sedi-mentary basin. The repeating time of these events is then expected to be a signature of the in situ behavior of the fault.
4. Transient and Long-Lasting Repeaters
4.1. Repeater History
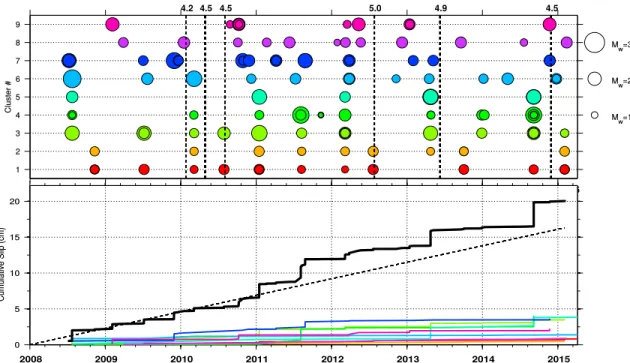
Figure 3 shows the timing of the occurrences of the nine identified repeaters (Table S1) in the Central Basin between 2008 and 2015 (7.26 years). The figure also includes a description of their moment magnitude Mw
estimated from the spectrum of each event. As a guideline, we added the dates of the large regional earth-quakes (Mw> 4). Several important qualitative observations can be deduced from this figure. First there are
typically 11 occurrences for each repeater during the period which provides an estimate of their recurrence time: ∼8 months. Second, these occurrences are typically independent of regional earthquakes. There are, however, clear signatures of time interactions and synchronization between clusters. Third, each major occur-rence can include a short-term sequence (superimposed circles) with similar or variable magnitudes. Forth, magnitudes of events within a repeater are small and quasi-constant but still showing some fluctuations through time. In conclusion, there are two clocks in this system: a short-term clock, a priori attached to clus-tering effects within a few days and probably related to periods of fast loading, and a long-term clock of the order of 8 months which translates into an apparent periodicity of the repeater triggering.
4.2. Recurrence Time Distribution
To be more precise about the internal clock of repeaters, we computed the distribution of the recurrence times of all repeaters (Figure 4). The main part of the figure shows the distribution for long recurrence times in years. The coefficient of variation (COV) for the long-term recurrences of each cluster is given in Table S1. It is shown to be smaller than 1 for all clusters which is a signature of a significant periodicity. A Poisson distri-bution P(k) =𝜆ke−𝜆∕k! for an average number of occurrences,𝜆 = 11.4, within the 7.26 year time window of
Geophysical Research Letters
10.1002/2016GL070505
Figure 3. (top) Time sequence for each repeater in days from 1 January 2008. The symbol size is a function of the event magnitude. Vertical dotted lines
correspond to occurrences of large regional events (M> 4with a source location longitude in the range [27.5∘–28.5∘]; theMwmagnitude of each event is added on the top of the line). (bottom) With color lines, cumulative slip history of each cluster during the period 2008–2015. Individual slips are estimated from the moment magnitudeM0and the corner frequencyfcderived from the displacement spectrum recorded at station SLVM (see Table S2). The thick black line is the sum of the slips from all clusters assuming they are the response of a single asperity. The thin dotted line is the geodetic slip rate of 23 mm/yr.
as a single ensemble: 7.6 months. It confirms the direct estimate obtained from Figure 3. At short time scale, the inset of Figure 4 provides a detail of the distribution for hourly recurrence times. The distribution shows a power law behavior of recurrence times that has the hallmark of an Omori’s law including postseismic relax-ation [Perfettini and Avouac, 2004]. At very short recurrence times, lower than a few minutes, it is expected that we miss events owing to overlapping. In summary, the recurrence time distribution clearly confirms the dual internal clock of repeaters: temporary sequences of events strongly clustered within a few hours and persistent occurrences with a long-term periodicity of 7.6 months.
Figure 4. Distribution of the recurrence times for all occurrences of the nine repeaters. The main curve shows
the long recurrence time distribution in years. The red dotted line is a Poisson distribution for a periodicity of 0.64 year, i.e., 7.6 months. The inset is a focus on the short recurrence times in minutes. It is fitted by a power law (with an exponent 0.4) as an Omori’s decay (black dotted line).
5. Cumulative Slip Estimate
From the spectral analysis of the waveforms, we deduced seismic moments M0and corner frequencies which
set the source radii of each event. Using Madariaga’s model [Udías et al., 2014] it is also possible to estimate two major mechanical parameters of the repeaters: the induced slip Δu and the rupture stress drop Δ𝜎. Indeed, it is expected that Δu = M0∕𝜋𝜇a2where𝜇 is the shear modulus and Δ𝜎 = 7M0∕16a3. From shear wave velocity
measurements, we deduced that𝜇 = 35 GPa [Schmittbuhl et al., 2016]. Table S2 summarizes the averaged slip ⟨Δu⟩ and averaged stress drop ⟨Δ𝜎⟩ for each repeater when averaging over all occurrences for each repeater. We observed that the stress drops are rather low suggesting that the stress released by the successive ruptures in each repeater is far from being total. This is consistent with a fast reloading of the repeater asperity. Figure 3 also presents the cumulative slip history of each repeater with color lines which can be compared to the geodetic rate of 23 mm/yr. We observe that slip rates of repeaters are rather continuous and small (typically 10 times smaller) but not negligible compared to the geodetic rate as suggested by the slip averages reported in Table S2. It confirms that each repeater has a persistent contribution to the slip response of the fault suggesting that a permanent creep process is at play around the repeater zone.
A surprising result is that when summing all individual slip histories of the identified repeaters, the total slip rate is observed to be very consistent with the geodetic rate. We cannot decipher if this is a coincidence or the signature of an unexpected collective behavior of the repeaters. In this case, it would suggest that the nine repeaters we observed are the signature of the shearing of a single large asperity of a multikilometer scale. The simultaneous occurrences of the different repeaters would then be the different modes of slip of the same asperity. In other words, each occurrence of the repeaters is the signature of the slip of the whole asperity, seismically where the repeater is activated and aseismically everywhere else. The significant time correlations observed in Figure 3 are consistent with such a scenario.
6. Conclusions
From the seismic monitoring of the Central Basin of the Marmara sea, we extracted nine clusters of very similar events. An important common property of these multiplets is that they exhibit high correlations over a very long time window (compared to their total duration). In other terms, all the phases including direct arrivals, converted phases, and codas are extremely similar. Their focal mechanisms are shown to be very consistent with the strike-slip context of the MMF. Interestingly, converted waves at the bottom of the basin confirm the deep absolute location of this set of rather small events (Mwin the range [1–2.5]). Using waveform
stretch-ing technique of coda wave interferometry, we concluded that events of each cluster are colocated within a few hundreds of meters. The spectral analysis provides overall mechanical properties of the events: a rupture area of the order of 100 m with a small stress drop (about 10 bars). Small stress drops and the independence from regional large earthquakes suggest that the region is in ductile regime with a high stress level. This is also consistent with the regional complexity of the fault and the presence of extended earthquake swarms [Schmittbuhl et al., 2016]. All these observations show that these multiplets are seismic repeaters along the NAF. The detailed analysis of the timing of the repeater occurrences provides evidences that two internal clocks are involved: a short time scale of few hours related to intermittent sequences of aftershock-like events possibly related to postseismic relaxation and a long time scale of 7.6 months of quasiperiodic occurrences related to bursts of creep. The cumulative slip of each repeater is shown to be small but significant com-pared to the geodetic slip rate. Surprisingly, the total cumulative slip rate of all repeaters is consistent with the 23 mm/yr geodetic rate. It suggests that all repeaters belong to the same 10 km large asperity and are mul-tiple responses of its overall slip. It confirms that a significant part of this region is undergoing an important creep as suggested from the recent seismicity analysis of Schmittbuhl et al. [2016].
References
Amitrano, D. (2003), Brittle-ductile transition and associated seismicity: Experimental and numerical studies and relationship with the
b-value, J. Geophys. Res., 108(B1), 2044, doi:10.1029/2001JB000680.
Bakun, W. H., G. C. King, and R. S. Cockerham (1986), Seismic slip, aseismic slip, and the mechanics of repeating earthquakes on the Calaveras Fault, California, in Earthquake Source Mechanics, edited by S. Das, J. Boatwright, and C. H. Scholz, pp. 195–207, AGU, Washington, D. C.
Boatwright, J. (1978), Detailed spectral analysis of two small New York State earthquakes, Bull. Seismol. Soc. Am., 68(4), 1117–1131. Bouchon, M., H. Karabulut, M. Aktar, S. Ozalaybey, J. Schmittbuhl, and M. Bouin (2011), Extended nucleation of the 1999Mw7.6 Izmit
earthquake, Science, 331, 877–880.
Acknowledgments
V. Durand, M. Aktar, L. Geli, P. Henry, S. Ergintav, R. Reilinger, J.P. Ampuero, F. Masson, E. Klein, M. Meghraoui, F. Cornet and O. Konca are deeply acknowledged for very fruitful discussions and data providing. We thank H. Perfettini and an anonymous reviewer for their constructive comments that helped to improve the manuscript. KOERI and TUBITAK-MRC are deeply acknowledged for the seismic data. The project was supported by FP-7 REAKT and MARSITE projects and ANR MODALSIS and SUPNAF grants.
Geophysical Research Letters
10.1002/2016GL070505
Bouchon, M., V. Durand, D. Marsan, H. Karabulut, and J. Schmittbuhl (2013), The long precursory phase of most large interplate earthquakes,
Nat. Geosci., 6(4), 299–302.
Bourouis, S., and P. Bernard (2007), Evidence for coupled seismic and aseismic fault slip during water injection in the geothermal site of Soultz (France), and implications for seismogenic transients, Geophys. J. Int., 169(2), 723–732.
Chen, K. M., R. M. Nadeau, and R. J. Rau (2007), Towards a universal rule on the recurrence interval scaling of repeating earthquakes?,
Geophys. Res. Lett., 43, L16308, doi:10.1029/2007GL030554.
Chen, T., and N. Lapusta (2009), Scaling of small repeating earthquakes explained by interaction of seismic and aseismic slip in a rate and state fault model, J. Geophys. Res., 114, B01311, doi:10.1029/2008JB005749.
Dieterich, J. H. (1978), Time-dependent friction and the mechanics of stick-slip, Pure Appl. Geophys., 116(4–5), 790–806.
Emre, O., T. Duman, S. Özalp, H. Elmacı, ¸S. Olgun, and F. ¸Saro ˘glu (2013), 1/1.125.000 Ölçekli türkiye diri fay haritası, Tech. Rep., Maden Tetkik ve Arama Genel Müdürlü ˘gü, Ankara, Türkiye.
Ergintav, S., R. Reilinger, R. Çakmak, M. Floyd, Z. Çakir, U. Do ˘gan, R. King, S. McClusky, and H. Özener (2014), Istanbul’s earthquake hot spots: Geodetic constraints on strain accumulation along faults in the Marmara seismic gap, Geophys. Res. Lett., 41, 5783–5788, doi:10.1002/2014GL060985.
Havskov, J., and L. Ottemoller (1999), Seisan earthquake analysis software, Seismol. Res. Lett., 70(5), 532–534.
Igarashi, T., T. Matsuzawa, and A. Hasegawa (2003), Repeating earthquakes and interplate aseismic slip in the northeastern Japan subduction zone, J. Geophys. Res., 108(B5), 2249, doi:10.1029/2002JB001920.
Karabulut, H., J. Schmittbuhl, S. Özalaybey, O. Lengliné, A. Kömeç-Multu, V. Durand, M. Bouchon, G. Daniel, and M. Bouin (2011), Evolution of the seismicity in the eastern Marmara Sea a decade before and after the 17 August 1999 Izmit earthquake, Tectonophysics, 510(1–2), 17–27, doi:10.1016/j.tecto.2011.07.009.
Kato, A., K. Obara, T. Igarashi, H. Tsuruoka, S. Nakagawa, and N. Hirata (2012), Propagation of slow slip leading up to the 2011Mw9.0 Tohoku-oki earthquake, Science, 335(6069), 705–708.
Kissling, E., W. Ellsworth, D. Eberhart-Phillips, and U. Kradolfer (1994), Initial reference models in local earthquake tomography, J. Geophys.
Res., 99, 19,635–19,646, doi:10.1029/93JB03138.
Lengliné, O., and D. Marsan (2009), Inferring the coseismic and postseismic stress changes caused by the 2004Mw= 6Parkfield earthquake from variations of recurrence times of microearthquakes, J. Geophys. Res., 114, B10303, doi:10.1029/2008JB006118. Lengliné, O., L. Lamourette, L. Vivin, N. Cuenot, and J. Schmittbuhl (2014), Fluid-induced earthquakes with variable stress drop, J. Geophys.
Res. Solid Earth, 119, 8900–8913, doi:10.1002/2014JB011282.
Lengliné, O., Z. Duputel, and V. Ferrazzini (2016), Uncovering the hidden signature of a magmatic recharge at Piton de la Fournaise volcano using small earthquakes, Geophys. Res. Lett., 43, 4255–4262, doi:10.1002/2016GL068383.
Lienert, B. R., and J. Havskov (1995), A computer program for locating earthquakes both locally and globally, Seismol. Res. Lett., 66(5), 26–36. Madariaga, R. (1976), Dynamics of an expanding circular fault, Bull. Seismol. Soc. Am., 66(3), 639–666.
Meng, L., H. Huang, R. Bürgmann, J. P. Ampuero, and A. Strader (2015), Dual megathrust slip behaviors of the 2014 Iquique earthquake sequence, Earth Planet. Sci. Lett., 411, 177–187.
Nadeau, R., W. Foxall, and T. McEvilly (1995), Clustering and periodic recurrence of microearthquakes on the San Andreas Fault at Parkfield, California, Science, 267(5197), 503–507.
Nadeau, R. M., and L. R. Johnson (1998), Seismological studies at Parkfield VI: Moment release rates and estimates of source parameters for small repeating earthquake, Bull. Seismol. Soc. Am., 88(3), 790–814.
Nadeau, R. M., and T. V. McEvilly (1999), Fault slip rates at depth from recurrence intervals of repeating microearthquakes, Science, 285(5428), 718–721.
Perfettini, H., and J.-P. Ampuero (2008), Dynamics of a velocity strengthening fault region: Implications for slow earthquakes and postseismic slip, J. Geophys. Res., 113, B09411, doi:10.1029/2007JB005398.
Perfettini, H., and J.-P. Avouac (2004), Postseismic relaxation driven by brittle creep: A possible mechanism to reconcile geodetic measurements and the decay rate of aftershocks, application to the Chi-Chi earthquake, Taiwan, J. Geophys. Res., 109, B02304, doi:10.1029/2003JB002488.
Perfettini, H., J. Schmittbuhl, J. R. Rice, and M. Cocco (2001), Frictional response induced by time-dependent fluctuations of the normal loading, J. Geophys. Res., 106(B7), 13,455–13,472.
Perfettini, H., J. Schmittbuhl, and A. Cochard (2003), Shear and normal load perturbations on a two-dimensional continuous fault: 1. Static triggering, J. Geophys. Res., 108(B9), 2408, doi:10.1029/2002JB001804.
Poupinet, G., W. Ellsworth, and J. Frechet (1984), Monitoring velocity variations in the crust using earthquake doublets: An application to the Calaveras Fault, California, J. Geophys. Res., 89(B7), 5719–5731.
Rice, J. R. (1993), Spatio-temporal complexity of slip on a fault, J. Geophys. Res., 98(B6), 9885–9907.
Schaff, D. P., G. C. Beroza, and B. E. Shaw (1998), Postseismic response of repeating aftershocks, Geophys. Res. Lett., 25(24), 4549–4552. Schmittbuhl, J., H. Karabulut, O. Lengliné, and M. Bouchon (2016), Seismicity distribution and locking depth along the main Marmara Fault,
Turkey, Geochem. Geophys. Geosyst., 17, 954–965, doi:10.1002/2015GC006120.
Snieder, R., and M. Vrijlandt (2005), Constraining the source separation with coda wave interferometry: Theory and application to earthquake doublets in the Hayward fault, California, J. Geophys. Res., 110, B04301, doi:10.1029/2004JB003317.
Snieder, R., A. Grêt, H. Douma, and J. Scales (2002), Coda wave interferometry for estimating nonlinear behavior in seismic velocity, Science,
295(5563), 2253–2255.
Snoke, J., J. Munsey, A. G. Teague, and G. Bollinger (1984), A program for focal mechanism determination by combined use of polarity and
SV-Pamplitude ratio data, Earthquake Notes, 55(3), 15.
Udías, A., R. Madariaga, and E. Buforn (2014), Source Mechanisms of Earthquakes: Theory and Practice, Cambridge Univ. Press, Cambridge, U. K.
Waldhauser, F., and W. L. Ellsworth (2000), A double-difference earthquake location algorithm: Method and application to the northern Hayward fault, California, Bull. Seismol. Soc. Am., 90(6), 1353–1368.
Waldhauser, F., and W. L. Ellsworth (2002), Fault structure and mechanics of the Hayward Fault, California, from double-difference earthquake locations, J. Geophys. Res., 107(B3), 2054, doi:10.1029/2000JB000084.