HAL Id: halshs-01222489
https://halshs.archives-ouvertes.fr/halshs-01222489
Submitted on 30 Oct 2015
HAL is a multi-disciplinary open access archive for the deposit and dissemination of sci-entific research documents, whether they are pub-lished or not. The documents may come from teaching and research institutions in France or abroad, or from public or private research centers.
L’archive ouverte pluridisciplinaire HAL, est destinée au dépôt et à la diffusion de documents scientifiques de niveau recherche, publiés ou non, émanant des établissements d’enseignement et de recherche français ou étrangers, des laboratoires publics ou privés.
Is the European banking system more robust? An
evaluation through the lens of the ECB’s Comprehensive
Assessment
Guillaume Arnould, Salim Dehmej
To cite this version:
Guillaume Arnould, Salim Dehmej. Is the European banking system more robust? An evaluation through the lens of the ECB’s Comprehensive Assessment. 2015. �halshs-01222489�
Documents de Travail du
Centre d’Economie de la Sorbonne
Is the European banking system more robust? An evaluation through the lens of the ECB’s
Comprehensive Assessment
Guillaume ARNOULD, Salim DEHMEJ
Is the European banking system more robust? An evaluation
through the lens of the ECB’s Comprehensive Assessment.
Guillaume Arnould1 and Salim Dehmej2
July 2015
(First version: November 2014) Abstract
The results of the Comprehensive Assessment (CA) conducted by the ECB seem to attest the soundness of the European banking system since only 8 of 130 assessed banks still need to raise €6 billion. However it would be a mistake to conclude that non failing banks are completely healthy. Using data provided by the ECB and the EBA after the CA, we assess the capital shortfalls for each banks by considering the transitional arrangements, an implementation of Basel III sovereign debt requirements and an enhancement of the leverage ratio. In addition we show, that if the CA has been a very complex exercise, it is not the best lens through which the soundness of the eurozone banking system should be evaluated. The assumptions used for the Asset Quality Review (AQR) and the stress-tests lead to week scenarios and requirements that undermine the reliability of the results. Finally we show that the low profitability, the massive dividend distribution and the incurred fines, give rise to concern on the ability of eurozone banks to meet the incoming capital requirements.
JEL codes: G21, G28.
Keywords: financial stability, stress tests, banking, financial regulation, Basel III.
1 Paris I Panthéon-Sorbonne University. Labex Régulation Financière (Réfi). Email:
guillaume.arnould@univ-paris1.fr (Corresponding author)
2 Paris I Panthéon-Sorbonne University. Labex Régulation Financière (Réfi). Email: salim.dehmej@univ-paris1.fr
We thank Jézabel Couppey-Soubeyran, Thibaut Duprey, Faith Witryol, Michel Crinetz, Nicolas Véron, Martien Lubberink, Christophe Boucher, Stefanie Schulte and participants of the conference « Les nouvelles approches du risque systémique » at Besançon and at the conference of Labex ReFi, for helpful discussions and comments. We remain responsible for any errors and omissions. All data are available upon request.
This work was achieved through the Laboratory of Excellence on Financial Regulation (Labex ReFi) supported by PRES heSam under the reference ANR-10-LABX-0095. It benefitted from a French government support managed by the National Research Agency (ANR) within the project Investissements d'Avenir Paris Nouveaux Mondes (investments for the future Paris-New Worlds) under the reference ANR-11-IDEX-0006-02.
Section 1. Introduction
On 4 November 2014, the European Central Bank became the new micro-prudential supervisor within the framework of the Single Supervisory Mechanism (SSM), the first pillar of the banking union3. A few days earlier, on 26 October, the results of a comprehensive assessment of 130
eurozone banks were published, constituting a preliminary step in the ECB's new mission. This assessment4 was based on an Assets Quality Review (AQR), backed-up by a stress test conducted
jointly with the European Banking Authority (EBA). Stress tests are among the post-crisis regulatory framework and are used to both microprudential supervision of individual firms and macroprudential assessments of financial imbalances. The Banks’ balance sheets were subjected to macro-economic scenarios, one considered as “baseline” and based on the European Commission's forecasts from early 2014, and the other as “stressed”, representing worsening European economic conditions.
The exercise revealed a capital shortfall of €25 billion for 25 of the 130 assessed banks, on the basis their balance sheets at the end of 2013. Given the recapitalisation already implemented for most of these banks in 2014, in the end only 8 banks5 were required to raise €6 billion of capital over a
period of 6 to 9 months. Failed banks had to submit recapitalisation plans and were mainly concentrated in Italy with 4 banks over 8. None of the major European banks failed the test and especially no banks from the “core” of the Eurozone (Germany, Belgium, Netherlands and France) failed either, resulting in high praise for the European universal banking model. Overall, no surprise or worrying situation was announced. Sahin and de Haan (2015) highlight that banks’ stock market prices and CDS spreads did not react to the results. One should recognize however that it is a time consuming and highly complex exercise since the ECB faces a dilemma of requiring severity in order to be credible, but not to excess, in order to avoid potential destabilisation of financial markets.
Nevertheless, concluding to the soundness of European banks would be a mistake.
First, the assumptions on which the stress tests were based resulted in mild scenarios and requirements. Unlike the Fed and BoE stress tests, ECB stress test and communication about its results was restricted to the risk-weighted capital ratio, whereas the leverage ratio (“Tier 1” capital - T1, to non-weighted assets) paints a more varied picture. Our calculations of a stressed leverage ratio of 3% show a capital shortfall of €13 billion Tier1 capital, in 2015. However, if consider a 4% ratio, which will be the case in many countries (see section 3 on leverage), we find an important shortfall estimate at €88 billion Tier1 capital, in 2015.
Second, as mentioned by the ECB this exercise suffers from a problem of comparability between banks (different risk models) but also between countries (more than 150 different supervisory options and discretions applied by national regulators, such for example concerning provisions and non-performing loans). Additionally, the risk-weighted capital ratio cannot be taken literally, because its scope is evolving over the next four years during the transition to fully loaded Basel III
3 The banking union is based on three founding pillars: a single supervision, a resolution mechanism and deposit
guarantee schemes. See Véron and Wolff (2013).
4 The comprehensive assessment was conducted not only by the ECB but also by the consultancy firm Oliver Wyman. 5 Of the 25 banks listed by the ECB, 12 already raised sufficient capital during 2014, and of the 13 remaining, 5 are in
requirements since many elements considered until now as equity will disappear (intangible assets and deferred tax assets for example). Furthermore all countries don’t keep the same pace of implementation. If we consider now the final deductions of equity, banks need €130 billion to keep the same level of capital CET1.
Third, when transposing the Basel committee recommendations into European law, the EU selected a zero risk weight coefficient for all sovereign debt securities of European Union countries while Basel regulation offered this possibility only for those considered as risk-free. An application of Basel risk weights for sovereign debt leads to a capital shortfall of €34 billion.
Finally, banks succeed generally to meet the risk weighted capital requirement by rising capital, deleveraging or rebalancing portfolios towards sovereign debt. However, if raising capital is the optimal solution for the regulator, it not the case for the bank. Furthermore, the changing environment illustrated by weak profitability, tightening regulation and even, for some banks, costly lawsuits due to misconducts, makes raising capital quite challenging.
This article continues as follows: section 2 evaluates soundness of the results of the AQR and stress tests; section 3 assess eurozone banks’ capital requirements according to the regulatory evolution and section 4 discusses the eurozone banks’ ability to meet those capital requirements. Section 5 concludes.
Section 2. Assessing banking system soundness through AQR and stress-tests
2.1. Size of assets as primary selection criterion
The 1306 banks that participated to the comprehensive assessment undertaken by the ECB were
selected according to the same criteria as for the SSM (ECB, 2014), namely:
An asset value exceeding €30 billion.
A size exceeding 20% of national GDP, except for banks smaller than €5 billion.
Being part of the 3 largest credit institutions in a country participating in the SSM.
Having received European financial subsidies.
The size of the institutions is clearly the main criterion for this sample, and as emphasised by Drehmann and Tarashev (2011), a relatively large size goes hand in hand with increased complexity, denser financial links and a sufficient market share to trigger asset fire sales (AFS) in the event of financial difficulties (Arnould and Dehmej, 2013). Since 2011, the BIS has developed a scoring system for identifying systemically important banks7 (G-SIB). This combines 5 criteria (BCBS,
2014a): size, interconnections, substitutability, international activities and complexity. Moreover, the Federal Reserve has recently added a sixth criterion by including the reliance on short-term
6 The ECB comprehensive assessment included more banks than for the SSM (120), since several banks close to but
below the threshold criteria and not included in the SSM were reviewed nevertheless. See part 3 and annexe 9.1 (ECB, 2014).
7 The Financial Stability Board (FSB) adopts the BIS methodology to identify G-SIBs, numbering 30 in 2014, of which
funding (Fed 2014a). Indeed, size is not sufficient to address the multiple systemic risk dimensions of financial institutions - as recently demonstrated by the problems of relatively small Spanish and German regional banks (respectively CajaSur in 2010 and Sachsen LB in 2007). Moreover, Switzerland has recently decided to classify the Raiffeisenbank Schweiz Genossenschaft as systemic at domestic level, to the extent that its activities are considered to be difficult to substitute in the Swiss banking system in case of bankruptcy, yet the size of its balance sheet is just €28 billion (compared for example with the €880 billion assets of UBS).
2.2. Unambitious methodological choices
As reminded by the ECB, stress tests are not used to predict future events, but to evaluate the banks’ capacity to withstand deteriorating economic and financial conditions. Recent stress tests are relatively more rigorous than those performed by the Committee of European Banking Supervisors (CEBS) in 2010 and by the EBA in 2011 (a larger number of banks, more rigorous scenarios and a longer time-scale). In addition, ECB capital requirements8 (8% for the baseline and
5.5% for the severe case) are tougher than those of the Fed (5%) and BoE9 (7% for the baseline
and 4.5% for the severe case). Nevertheless, they are less ambitious than those conducted in the United States since 2009 and in UK in many aspects.
The scenarios used in US stress tests are more severe (Table 1), and refer to dynamic bank balance sheets which may be adjusted during the tests in accordance with changes in the risk profiles. Systemic institutions referred to as “too big to fail”, “too costly to save” or “too complex to resolve” are distinguished from other banks and must satisfy stricter capital requirements. Finally, the assessment is not limited to the risk-weighted capital ratio but includes the stressed leverage ratio and qualitative aspects such as the pertinence of internal risk models, governance and recapitalisation plans (Fed, 2014b). If banks fail the tests they may be denied permission to distribute dividends or to repurchase shares until they are recapitalised (Hirtle and Lehnert, 2014). Finally, the UK stress test, conducted at the end of 2014, incorporated a monetary policy exit scenario by increasing the main interest rate by 4% over two years, to evaluate how banks would withstand risks stemming from increased defaulting on real estate loans10 (BoE, 2014).
8 CET1/RWA. See section 3 for details.
9 However, Fed and BoE stress tests are based also on a leverage ratio (3%).
10 Since variable rate mortgage debt is estimated at 68% of the real estate market, the latter is extremely sensitive to
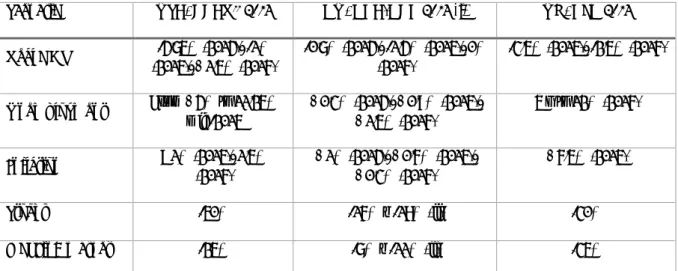
Table 1 Comparison of the severity of stress tests’ scenarios
Scenario USA, CCAR11 2014 EU, EBA-ECB 2014 (i) UK, BoE 2014
Real GDP (2015), +1.5% (2016) -4.75% (2014), -1% -0.7% (2014), -1.4% (2015), 0% (2016) -3.5% (2015), -2.5% (2016) Unemployment From +4% to 11.25% mid-2015 +0.3% (2014), +0.9% (2015), +1.5% (2016) Up to 12% (2016) Inflation <1% (2015), 1.5% (2016) +1% (2014), +0.6% (2015), +0.3% (2016) +6.5% (2015) Stocks -50% -16% à -18% (ii) -30%
Housing market -25% -7% à -11% (ii) -35%
Source: Fed (2013), ESRB (2014) and BoE (2014a). (i): average for the Eurozone (ii): average of scenarios for 2014 and 2016.
The main critics addressed to the ECB exercise were about the severity of the scenarios, such as the absence of deflation or of a major shock on the sovereign debt market. It should also be noted that the transposition of macro-economic scenarios into losses for each bank was calculated through a risk assessment model specific to each institution, ultimately limiting the comparability of the level of losses between banks and the reliability of results - as the error of the British bank RBS, revealed in November 2014, reminded it. In fact, a few weeks after the announcement of the EBA results, RBS declared it had been mistaken when calculating the data communicated to the EBA: its final risk-weighted capital ratio fell consequently from 6.7% to 5.7%, just 0.2 percent above the floor of 5.5%. It is also and above all, the purely micro-prudential nature of this test which poses a problem. By definition, it excludes the systemic aspect of a shock. Second-round effects are disregarded since the banks' balance sheets are static over the exercise. Furthermore, these scenarios are non-systemic as they applied to a bank as if it was isolated from the rest of the financial sector. As such, the scenarios fail to inform macro-prudential policymakers. The 2008 financial crisis clearly illustrated the extent of contagion effects on market liquidity and during the assets fire sales.
Moreover, these stress tests barely address liability-related vulnerability, notably regarding the financing structure of banks and the liquidity of its resources (cf. the freezing of the inter-bank market following the collapse of Lehman Brothers, or the one of Northern Rock and Dexia and their difficulties in refinancing themselves on short-term markets). An assessment of liquidity ratios such as those planned in the Basel III framework (LCR12 short-term ratios and NSFR13 long-term
ratios), incentivising banks to make use of more stable resources would have been welcomed. Since 2012, the Federal Reserve has been conducting a confidential liquidity analysis “CLAR -
Comprehensive Liquidity Analysis and Review”, testing the capacity of the major banks to withstand
liquidity disruption (Elliott, 2014). More generally, a review of the stability of bank funding appears
11 Comprehensive Capital Analysis and Review.
12 The “Liquidity Coverage Ratio” enters into force in 2015, and requires that over a period of 30 days bank’s liquidity
reserves must be higher than the leakage caused by the loss of access to short term market and the flight of deposits. See Appendix.
13 Work on establishing the “Net Stable Funding Ratio” will start in 2018. It stipulates that over a period of one year,
necessary. The dependency on wholesale funding, (market short-term funding) in particular, has become extremely significant (IMF, 2013). This causes banks to be highly sensitive to a liquidity shock. In the UK, the Prudential Regulation Authority’s (PRA’s) has the supervisory role to examine liquidity and funding risks (PRA, 2015). In their stress testing banks should consider the impact of a range of severe but plausible stress scenarios on their cash flows, liquidity resources, profitability, solvency, asset encumbrance and survival horizon. An ECB’s Liability Quality Review (LQR) would seem essential.
Yet the stress test conducted by the ECB is by far the most comprehensive up to now because it expands the number of banks involved. And although it is difficult to compare the capital requirements for the particularly severe US stress test, conducted in 2009 just after the crisis, with the one performed by the ECB five years later, the amounts are highly comparable with the EBA stress test of 2011, despite an increase of almost 50% in the number of banks (Table 2).
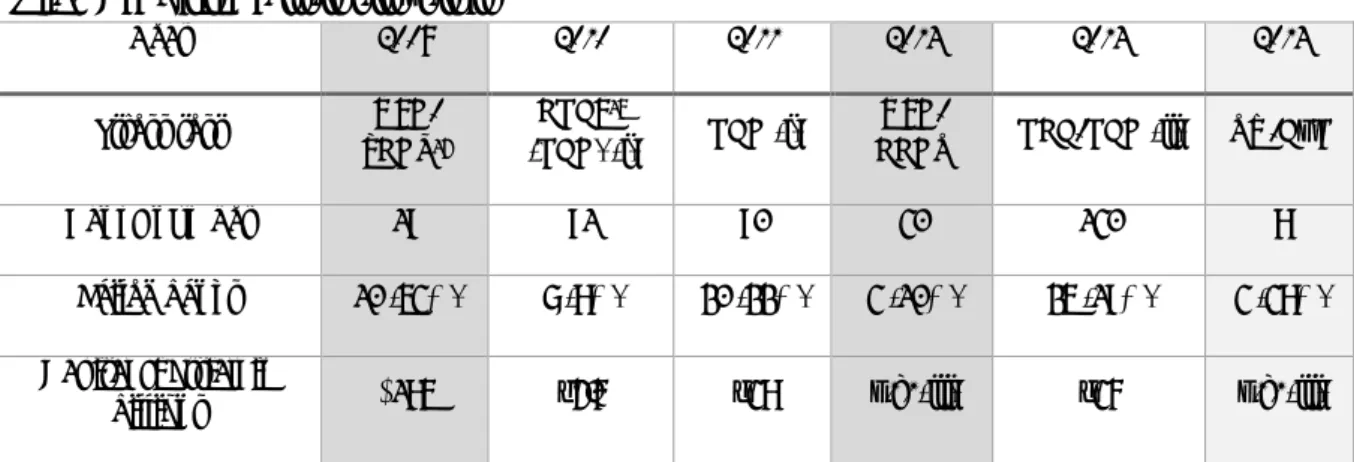
Table 2 Comparison of stress tests’ results
Year 2009 2010 2011 2014 2014 2014
Stress test
USA-SCAP14
CEBS15
(EBA) (i) EBA (i)
USA-CCAR ECB-EBA (ii) RU-BoE
Banks number 19 91 90 30 130 8
Failed banks 10 (53%) 7 (8%) 20 (22%) 3 (10%) 25 (19%) 3 (38%)
Capital shortfall in
billions $185 €3.5 €27 n.a. (iii) €25 n.a. (iii)
Source: Fed (2009), CEBS (2010), EBA (2011), (Fed, 2014b), ECB (2014) and BoE (2014a). (i) EU banks, (ii) banks of Eurozone and of the European Union that want to join the banking union.
2.3. Comparability issues
Non-performing loans (NPL)
The AQR conducted by the ECB in 2014 pinpointed non-performing loans (NPL henceforth) that was not accurately assessed by banks. Indeed, €136 billion of NPL must be added to the €740 billion already declared by the banks (summing to €876 billion), denoting a significant increase of almost 20%. The most affected countries are Slovenia with 32%, followed by Greece, Malta and Estonia each with a 20% reclassification of their loans (ECB, 2014).
The October 2014 AQR study marked an upward revision of NPL indicates chronic overvaluation of the quality of assets by banks. The ECB report following the stress tests (ECB, 2014) emphasises that almost a third of audited banks were more lax than the ECB in the recognition of NPL. This assessment discrepancy was found even within so-called “level 1” assets, where 13% of banks disagreed with the ECB classification. Other differences were also brought to light by the AQR related to the number of days used to assess whether a debt is considered non-performing and to the date for constituting provisions for losses. The implication of the AQR results was that the lack
14 Supervisory Capital Assessment Program. 15 Committee of European Banking Supervisors.
of European harmonisation and possible indulgence of national supervisory bodies has hindered a rigorous assessment of risks.
Internal risk models
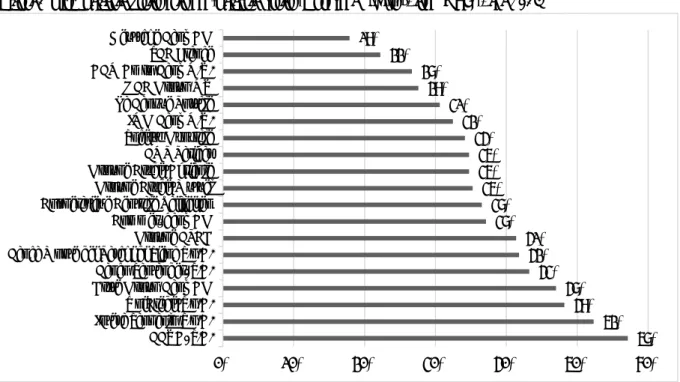
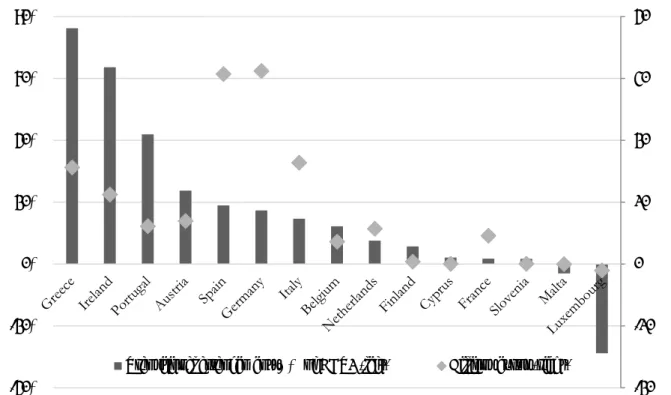
The statistics highlighted by the ECB during its presentation of stress tests results are related to risk-weighted capital ratio (“Common Equity Tier1” capital – CET1 to “Risk Weighted Assets” – RWA) outcomes. Contrary to the leverage ratio which does not discriminate between assets according to their degree of risk, the risk-weighted capital ratio allows, in theory, for the capital requirement to be adjusted according to the assumed risk of assets. However, the amount of weighted assets may vary significantly from the non-weighted amount (Figure 1). In the case of Deutsche Bank, for example, weighted assets account for only 18% of total assets, which substantially reduces the capital requirement. This discrepancy may be explained either by a more advantageous risk assessment methodology or by the holding of low capital-consuming assets.
Figure 1 Risk weighted assets over non-weighted assets (Eurozone SIFI’s16, from EBA), end 2013
Source: Authors, data from SNL, ECB- EBA.
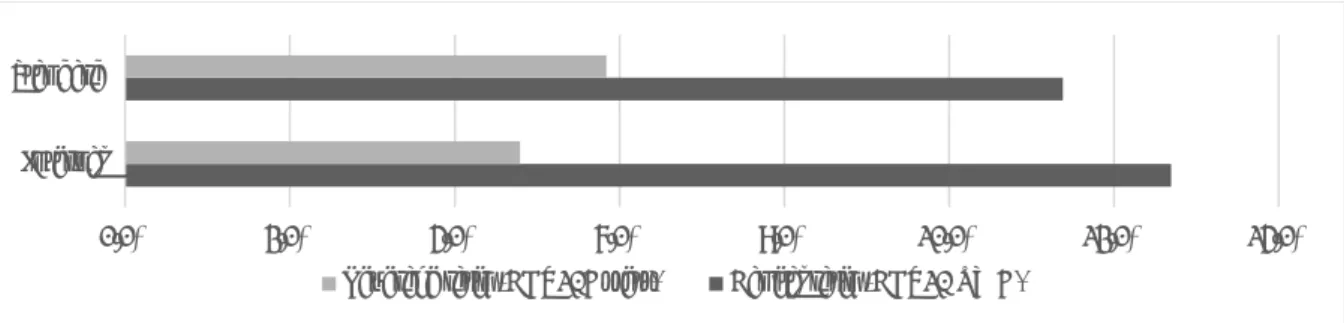
The risk assessment methodology submitted to the ECB may be developed either by the bank itself, with models estimated internally (so-called “Internal Rating Based” approach) or provided by the regulator (standard approach). In theory, the internal models allow a more accurate estimation of the risks and avoid strategies seeking investment yields from the highest risk assets for a given capital requirement. In practice, the difference between the risk-weighted capital ratio and the non-weighted ratio is significantly higher in the case of the internal rating based model (Figure 2), reflecting, inter alia, greater flexibility, or even gaming, when assessing risks (Le Leslé and Avramova, 2012).
16 Systemically Important Financial Institutions.
57% 52% 48% 47% 43% 42% 41% 37% 37% 35% 35% 35% 34% 32% 31% 28% 27% 22% 18% 0% 10% 20% 30% 40% 50% 60% BBVA, S.A. Intesa Sanpaolo S.p.A. UniCredit S.p.A. Erste Group Bank AG Banco Santander, S.A. Banca Monte dei Paschi di Siena S.p.A. Groupe BPCE Commerzbank AG Coöperatieve Centrale Raiffeisen Groupe Crédit Mutuel Groupe Crédit Agricole BNP Paribas Société Générale ING Bank N.V. La Banque Postale KBC Group NV ABN Amro Bank N.V. HSBC France Deutsche Bank AG
Figure 2 Regulatory ratios and risk evaluation methodology, end 2013
Source: Authors, data from SNL, ECB-EBA. Data available only for 82 banks over 130 of AQR. We merged the IRB (« foundation » and « advanced ») and the mixed approaches into the internal approach.
Capital shortfalls report by banks were all computed through their own risk model, meaning that with the same inputs of the economic scenarios, results, as of capital shortfall, that come out this black box are barely comparable.
Section 3. Eurozone banks capital requirements according to regulatory
timeline
The most frequently drawn conclusion from the stress test results is that the European banking sector is once again in good health. Almost all French and German banks passed the tests with flying colours: they maintained their risk-weighted ratios above 8% for the baseline scenario and 5.5% for the stressed one. Using data provided by the EBA, we can draw our own assessment of eurozone banks’ fragility and capital requirements on a 5 year horizon (2019). We mainly rely on 101 common banks of the ECB and EBA database from 15 countries that represent the majority of banks from the eurozone17 (see table C in the appendix) and build a recapitalization trajectory
from 2014 to 2019 based on regulation implementation plans and potential new evolutions.
3.1. Basel III phase-in and capital constraints
The Basel III agreements, signed in 2010, plan a transitional phase prior to the full and total application of the new requirements comprising an increase of capital ratio and a narrowed definition of capital (see table A in the appendix)18. Scheduled between 2014 and 2019 this timeline
is also incorporated in the CRR/CRD4 legislation.
The transition from Basel II to Basel III is notably characterised by an improved quality of equity (CET1) and an increase in related deductions. More specifically, intangible assets (including “goodwill”) are now 100% deducted from CET119. Equity participations in other financial entities
are now consolidated to avoid any double counting and, if they exceed 10%, are deducted from CET1. Finally, deferred taxes have been withdrawn from CET1 scope, whereas unrealised profits in the portfolio of assets available for sale have been added (BIS, 2011). The timetable for
17 This induces the absence of banks from Estonia, Denmark, Lithuania, Poland, Sweden, Slovakia, Norway, Hungary
and United-Kingdom. But the total assets of those 101 banks represent €20.4 trillion compare to the €22 trillion of the banks of the CA.
18 Cecchetti (2015) declared “Putting this all together, we find that if we were to use the Basel III capital and asset
definitions, the Basel II requirement of 4 percent would in fact be something between 1/2 percent and 3/4 percent. As the authorities were fond of saying, Basel III increased capital requirements by a factor of 10”
19 Under Basel II, intangible assets, including goodwill, were deducted at 50% from Tier1 and 50% from Tier2.
0,0% 2,0% 4,0% 6,0% 8,0% 10,0% 12,0% 14,0%
Internal Standard
application of Basel III in Europe provides for a gradual increase in deductions and the inclusion of the new elements of CET1 (see table A in the appendix). Only the floor level is binding and if States so wish, they can apply final requirements in advance.
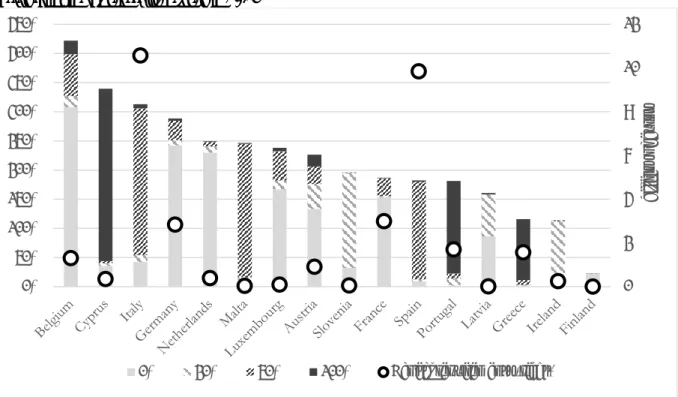
National supervisory authorities are not all at the same stage (ECB, 2014). Whereas the majority of States apply floor thresholds (for example 20% in 2014), others have acted in advance, such as Luxembourg, for instance, which already applies a rate close to 100%. Ultimately, banks in various EU countries do not have the same constraints in terms of capital, and the stress test was carried out without seeking to correct these differences. The only harmonisation measure adopted was to refrain from applying facilities granted by national supervisory authorities to their banks, which allow them to, for example, include in their accounts subsidies granted but not yet paid. Although these differences are due to be resolved by 2018, in the interim period, all eurozone banks are not singing from the same hymnal. The lack of harmonisation gives them margins for regulatory arbitrage. The effects of the transitional phase also depend on the composition of the capital held by each bank. The two main items which must be deducted from CET1, as part of the changeover to Basel III, are intangible assets and deferred taxes which can represent a significant proportion of CET1.
Figure 3 Transitional arrangements (deferred taxes and intangible assets) to disappear by 2018, end 2013
Source: Authors, EBA. The case of Luxembourg and Malta, is due to the new inclusion of unrealized gains in the portfolio of assets, which exceed the assets deducted from CET1.
Transitional arrangement figures are directly available from EBA data. Greece is in the lead with almost 80% of the CET1 of its banks (Figure 3), which will disappear by 2018 due to the end of the phase-in period for transitional arrangements (see table A in the appendix). In addition, German and Spanish banks whose solidity was much boasted about after the stress tests, have the greatest capital requirement, estimated at €30 billion each by 2018. In total, by 2018 the banks must raise more than €130 billion of CET1 (approximately 10% of their CET1 in 2013).
-20 -10 0 10 20 30 40 -40% -20% 0% 20% 40% 60% 80%
3.2. Sovereign debt treatment
Contrary to the spirit of the Basel regulations (since Basel II), at least for the standard approach20
(BCBS, 2014b) which does not tolerate a nil weighting coefficient except for securities considered risk-free (AAA to AA-), when transposing the Basel committee recommendations into European law21, the EU selected a nil coefficient for all sovereign debt securities of European Union countries
(Nouy, 2012). Furthermore, the risk-weighting rarely evolves in relation to risk (cf. the recent tensions on sovereign debt). The banks' pattern of holding of assets which consume less capital also allows the reduction of RWAs in relation to total assets. Banks can therefore perform regulatory arbitrage (Figure 4) in favour of highly lucrative sovereign debt securities, notably for peripheral countries, which are not expensive in terms of capital but nonetheless reflect a range of risks. Overall, our calculations show that the exposure of European banks to sovereign debt securities represents 280% of CET122. We estimated that the application of the Basel III
recommended weights would constrain European Union banks to raise €34 billion of capital in 201423 (Figure 4).
Figure 4 Eurozone banks’ sovereign exposition to other eurozone countries (% of CET1) by risk weights and capital needs following Basel III standards in 2014
Source: Authors, data from SNL, ECB-EBA. Data available for 123 banks from EBA ; countries with sovereign rating, long term in local money, end 2013, between AAA et AA- are weighted at 0%, those between A+ and A- at 20%, those between BBB+ and BBB- at 50% and finally those between BB+ and B- at 100% (Nouy, 2012).
20 The IRB approach allows banks to carry out an internal risk assessment of their exposure or to rely on rating agency
scoring. It has been established that the banks use very low coefficients, around 1.4% (Korte and Steffen, 2014), and all the more so as there is no floor on the probability of default on sovereign debt securities contrary to other forms of exposure and they are allowed to switch to the standard approach when assessing sovereign debt securities (partial use).
21 Capital Requirement Regulation (CRR) and Capital Requirement Directive 4, (CRD4). 22 Exposures are calculated on the basis of data provided by the EBA (EBA, 2014).
23 Up to €45 billion in capital, of which €29 million of CET1 in 2018 due to the increase of capital ratios (see table A
in the appendix) 0 2 4 6 8 10 12 0% 50% 100% 150% 200% 250% 300% 350% 400% 450% billio ns o f eu ro s
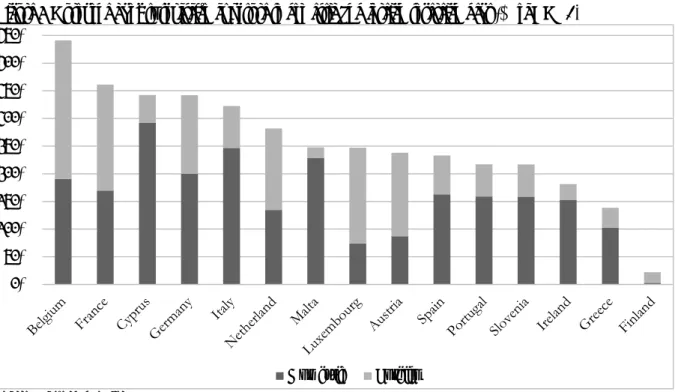
This arbitrage is manifested as a financing facility for States but can reduce the resources available for the private sector, notably SMEs, which find it difficult to obtain finance on the markets (crowding out effect, Brone et al. 2014). In addition, it favours the significant exposure of banks to domestic or foreign sovereign debt securities (Figure 5).
Figure 5 Eurozone banks’ sovereign exposure to domestic and foreign sovereign debt (% of CET1)
Source: Authors, data from SNL, ECB-EBA
Especially banks of the southern countries (Italy, Spain, Portugal, Greece, and Cyprus) are greatly exposed to the domestic debt, making them vulnerable to losses in the event of a debt crisis in those States and potentially compelling their governments to support them, fuelling the vicious circle between banks’ balance sheet and domestic bonds’ rates. An additional risk is that increased financial integration in Europe will concurrently increase the risk of contagion. Banks from Belgium, Austria or Luxembourg hold a great deal of foreign sovereign bonds.
Although Basel III introduces an incremental risk charge on the trading book which is assumed to take into consideration the risk of default and a change in the rating of trading positions (including sovereign debt), it rather favours the retention of sovereign debt. In recent years, sovereign debt falls within the category of the most liquid "level 1" 24 assets, through the liquidity ratio. Finally,
sovereign debts are included in assets which may be held without any cap in the framework of Basel III (BCBS, 2014c). If a limit on holding sovereign debt was set at 25% of capital, more than €1.1 trillion of debt held by European banks would have to change hands (Fitch, 2014).
3.3. The leverage ratio
The risk-weighted capital ratio indicated in 2007-2009 that the major American and European banks were sufficiently capitalised, whereas, several of them failed (Lehman Brothers in 2008) or had to be rescued (Northern Rock in 2007). Studies such as Haldane and Madouros (2012) indicate
24 The assets are ranked into three categories according to the ease of allocating a price, the first level being the most
liquid assets, i.e. those which can most easily be priced directly on the market. 0% 50% 100% 150% 200% 250% 300% 350% 400% 450% Domestic Foreign
that the risk-weighted capital ratio discriminated only marginally between banks in difficulty and more healthy ones. Pagano et al. (2014) indicates that using the leverage ratio, banks had actually very little capital compare to their total of assets. In 2011, for example, Dexia had a risk-weighted capital ratio of 10.4% during the EBA stress test (for a requirement of 5%) whereas its leverage ratio was 1.34%. On the whole, the risk-weighted ratio tends to underestimate risks during the ascending phase of the cycle leading to an artificial increase of the risk-weighted capital ratio. Although the leverage ratio was not disclosed in the results of the stress tests, it can be calculated on the basis of public data made available by ECB and EBA, using T1 capital and total exposures. The level of capital (T1) is given by EBA for each date of the whole stress-test period, 2014-2016 and for both the baseline and the adverse scenario (EBA, 2014). In addition, we take in account the capital raised by banks during 2014 (see table B in the appendix), using data made available by the ECB (ECB, 2014) and the transitional arrangements as given by the EBA (EBA, 2014). The total assets, as defined by article 429 of CRR for « Leverage Exposure », are provided by the ECB for the end of 2013 (ante-AQR). Since the stress tests are static (see Section 2), we can make the assumption of fixed total assets for the whole test period. The leverage ratio can thus be measured throughout the entire test period for the 101 banks common to the ECB and EBA samples. We calculate capital shortfall using stressed leverage ratio (Table 3), and show that for the 3% threshold of leverage, if capital shortfall are low in 201525, they are not to be neglected in 2018.
This increase is mainly due to the end of transitional arrangements (see Section 3.1) and leads to a shortfall of €67 billion. It is also worth noting that recapitalisation requirements literally explode when the ratio increases from 3% to 4%26. A potential increase of leverage ratio is not an unrealistic
hypothesis since the United Kingdom27 and the United States28 have both planned to increase this
ratio in comparable proportions during next years, along with Switzerland and the Netherlands, rendering an amendment of this ratio by the Basel Committee quite probable. A study by Steffen and Acharya (2014), using data from the end of 2013 and imposing a leverage requirement of 4%, consider that more than €85 billion would have to be raised by 109 European banks and €373 billion using the systemic risk measure known as the SRISK29 (Brownlees and Engle, 2015).
25 Notice that the leverage ratio came into force only in 2015, see table A in the appendix
26 Haldane (2012) considers that a ratio of at least 7% for systemic entities is required for financial stability. On this
issue, 20 renowned economists, including Nobel prize-winners, have expressed a wish to increase the leverage ratio to 15% in an article published in the Financial Times (“Healthy Banking System is the Goal, not Profitable Banks”, November 9, 2010).
27 The basic leverage remains at 3% as provided by Basel III. But, it is supplemented by capital buffers and may increase
up to 4.95% in the ascending phase of the economic cycle for systemic banks by 2018 (BoE, 2014b).
28 Leverage ratio increased to 5% for major American banks, and even 6% for those participating in the deposit
insurance system (BoE, 2014b). Nevertheless, the European accounting standards (IFRS) are more rigorous than those in the United States (GAAP) (Brei and Gambacorta, 2014) and the American ratio of 6% is equivalent to approximately 4% of the European ratio.
29 This measurement of risk is based on the evolution of the bank’s capital, at the market price, during a period of
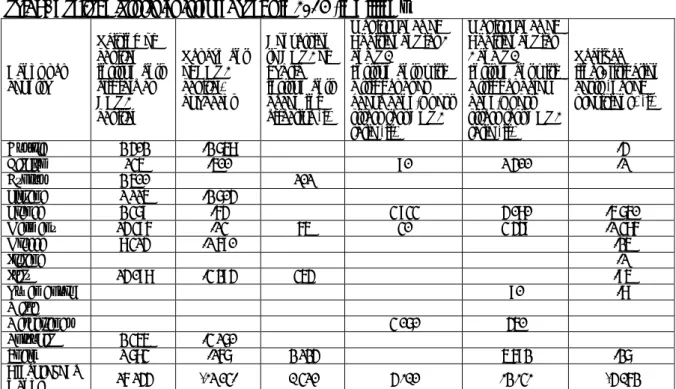
Table 3 Capital shortfall in 2015 and 2018 under several stressed leverage thresholds (billions €)
Pays
2015 (as of 1st January) 2018 (as of 1st January) (i)
Baseline Adverse Adverse Baseline Adverse Adverse
-3% -3% -4% -3% -3% -4% Austria 0 0 -0,3 -0,1 -3,4 -7,4 Belgium 0 -1,0 -3,4 -0,7 -3,4 -8,4 Cyprus 0 0 0 0 0 0 Finland 0 0 0 0 0 -0,7 France -2,0 -2,1 -32,4 -2,1 -5,6 -56,0 Germany -0,5 -2,6 -21,6 -2,3 -11,0 -49,2 Greece 0 -0,1 -1,8 -4,1 -15,7 -19,3 Ireland 0 -0,5 -1,0 -3,1 -10,8 -14,0 Italy 0 -3,1 -7,2 0 -8,7 -18,3 Luxembourg 0 0 0 0 0 -0,1 Malta 0 0 0 0 0 0 Netherland -1,7 -3,1 -17,6 -1,6 -5,1 -24,1 Portugal 0 -0,2 -1,1 0 -2,7 -5,1 Slovenia 0 0 -0,1 0 -0,2 -0,4 Spain 0 -0,4 -1,2 0 -0,6 -10,5 Total -4,3 -13,1 -87,7 -13,9 -67,2 -213,6
Source: Authors, SNL, data from ECB-EBA. Leverage ratio is based on 101 banks in common on both ECB and EBA samples. It is calculated by dividing the sum of CET1 and additional Tier1 (from the baseline or the adverse scenario), all provided by the EBA, by the total assets as defined by article 429 of CRR for « Leverage Exposure » communicated by ECB, end 2013. We also take in account the additional CET1 and T1 that have been raised in 2014. (i) We use data from 2016 scenarios and we apply on CET1 a complete deduction of transitional arrangements following Basel III phase-in (see table A in the appendix).
Predominantly, some banks of the “core” of Europe (France, Germany and Netherlands) record the greatest discrepancies between the 3% leverage threshold and the 4%, meaning that they are contenting themselves with the legal minimum regulatory capital and their risk-weighted capital ratios. Italian banks, although branded as the black sheep of the Eurozone, are far behind the leading duo of French and German banks. By over-emphasising the risk-weighted capital ratio, the ECB has drawn overly-optimistic conclusions while dismissing a significant proportion of the underlying risks and leaving major banks free to assess risks on their own with wide latitude.
Section 4. Eurozone banks’ ability to meet capital requirements
4.1. Raising capital ratios by deleveraging
In theory, banks can adjust their capital ratio in three ways: 1- they can increase their capital by issuing new securities (shares or hybrid securities) or retaining a larger proportion of their profits; 2- they can adjust the size of their asset (financial securities or loans) or 3- they can reallocate their portfolio in favour of assets that consume less capital (e.g. sovereign debt).
In general, banks prefer the second option so as to avoid issuing new shares or retaining profits, both of which could be detrimental to their shareholders. They favour debt to the detriment of
equity, given the more advantageous tax regime and the implicit government guarantee (Admati and Hellwig, 2013; IMF, 2014). The regulator would prefer the first option in order to avoid a contraction in the financing of the economy. The regulator would also prefer to prevent widespread sales of assets which would - should the banks reduce their debts simultaneously30 - result in a
deflationary spiral in the price of assets (Greenlaw et al, 2012). Still, if banks adjust their assets, an economy financed mainly through banking intermediation, as is the case in the eurozone with 74% of credit intermediation provided by the banking system (Goldstein and Véron, 2011), would suffer less from deleveraging through the sale of financial assets than from restricting credit distribution. Another possible solution for fragile institutions would be a merger/acquisition operation. The results of the stress tests will probably bring about a consolidation of the banking system in certain countries such as Italy or Austria, comparable to the one embarked on by Spain since 2010. In practice, Bologna and co-authors (2014) consider that between the end of 2011 and mid-2013 in Europe, the capital ratio was adjusted by a 9.6% increase in equity capital and a reduction in assets of 4.3% (including a reduction in financial assets other than sovereign debt and derivatives of 18.7% and of credit of 3.8%). However, the authors demonstrate that exposure to sovereign debt securities simultaneously increased by 68%. In the United States, by contrast, the capital ratio increases were achieved almost exclusively by a de facto capital increase (Schoenmaker and Peek, 2014). The Fed in fact demanded that recapitalisation requirements be implemented exclusively via this channel, something that was not stipulated by the EBA during its initial stress tests. The ECB does not have the same powers, but it has recently recommended that failed banks respect regulatory constraints of full Basel III should limit distribution of dividends and bonuses or even refrain from those distributions if they failed the stress-tests.
4.2. The scarcity of equity
Low profitability of eurozone banks
Combining structural weaknesses (e.g. high level of NPL as well as low interest rate environment which puts pressure on net interest margins (BIS, 2015)), evolution of competition (due to further financial integration and the development of e-banking), regulatory reforms and a grim macroeconomic environment raise many uncertainties on the profitability of the European banking sector31 and its capacity to build sufficient capital necessary to withstand adverse shocks. The IMF
(2012) highlighted that many European banks are modifying their business plans to address several weaknesses exposed by the financial crisis and reduce some activities becoming less profitable and requiring more regulatory buffers, as the selling by Deutsche Bank of its subsidiary Postbank illustrates it. A study by Morgan Stanley and Oliver Wyman32 shows this lower profitability with a
durable decline of return on equity (ROE) of investment bank over the last decade from 20% in early 2000’s to less than 10% recently. Similarly, an ECB’s study (2010) emphasises similar but less marked trend for universal banks.
30 Although a reduction in banking debt may be viable on an individual basis, the global impact could prove disastrous
(see the balance sheet recession described by Koo, 2011), hence the advantages of a macro-prudential approach to supervision (Borio et al, 2012).
31 Speech by Danièle Nouy, Chair of the Supervisory Board of the Single Supervisory Mechanism, at the Economic
Council in Berlin, 9 June 2015.
32 Morgan Stanley and Oliver Wyman, March 19, 2015, “Wholesale & Investment Banking Outlook. Liquidity
Dividend’s distribution
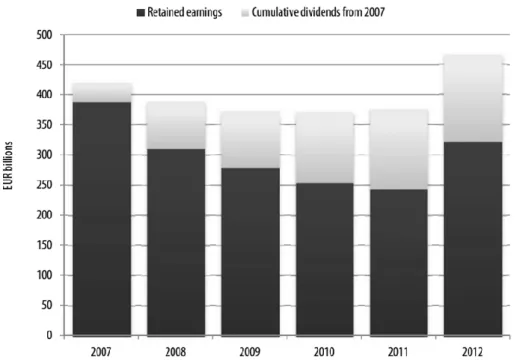
Unlike the Federal Reserve where failed banks are prohibited from distributing profits or buyback shares, the ECB does not have the same powers of coercion. Instead the ECB issued a recommendation that its banks limit dividend distributions. Shin (2015) considers distributing dividend or repurchasing shares as mechanisms whereby banks routinely dissipate their equity. He shows that, from 2007 to 2012, the six-year cumulated dividend distributions of €150 billion, accounted for fully 50% of the retained earnings of a euro area group of banks (Figure 6).
Figure 6 Dividend distribution of a group of 28 euro area banks
Source: Shin (2015). Bankscope, BIS calculations.
Table B in the appendix illustrates the repayment of CET1 and buyback by eurozone banks, per country, estimated at €14.3 billion in 2014 or almost 30% of the CET1 raised in 2014.
Fines
In addition to weak profitability, many banks are facing costly lawsuits linked to misconducts. We can distinguish between direct costs from fines and indirect costs from market valuation since banking stocks with legacy litigation risks have underperformed those without litigation33
(reputation and risk of hidden misconduct). Banks are facing many legacy litigation liabilities and expenses34. U.S. and European banks have paid out $190 billion and provisioned about $60 billion
in fines since 2009 for misconduct and further $72 billion of to be provisioned by 2017 simply from ongoing litigation35. EBA database highlights that, from January to September 2014, eurozone
banks incurred fines/litigation costs (net of provisions) of $7.3 billion (see Table B in the appendix for details per country). The equity banks can raise for incoming capital requirements is getting scarce, jeopardizing eurozone banks’ ability to meet capital requirement of the incoming years.
33 Credit Suisse, Equity Research Europe, 4 June 2014, “Litigation—more risk, less return”.
34 Manipulation and violation of rules range from: Libor, Forex, mortgages, insurance mis-selling, money-laundering
rules, violating U.S. sanctions and tax evasion.
35 Source: WSJ, 3 June 2015, “How Regulators Can Keep Bankers Honest” and Le Monde, 23 June 2015, “Depuis le
Section 5. Conclusion
The transfer of national diverse euro-area prerogatives to a supra-national institution at the ECB will result in improved comparability, enhanced control, and a level playing field. The work of the ECB on the AQR is a first step in this direction, but much work remains. Certainly, the deadlines imposed, the required human resources, and the absence on the European stage of a credible resolution mechanism sufficiently funded to overcome prospective vulnerabilities may continue to limit the ECB’s ambitions in the conduct of the “Comprehensive Assessment”. Fortunately, as this only the first stress test of the new single supervisory body, and hopefully that future ones36 will be
more complete. The US experience is instructive and it is regrettable that the ECB did not draw more inspiration therefrom. This exercise is all the more important for the eurozone since its financing structure is based primarily on banking intermediation.
As mentioned by the ECB, this exercise suffers not only from a problem of comparability between banks (different risk models) but also between countries (many discretions applied by national regulators, such for example the definition of non-performing loans). With regard to the risk-weighted capital ratio, the use of the finalised Basel III ratio is to be preferred in order to remove transitional arrangements which renders any comparison between two banks in two different countries almost impossible.
We found that, considering the transitional requirements as of the Basel III transitional phase, eurozone banks still have to raise €130 billion by 2018, in order to keep the same amount of CET1. We further estimated that if sovereign debt capital requirements of Basel III recommendations were applied to eurozone countries, and if eurozone banks wanted to keep the same amount of sovereign debt, they had to raise €45 billion of capital (of which €29 billion of CET1) by 2018. Finally if the 3% threshold for the leverage is quite well observed in the baseline scenario, it leads to capital shortfall in the case of the adverse scenario, especially in the hypothesis of an increase of the threshold to 4%.
Our calculations can be summarised into two scenarios: one with absolute figures of capital shortfall, using Basel III phase-in and corresponding transitional arrangements, and a second with probable scenarios of the evolution of bank regulation in Europe. The latter scenarios include implementation of Basel III capital requirements for eurozone countries sovereign debt (see Section 2.2), increase of the leverage threshold to 4%37 and a macro outcome of adverse scenario
for ECB’s stress tests. For the first scenario we measure a CET1 shortfall of €130 billion by 2018, and for the second we reach €214 billion of T1 capital (of which €68 billion of CET1). This second scenario figure is not the sum of the 3 sources of recapitalisation we introduced: since we increase the level of capital required (4% for the leverage), the requirements according to portfolio composition (sovereign debt) and the type of capital (transitional arrangements), some requirements offset one another.
36 The next stress test is planned in 2016.
37 It can be achieved through a real increase of the threshold, which we don’t consider so credible, or a redenomination
One thing is certain; reporting of stress tests’ result must not gloss over the limitations of this type of exercise. It is dangerous to harbour the illusion of financial security (Borio et al, 2012), and any result slack in efforts to restore banking sector soundness only increase the risk of a future crisis. Finally, banks succeed generally in meeting risk weighted capital requirement by rising capital, deleveraging, or by rebalancing portfolios towards sovereign debt. However, the low profitability of eurozone banks, their massive dividend distributions (between 30%-50%), their substantial current and prospective fines all give rise to concerns about their ability of eurozone banks to meet the incoming regulatory capital requirements.
Appendix
Table A. Calendar of Basel III implementation (1 January)
% 2014 2015 2016 2017 2018 2019 C ap it al CET1 4 4,5 4,5 4,5 4,5 4,5 Conservation buffer - - 0,625 1,25 1,875 2,5
Countercyclical buffer (i) - - 0,625 1,25 1,875 2,5
Systemic buffer (i) - - 0,625 1,25 1,875 2,5
Total - CET1 (ii) 4 4,5 5,125 - 6,375 5,75 - 8,25 6,375 - 10,125 7 - 12
Additional Tier1 1,5 1,5 1,5 1,5 1,5 1,5
Total - Tier1 (ii) 5,5 6 6,625 - 7,875 8,25 - 9,75 7,875 - 11,625 8,5 - 13,5
T2 1,5 2 2 2 2 2
Total - Capital (ii) 7 8 8,625 - 9,875 10,25 - 11,75 9,875 - 13,625 10,5 - 15,5
Leverage (iii) - 3 3 3 3 3
Deductions from CET1 20 40 60 80 100 100
L iq uid it y LCR - 60 70 80 90 100 NSFR - - - - Introduction -
Source: adapted from different documents of Basel committee. (i) Maximum buffer. (ii) Interval between minimum and maximum. (iii) Leverage ratio could be modified during the transition period.
Table B. Capital measures for eurozone banks in 2014 (in million €)
Banks per country Raising of capital instruments eligible as CET1 capital Repayment of CET1 capital, buybacks Conversion to CET1 of hybrid instruments becoming effective (i) Net issuance of Additional Tier 1 and T2 Instruments with a trigger at or above bank's post stress test CET1 ratio (ii) Net issuance of Additional Tier 1 and T2 Instrument with a trigger below bank's post stress test CET1 ratio (ii) Realized fines/litigation costs (net of provisions) (i) Austria 2 402 -2 758 -4 Belgium 135 -500 90 1 400 -1 Cyprus 2 500 101 Finland 1 115 -2 704 France 2 379 -64 3 933 4 080 -5 750 Germany 14 396 -13 65 30 3 449 -1 386 Greece 8 314 -1 690 -25 Ireland -1 Italy 14 098 -3 294 354 -95 Luxembourg 90 -8 Malta Netherlands 3 070 450 Portugal 2 355 -3 170 Spain 1 783 -167 2 124 5 692 -27 All eurozone Banks 49 477 -14 360 2 643 7 123 15 161 -7 295 Source: Authors, EBA (2014 EU-wide stress test database, capital measures). (i) From 1 January to 30 September 2014. (ii) In the adverse scenario during the stress test horizon.
Table C. list of 101 banks in common on both ECB and EBA samples
Austria Spain Italy
BAWAG P.S.K. Bank für Arbeit Banco Financiero y de Ahorros Banca Carige S.P.A.
Erste Group Bank AG Banco Bilbao Vizcaya Argentaria Banca Monte dei Paschi di Siena Österreichische Volksbanke Banco de Sabadell Banca Piccolo Credito Valtellinese Raiffeisen Zentralbank Österreich Banco Mare Nostrum Banca Popolare Dell'Emilia Romagna Raiffeisenlandesbank
Niederösterreich Banco Popular Español Banca Popolare Di Milano Raiffeisenlandesbank Oberösterreich Banco Santander Banca Popolare di Sondrio Belgium Bankinter Banca Popolare di Vicenza
AXA Bank Europe SA Caja de Ahorros y M.P. de Zaragoza Banco Popolare - Società Cooperativa Belfius Banque SA Caja de Ahorros y Pensiones de
Barcelona Credito Emiliano S.p.A.
Dexia NV Cajas Rurales Unidas Iccrea Holding S.p.A
KBC Group NV Catalunya Banc Intesa Sanpaolo S.p.A.
Cyprus Kutxabank Mediobanca - Banca di Credito Finanziario Bank of Cyprus Public Company Liberbank UniCredit S.p.A.
Co-operative Central Bank Ltd NCG Banco Unione Di Banche Italiane Società Cooperativa
Hellenic Bank Public Company Ltd Finland Veneto Banca S.C.P.A.
Germany OP-Pohjola Group Luxembourg
Aareal Bank AG France Banque et Caisse d'Epargne de l'Etat
Bayerische Landesbank Banque PSA Finance Precision Capital S.A.
Commerzbank AG BNP Paribas Latvia
DekaBank Deutsche Girozentrale BPI France ABLV Bank
Deutsche Apotheker- und Ärztebank eG
C.R.H. Malta
Deutsche Bank AG Groupe BPCE Bank of Valletta plc
DZ Bank AG Deutsche Zentral Groupe Crédit Agricole Netherlands
HASPA Finanzholding Groupe Crédit Mutuel ABN AMRO Bank N.V.
HSH Nordbank AG La Banque Postale Bank Nederlandse Gemeenten N.V.
Hypo Real Estate Holding AG RCI Banque Coöperatieve Centrale Raiffeisen IKB Deutsche Industriebank AG Société de Financement Local ING Bank N.V.
KfW IPEX-Bank GmbH Société Générale Nederlandse Waterschapsbank N.V.
Landesbank Baden-Württemberg Greece SNS Bank N.V.
Landesbank Berlin Holding AG Alpha Bank Portugal
Landesbank Hessen-Thüringen Eurobank Ergasias Banco BPI
Landeskreditbank Baden National Bank of Greece Banco Comercial Português Landwirtschaftliche Rentenbank Piraeus Bank Caixa Geral de Depósitos
Münchener Hypothekenbank eG Ireland Slovenia
Norddeutsche
Landesbank-Girozentrale Allied Irish Banks plc Nova Kreditna Banka Maribor d.d.
NRW.Bank Permanent tsb plc. Nova Ljubljanska banka d. d.
Volkswagen Financial Services AG Company of the Bank of Ireland SID - Slovenska izvozna in razvojna banka
WGZ Bank AG Westdeutsche
Wüstenrot Bank AG Pfandbriefbank
Bibliography
Acharya V. and Steffen S., 2014, “Falling short of expectations? Stress-testing the European banking system”, CEPS policy brief, No. 315, 15 January 2014
Admati A. and Hellwig M., 2013, “The Bankers’ New Clothes. What’s Wrong with Banking and What to Do about It? ” Princeton University Press, 2013, 416 p.
Arnould G. et Dehmej S., 2013, “Risque systémique et politique macroprudentielle”, », in « Les Systèmes financiers. Mutations, Crises et Régulation », sous la dir. de De Boissieu C. et Couppey-Soubeyran J., Economica, 4e Ed, 2013.
BCBS, 2014a, "The G-SIB assessment methodology – score calculation", BIS, November 2014 BCBS, 2014b, “Regulatory Consistency Assessment Programme (RCAP)-Assessment of Basel III
regulations – European Union”, BIS, December 2014
BCBS, 2014c, “Supervisory framework for measuring and controlling large exposures”, BIS, April BIS, 2011, “Basel III: A global regulatory framework for more resilient banks and banking
systems”, BIS, June 2011
BIS, 2015, “85th Annual Report”, Chapter 5 “Old and new risks in the financial landscape”, BIS, June 2015
Bisias D., Flood M., Lo A. and Valavanis S., 2012, "A Survey of Systemic Risk Analytics", Office of Financial Research, Working Paper 1, January 2012
BoE, 2014a, "Stress testing the UK banking system: key elements of the 2014 stress test", BoE, April 2014
BoE, 2014b, “The Financial Policy Committee’s review of the leverage ratio” Bank of England, October 2014
Bologna P., Caccavaio M. and Miglietta A., 2014, “EU bank deleveraging”, Bank of Italy, Occasional Papers, n. 235
Borio C., Drehmann M. and Tsatsaronis K., 2012, “Stress-testing macro stress testing: does it live up to expectations?” BIS Working Papers, No 369, January 2012
Brei and Gambacorta, 2014, "The leverage ratio over the cycle", BIS Working Papers No 471, November 2014
Brone F., Erce A., Martin A. and Ventura J., 2014, "Sovereign debt markets in turbulent times: Creditor discrimination and crowding-out effects", Journal of Monetary Economics 61
Brownlees C. and Engle R., 2015, “SRISK: A Conditional Capital Shortfall Index for Systemic Risk Measurement”, Available at SSRN: http://ssrn.com/abstract=1611229
CEBS, 2010, “Aggregate outcome of the 2010 EU wide stress test exercise coordinated by CEBS in cooperation with the ECB”, CEBS, 23 July 2010
Cecchetti S., 2015, “The Road to Financial Stability: Capital Regulation, Liquidity Regulation, and Resolution” International Journal of Central Banking, Vol. 11 No. 3, June 2015
Drehmann M. Tarashev N., 2011, “Measuring the Systemic Importance of Interconnected Banks”, BIS Working Paper No. 342
EBA, 2011, “European banking authority 2011 Eu-wide stress test aggregate report”, EBA, 15 July ECB, 2010, “Beyond ROE – how to measure bank performance", appendix to the report on EU
Banking structure, September 2010
ECB, 2014, "Aggregate report on the comprehensive assessment", October 2014
Elliott D. J., 2014, “Bank Liquidity Requirements: An Introduction and Overview” The Brookings Institution, June 23, 2014
ESRB, 2014, “EBA/SSM stress test: The macroeconomic adverse scenario”, ESRB, 17 April 2014 Fed, 2009,"The Supervisory Capital Assessment Program: Overview of Results" Board of
Governors of the Federal Reserve System, May 7, 2009
Fed, 2014a, "Risk-Based Capital Guidelines: Implementation of Capital Requirements for Global Systemically Important Bank Holding Companies", Federal Register Notice, 9 December 2014 Fed, 2014b, “CCAR 2014-Assessment Framework and Results” March 2014
Fitch, 2014, “Protecting Eurozone Banks from the Sovereigns”, Fitch Ratings, November 2014 Goldstein M. and Véron N., 2011, “Too Big to Fail: The Transatlantic Debate”, Working Paper
Series Peterson Institute, WP 11-2, January 2011
Greenlaw D., Kashyap A., Schoenholtz K. and Shin H., 2012, “Stressed Out: Macroprudential Principles for Stress Testing” Working Paper No. 71; Chicago Booth Paper No. 12-08
Haldane A., 2012, "The dog and the frisbee" Speech given at the Federal Reserve Bank of Kansas City’s 36th economic policy symposium, 31 August 2012
Hirtle B. and Lehnert A., 2014, “Supervisory Stress Tests” Federal Reserve Bank of New York Staff Reports, No. 696 November 2014
IMF, 2012, " Sovereigns, Banks, and Emerging Markets: Detailed Analysis and Policies", Chapter 2 IMF Global Financial Stability Report, April 2012
IMF, 2013, “Changes in bank funding patterns and financial stability risks”, Chapter 3, IMF Global Financial Stability Report, October 2013
IMF, 2014, "Moving From Liquidity-To Growth-Driven Markets", Chapter 3 IMF Global Financial Stability Report, April 2014
Koo R., 2011, “The world in balance sheet recession: causes, cure, and politics”, real-world economics review, issue no. 58, 12 December 2011, pp.19-37
Korte J., Steffen S., 2014, “Zero Risk Contagion - Banks' Sovereign Exposure and Sovereign Risk Spillovers” Working paper
Le Leslé V. and Avramova S., 2012, “Revisiting risk-weighted assets: why do RWAs differ across countries and what can be done about it?”, IMF working paper, 12/90
Nouy D, 2012, “Is sovereign risk properly addressed by financial regulation?” Banque de France, Financial Stability Review, No. 16, April 2012
Pagano M, V Acharya V., A Boot A., M Brunnermeier M., C Buch C., M Helwig M., S Langfield S., A Sapir A., and van den Burg L., 2014, “Is Europe Overbanked?”, ESRB, June 2014.
PRA, 2015, “The PRA’s approach to supervising liquidity and funding risks”, Supervisory Statement, SS24/15, June 2015
Sahin C., and de Haan J., 2015, "Market reactions to the ECB's Comprehensive Assessment," DNB Working Papers 463, Netherlands Central Bank, Research Department.
Schoenmaker D. and Peek T., 2014, “The State of the Banking Sector in Europe”, OECD Economics
Department Working Papers, No. 1102, OECD Publishing.
Shin H.S., 2015, “On book equity: why it matters for monetary policy” Speech at the joint workshop by the Basel Committee on Banking Supervision, the Centre for Economic Policy Research and the Journal of Financial Intermediation on "Banking and regulation: the next frontier", Basel, 22 January 2015.
Véron N. and Wolff G., 2013, “From supervision to resolution Next steps on the road to European banking union”, Bruegel Policy Contribution, No. 2013/04