HAL Id: hal-02148520
https://hal.archives-ouvertes.fr/hal-02148520
Submitted on 5 Jun 2019
HAL is a multi-disciplinary open access
archive for the deposit and dissemination of
sci-entific research documents, whether they are
pub-lished or not. The documents may come from
teaching and research institutions in France or
abroad, or from public or private research centers.
L’archive ouverte pluridisciplinaire HAL, est
destinée au dépôt et à la diffusion de documents
scientifiques de niveau recherche, publiés ou non,
émanant des établissements d’enseignement et de
recherche français ou étrangers, des laboratoires
publics ou privés.
Terahertz spectroscopy from air plasmas created by
two-color femtosecond laser pulses: The ALTESSE
project
L. Bergé, K. Kaltenecker, S. Engelbrecht, A Nguyen, Stefan Skupin, L Merlat,
B Fischer, B. Zhou, I. Thiele, P. Jepsen
To cite this version:
L. Bergé, K. Kaltenecker, S. Engelbrecht, A Nguyen, Stefan Skupin, et al.. Terahertz spectroscopy
from air plasmas created by two-color femtosecond laser pulses: The ALTESSE project. EPL -
Euro-physics Letters, European Physical Society/EDP Sciences/Società Italiana di Fisica/IOP Publishing,
2019, 126, pp.24001. �10.1209/0295-5075/126/24001�. �hal-02148520�
Terahertz spectroscopy from
air plasmas
created by two-color
femtosecond laser pulses: The ALTESSE project
L. Berg´e1, K. Kaltenecker2, S. Engelbrecht3, A. Nguyen1, S. Skupin4, L. Merlat3, B. Fischer3, B.
Zhou2, I. Thiele5 and P. U. Jepsen2 1 CEA, DAM, DIF - 91297 Arpajon - France
2 DTU Fotonik - Dept. Photonics Engineering, Technical University of Denmark, DK-2800 Kongens Lyngby, Denmark 3 Institut franco-allemand de recherches de Saint-Louis, 5 rue du G´en´eral Cassagnou, 68300 Saint-Louis - France 4 Institut Lumi`ere Mati`ere, UMR 5306 Universit´e Lyon 1 - CNRS, Universit´e de Lyon, 69622 Villeurbanne, France 5 Department of Physics, University of Gothenburg, SE-412 96 G¨oteborg, Sweden
PACS 42.65.Re– Ultrafast processes; optical pulse generation and pulse compression
PACS 32.80.Fb– Photoionization of atoms and ions
PACS 52.38.-r– Laser-plasma interactions
Abstract–Terahertz pulses are very popular because of their numerous applications, for example in security. Located between microwaves and optical waves in the electromagnetic spectrum, their spectral domain can now be exploited for molecular spectroscopy using terahertz emission from plasmas formed by femtosecond laser pulses ionizing gases such as air. Downconversion of broadband optical spectra in a plasma produces intense radiation suitable for the detection of suspect materials remotely. The different physical mechanisms involved to create terahertz radiation by laser-material interaction are reviewed. The new potentialities offered by intense lasers allow the acquisition of unique spectral signatures characterizing various materials.
Introduction. – Until the nineties, the domain of
ter-1
ahertz waves (THz), which extends between 100 GHz and
2
a few tens of THz in the electromagnetic spectrum (fig. 1),
3
was barely explored. This situation radically changed 30
4
years ago with the advent of the THz time domain
spec-5
troscopy (TDS) and its impact in all sectors of science
6
[1]. Terahertz spectroscopy has indeed become an
impor-7
tant tool for studying molecules in the condensed phase.
8
In particular, many chemical, biological, radiological,
nu-9
clear and explosive agents that represent warfare hazards
10
exhibit characteristic spectral features in this frequency
11
region, which has thus a strong potential for security
ap-12
plications [2–9]. Various materials such as paper, leather,
13
cotton and synthetic fabrics are transparent in the THz
14
frequency range, which is one of its main advantages for
15
scanning purposes. THz photons only excite free carriers,
16
optical phonons, vibrations and molecular rotations. They
17
have a relatively weak energy and the available THz-TDS
18
systems deliver low radiation power (< 1 mW), so that
19
they do not pose a health risk [11]. Besides homeland
se-20
curity, THz-TDS offers a wide range of applications (see
21
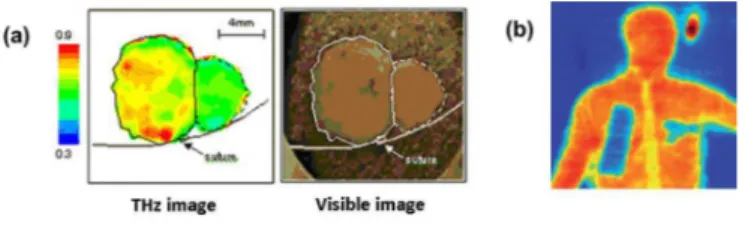
fig. 2). For instance, in medical imaging, THz radiation
22
provides good contrasts for detecting certain cancers [12].
23
Fig. 1: Terahertz domain in the electromagnetic spectrum.
It can also be used for the detection of greenhouse gases 24
and monitoring of flora [13]. However, because water is 25
opaque to THz waves, the current challenge in atmospheric 26
THz technology is to overcome the high absorption of am- 27
bient humidity, which can extinguish the THz radiation 28
over 1-m-long distances. There is thus a growing demand 29
for intense THz sources. An important requirement in 30
spectroscopy is also to cover large spectral bandwidths, in 31
order to collect as many molecular signatures as possible. 32
This Perspective article mainly focuses on THz spec- 33
troscopy applications employing laser-based coherent 34
sources anddetection techniques. After a review of laser- 35
L. Berg´e et al.
Fig. 2: (a) Terahertz imaging revealing epithelial can-cer (red areas), not detected in visible imaging (source: http://www.teraview.com). (b) THz image of an individual concealing suspicious objects under his clothes (Photo Arttu Luukanen, Millilab, Espoo, Finland).
sis is given to recent results obtained in the framework of
37
the French project ALTESSE devoted to the THz
spec-38
troscopy of powders, including explosives.
39
Terahertz transmitters and detectors: from
elec-40
tronics to lasers. – THz sources can be divided
41
into three categories [1, 14, 15]: Solid-state electronic
42
devices, quantum-cascade lasers (QCLs) and
optically-43
induced THz emitters. Electronic devices, e.g., Schottky
44
diodes [16, 17], usually emit weak and narrowband (< 3
45
THz) radiation. QCLs are unipolar devices where lasing
46
is achieved through intersubband transitions in stacks of
47
semiconductor quantum-well heterostructures [18,19].
Al-48
though they are frequency-tunable, their emitted pulses,
49
however, remain still narrowband within a few THz [20,
50
21]. Therefore, only sources of the last category are of
51
significant relevance for THz-TDS.
52
Optically-based THz emitters. The first
optically-53
induced emitters are photoconductive switches (PCS) that
54
consist of semiconductors equipped with a pair of
elec-55
trodes between which a high voltage is applied. A
fem-56
tosecond laser pulse creates electron-hole pairs in the
semi-57
conductor, producing a current flow between the
elec-58
trodes. Since the current is changing typically over one
59
picosecond, the electrodes act as THz-emitting
anten-60
nas [22]. In general, THz amplitudes cannot excess the
61
MV/m level and the energy yield saturates with the
62
laser pulse energy [23]. THz radiation broadened to
20-63
30 THz has been demonstrated by using low-temperature
64
grown GaAs or semi-insulating GaAs with ultrashort
65
pulses [24, 25]. Laser-to-THz conversion efficiency up to
66
∼ 2 × 10⁻² can be achieved [26], e.g., by means of
plas-67
monic electrodes, and quasi-single-cycle THz waveforms
68
with 10 µJ energy, 33 MV/m THz field strength have been
69
generated from ZnSe interdigited PCSs [27].
70
Other THz transmitters proceed from optical
rectifica-71
tion (OR) in nonlinear crystals [28]. Non-centrosymmetric
72
crystals exhibit a χ(2)-nonlinearity, proportional to the
73
square of the exciting laser field. Besides frequency
dou-74
bling, this nonlinearity leads to down-conversion towards
75
the THz range. Here, two-photon absorption and pump
76
depletion limits the THz yield [29], together with the
77
phase mismatch between the optical group velocity and
78
the phase velocity of the THz wave. ZnTe crystals [30] 79
can radiate below 3 THz and offer conversion efficiency 80
around 3 × 10⁻⁵ [30, 31]. As an alternative, LiNbO
3 crys- 81
tals have low THz absorption, higher nonlinear coefficients 82
and higher damage threshold. However, their linear dis- 83
persion is strong. Phase-matching conditions can then be 84
optimized by introducing a tilt angle in the pulse front 85
with a diffraction grating [32, 33]. Typical tilted-pulse- 86
front LiNbO3 THz sources (abbreviated TPF in Table 1 87
below) provide peak electric fields > 20 MV/m in the spec- 88
tral window ≤ 4 THz, with high conversion efficiencies 89
≥ 10−2 and > 15 µJ energies [32, 34, 35]. An attractive 90
alternativeisthe organic crystal DSTMS characterized by 91
nonlinear coefficients one order of magnitude larger than 92
LiNbO3 and good phase-matching. With DSTMS, THz 93
electric fields of ∼ 0.4 GV/m have been generated [36]. 94
The emitters discussed so far supply a very limited 95
bandwidth of a few THz. Gas-plasma THz emitters over- 96
come this limitation by offering bandwidths exceeding 40 97
THz. Two decades ago, THz pulsesproducedat moderate 98
laser intensities ∼ 1014W/cm2 were created from single- 99
color pulses ionizing air under an external strong bias field 100
[37]. A combination of two colors was rapidly proposed, 101
resulting in an increase of the THz energy by a factor 40 102
[38,39]. Early works on this technique reported peak THz 103
fields of 15 MV/m, bandwidths as broad as 75 THz [40,41] 104
and ∼ 10−4 conversion efficiencies. The standard two- 105
color scheme focuses a fundamental (FH) laser pulse onto 106
a β-barium-borate (BBO) crystal placed before the focus 107
of aconverginglens. The BBO crystal creates the second 108
harmonic (SH) field and both harmonics co-propagate to- 109
wards a common focal spot. In airthe resulting two-color 110
laser pulse ionizes O2 and N2 molecules at atmospheric 111
pressure close to focus. This creates an electron plasma, 112
called ”air plasma”,that produces a macroscopic current 113
leading to broadband THz emission. 114
This technique has several advantages over conventional 115
THz sources: First, fs-broadband laser pulses generate ex- 116
tended THz spectra. Second, high amplitude THz fields 117
close to the GV/m level can be produced without any risk 118
of damaging the source. Third, the regime of laser fila- 119
mentation, reached through a local balance between Kerr 120
self-focusing and plasma generation [42, 43], makes it pos- 121
sible to generate THz pulses remotely in the atmosphere 122
[44–46], and thus bypass the absorption of THz frequen- 123
cies by water molecules. Fourth, the energy contained 124
in the THz pulsecanstrongly increase with several laser 125
parameters, including the fundamental pump wavelength 126
[47], the laser pulse duration [48] and the number of colors 127
composing the pump pulse [49]. 128
Last but not least, laser pulses with ultra-high intensi- 129
ties > 1018W/cm2can also produce energetic THz waves 130
in relativistic interaction regimes [50]. The advantages 131
of such THz pulses are manyfold: They are highly en- 132
ergetic, close to the mJ level [51], and broadband with 133
about 70% of the THz energy located in the region < 10 134
Table 1: Performances of various methods for generating in-tense THz waves [58]. THz fields are expressed in GV/m; fre-quencies and bandwidth are expressed in THz. CE = conver-sion efficiency; CF = Central frequency; BW = Bandwidth.
Method THz field CE CF BW PCS < 0.1 10−4 ∼ 2 ∼ 5 2C 0.8 10−3 ∼ 5 − 10 > 50 OR 8.3 10−2 ∼ 1 − 4 ∼ 5 TPF 0.1 10−3 ∼ 0.8 ∼ 2 UHI > 10 5 × 10⁻⁴ 1 − 10 ≥ 10
THz pulses we find linear mode conversion [52],
tran-136
sient currents at the target rear surface [53] and coherent
137
transition radiation excited when accelerated electrons go
138
across a plasma/vacuum interface with relativistic
veloci-139
ties [54–56]. THz emissions from thin Ti foils was recently
140
measured with ∼ 0.7 mJ THz energies, field strengths of
141
∼ 10 GV/m and 10-THz bandwidth [57].
142
Table 1 summarizes the most recent performances (see
143
also [58]) reported from the above technologies.
144
Detection of intense THz waveforms and spectra.
145
There are several ways to detect THz radiation coherently.
146
The most common technique relies on the ultrafast
147
Pockels effect, where THz radiation is collected by an
148
electro-optical crystal, for example ZnTe [59,60]. The THz
149
field induces an instantaneous birefringence in the
electro-150
optic medium, which is probed with a second laser pulse
151
split from the pump source. To obtain the THz electric
152
field in time domain, the signal is recorded as a function of
153
the time delay between the THz and probe pulse. For
mea-154
suring broadband, intense THz pulses, temporal walk-off
155
due to velocity mismatch, however, puts severe conditions
156
on the crystal thickness. This method may also introduce
157
ambiguities linked to phase jumps [61].
158
Detection by air nonlinearities is possible as well [62–65].
159
Here, the THz beam is recombined with the
fundamen-160
tal at a second focus forming the detection region where
161
an electric bias field is applied. This technique is called
162
”ABCD” (Air-Biased Coherent Detection) [66]. A sketch
163
of the ABCD scheme is shown in fig. 5 commented later.
164
A plasma created by a two-color pulse emits THz radiation
165
towards a sample. This radiation is filtered and directed to
166
the detectionpart. Here,a probe pulse with controlled
de-167
lay is focused between two electrodes whereanalternating
168
field of 20 kV/cm is applied. The nonlinear response of air
169
produces second harmonicof the probe pulse that overlaps
170
with the THz field of interest. The interaction of the
fun-171
damental laser field Eω and the low frequency field
com-172
ponentscanthusbe described by E2ω ∝ χ(3)EωEωETHz,
173
where χ(3) denotes the third-order susceptibility of air.
174
So, the second harmonic intensity, which is the measured
175
quantity, is proportional to the THz wave intensity. To get
176
coherent detection, the AC bias voltage is synchronized at
177
half the laser repetition rate. 178
Another detection technique is the spectral-domain in- 179
terferometry (SDI),recently extended for THz field mea- 180
surements [61, 67]. Conventional SDI employs a broad- 181
band light source to illuminate a reference surface and a 182
sample, recombined in a Michelson interferometer [14]. In 183
the SDI THz variant, two optical probe pulses with a cer- 184
tain delay are focused into a ZnTe crystal, overlapping 185
with the THz pulse to be measured. The delay is cho- 186
sen such that the birefringence induced by the THz pulse 187
via Pockels effect is experienced by the second pulse only. 188
Then, the two probe pulses are sent into a spectrometer 189
and the THz pulse is retrieved from interference between 190
the two pulses. Alternatively, THz waves can also be de- 191
tected indirectly by THz Radiation Enhanced Emission 192
of Fluorescence (THz-REEF) that amounts to extracting 193
spectral information on the THz pulse from the plasma 194
fluorescence [68–70]. Using two color filaments, Liu and 195
co-workers performed a THz remote sensing at a distance 196
of 10 m [69]. To end with, let us mention the potential use 197
of solid dielectrics to exploit their strong χ(3)coefficient. A
198
recent study demonstrated the first solid-state scheme for 199
THz coherent detection relying on electric-field-induced 200
SH generation by a thin layer of fused silica [71]. 201
Main physical mechanisms. – An ultrashort opti- 202
cal pulse can be converted into the THz range via spe- 203
cific nonlinearities, namely, (i) the Kerr effect, (ii) photo- 204
ionization and (iii) plasma waves associated to pondero- 205
motive forces. The relevance of these mechanisms depends 206
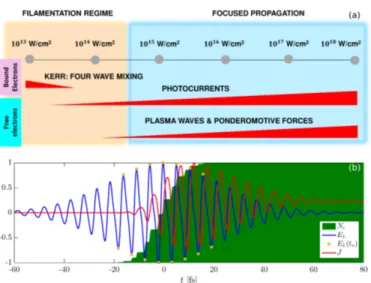
on the intensity level engaged, as summarized in fig. 3. 207
Four-wave mixing. This mechanism was proposed to 208
interpret the first experiments using two-color laser pulses 209
in air [38]. The polarization vector of the medium contains 210
nonlinear contributions that express in cubic power of the 211
electric field (Kerr effect), namely, PNL = ǫ0χ(3)EL3. This 212
nonlinearity mixes the two harmonics, resulting in the pro- 213
duction of low frequencies. Ignoring spatial dependencies, 214
a two-color laser field can be modelled as 215
EL(t) = r 2I0 cε0 X j=1,2 aje −2 ln 2t2τ 2 j cos(jω0t + ϕ j), (1)
where I0is the pump intensity, τj is the FWHM duration 216
of the jth harmonic (j = 1, 2), r = a2
2/a21 is the SH/FH 217
intensity ratio with a2
1+ a12 = 1, and ϕ = ϕ2− ϕ1 is the 218
relative phase between the two carrier waves. In the plane 219
wave approximation (τj → +∞), the Kerr nonlinearity 220
produces a quasi-static component Pdc
NL ∝ a21a2cos ϕ as- 221
similated to a THz emitter and maximum for in-phase 222
laser harmonics (ϕ = 0). Four-wave mixing is, however, 223
too weak to explain the observed THz field strengths [39]. 224
Recent experiments [72] showed that its signature is ac- 225
tually present in the THz spectrum for intensities less 226
than the ionization threshold of air molecules ∼ 5 × 10¹³ 227
W/cm2. Nevertheless, Kerr contributions, including the 228
L. Berg´e et al.
Fig. 3: (a) Mechanisms generating THz waves by intense two-color laser pulses, distributed according to the optical intensity. The first region involves the Kerr effect (four-wave mixing) and photoionization. The second region accentuates the contribu-tion of photoionizacontribu-tion in the tunnel regime (photocurrents) and involves plasma waves created by ponderomotive forces. (b) Photocurrent process: The two-color electric field gener-ates free electrons in stepwise increase via tunneling ionization occurring near the field extrema at t = tn. This builds a slow
component of the current that acts as a THz source.
three orders of magnitude lower compared to those coming
230
from photocurrents [74].
231
The photocurrents. In 2008, Kim et al. [40]
under-232
stood that generating a current of free electrons by
photo-233
ionization is the key process dominating THz wave
gener-234
ation by two-color laser pulses. The so-called ”local
cur-235
rent” (LC) model, worked on by Babushkin et al. [73],
al-236
lowed to explain how this terahertz radiation is produced
237
from ”photocurrents”. This model assumes that the
radi-238
ated electric field is proportional to the time derivative of
239
the electron current, i.e., ETHz∝ ∂tJ. At intensities larger
240
than 1013W/cm2, ionization takes place in the tunneling
241
regime [75]. The strength of the laser electric field is high
242
enough to lower the Coulomb potential of the atom, so
243
that the electrons can tunnel out of the potential barrier.
244
Ionization occurs near the extrema of EL(t) located at
245
times tn. The density of free electrons, Ne, rises from the
246
gas density Na with the ionization rate W (t) [77] as
247
∂tNe= W (t)(Na− Ne), (2)
and it increases by successive steps δNn as Ne(t) ≃
248
P
nδNnHn(t − tn), where the function Hn(t − tn) is close
249
to the Heaviside step function [73].
250
For a linearly-polarized laser pulse the current density
251
can be expressed in scalar form:
252
(∂t+ νc)J =
e2
me
NeE, (3)
where νc is the electron collision rate equal to a few ps−1.
253
Given the previous approximation on Ne(t), the cur- 254
rent J(t) can be divided into two distinct contributions, 255
J(t) ≃ JA(t) + JB(t) [73, 74]. JA(t) is the fast current 256
component that mainly describes generation of harmon- 257
ics due to photoionization. JB(t) depends on the product 258
P
nδNnvf(tn), where vf(tn) denotes the electron veloc- 259
ity at instant tn, and contains a low frequency component 260
responsible for THz emission. 261
Figure 3(b) summarizes THz generation by a two-color 262
pulse. Ionization appears near the extrema of the laser 263
electric field, inducing peaks in the rate W (t) from which 264
Ne increases steplike. Asymmetry in the two-color pulse 265
profile guarantees non-zero velocities vf(tn) ∝ sin ϕ. The 266
low frequency component in JB(t) is maximum for rela- 267
tive phases of π/2 between the two colors. This model has 268
been validated by experiments and 3D simulations [78]. A 269
single-color laser field generates almost no THz radiation. 270
With two colors, two orders of magnitude can be gained 271
in the THz energy yield as ϕ → π/2 [79]. The LC model 272
shows that THz fields can be enhanced by a judicious ar- 273
rangement of the laser harmonics. A sawtooth profile can 274
achieve in theory the record conversion rate of 2% [49]. 275
THz pulse generation with uncommon frequency ratios of 276
1:4 and 2:3 has also been experimentally tested [80]. In 277
space, THz emission takes place along small angles deter- 278
mined by phase-matching conditions and changes in the 279
refraction index due to plasma, depending on the length 280
of the plasma channel [81]. 281
Plasma wakefields. When the laser pump delivers 282
higher intensities > 1015W/cm2, other nonlinear mecha- 283
nisms can act as frequency converter. This is the case of 284
plasma waves, for which Eq. (3) must be supplemented 285
by the Lorentz force and quadratic terms in J associated 286
to ponderomotive motions [82, 83]. Once ionized, the free 287
electrons are dragged by the laser field out of their equilib- 288
rium position via the Lorentz force. This displacement of 289
chargesforcesthe electrons to oscillate around ions in the 290
wake of the laser pulse at the electronic plasma frequency 291
ωpe = e2Ne/ǫ0me (ǫ0 is the vacuum permittivity). This 292
frequency takes typical values between 20 and 60 THz for 293
densities between 1017 and 1018cm−3. However, it is not 294
guaranteed that, outside the created plasma, such fields 295
can be transmitted to a detector [84,85]. This depends on 296
the plasma volume and geometry (e.g., the gradients), the 297
emissivity of which can also be controlled by playing with 298
the transverse laser polarization [87]. 299
Unique spectral signatures. – 300
The ALTESSE Project. The identification of ener- 301
getic materials has become a major issue in dual research, 302
civil and military. A strong axis in this context concerns 303
the acquisition of spectral signatures of explosives or haz- 304
ardous materials upon large distances. The French project 305
ALTESSE [88] (Air Laser-based TErahertz SpectroScopy 306
of Explosives) aimed at testing the nonlinear terahertz 307
spectroscopy from atmospheric plasmas. Dedicated sci- 308
Fig. 4: Experimental device and ABCD detection system in transmission. SH (400 nm) is produced by a BBO crystal and focused with FH (800 nm) in the air by a lens (L). The THz radiation (blue stripes) from the plasma is filtered by a silicon wafer and collected by a set of off-axis parabolic mirrors. The delay line allows to probe the different instants of the THz pulse near the detection zone. The coupling between the focused probe beam and a high voltage module (HVM) creates a second harmonic in air detected by an avalanche photodiode (APD).
wide spectral window using two-color pulses; (ii)
perform-310
ing ABCD-based THz-TDS over distances larger than 10
311
m; (iii) carrying out spectroscopy in transmission and
re-312
flection geometries. Many materials have been analyzed in
313
the THz-to-far-infrared domain and we here reveal unique
314
signatures beyond 10 THz, using two-colorair plasmas.
315
Broadband THz emitters. The ALTESSE facility
op-316
erated at DTU/Fotonik [88] involved a generation part
317
(800-nm laser line delivering 35-fs, 3.5 mJ pulses at 1
318
kHz repetition rate) and a detection part, as shown in
319
fig. 4. After the BBO crystal, a half-wave plate rendered
320
the FH polarization parallel to the SH. Both colors were
321
focused into air and their relative phase was adjusted by
322
the position of the doubling crystal. THz-TDS was
car-323
ried out either in transmission or reflection. The samples
324
were prepared in powders mixed with polyethylene,
com-325
pressed into 1-mm-thick pellets and then mounted on a
326
sample holder. The recorded temporal signals obtained
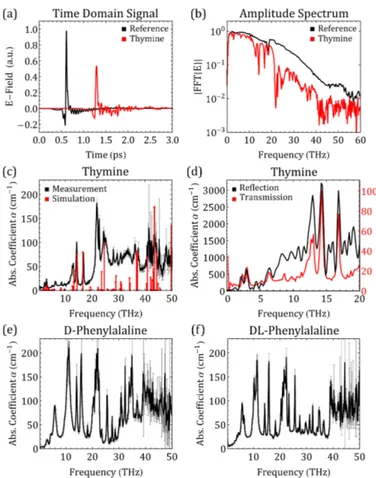
327
with and without the sample were Fourier transformed
328
to get their characteristic spectra. Figure 5(a) shows a
329
reference THz field (black curve, without sample) and a
330
THz field with the sample (red curve), which is thymine
331
(nucleobasis). The reference signal is a single-cycle pulse
332
having a duration of about 200 fs. The delay between
333
both signals originates from the optical index of the
sam-334
ple. The spectrum transmitted by the latter shows many
335
dips that correspond to its vibrational modes [see fig. 5(c)].
336
Here, we display the corresponding absorption coefficient
337
α(ω) = −(2/d) ln [T−1|Esample(ω)/Ereference(ω)|], where d
338
and T are the sample thickness and a transmission
fac-339
tor, respectively. The presence of features from 5 THz up
340
to 60 THz demonstrates the rich potential of an
ultra-341
broadband THz spectroscopy for the precise
identifica-342
tion of complex molecules. We also performed THz
spec-343
Fig. 5: (a) THz fields from the reference (nitrogen) and the sample (thymine pellet). (b) Transmission spectra obtained by Fourier transform. (c) Extracted absorption spectrum [α(ω)]. Red bars indicate the position and relative amplitude of CASTEP-calculated phonon modes. (d) Corresponding reflec-tion spectrum. (e,f) show two transmission spectra of stereoiso-mers: (e) D-phenylalaline and (f) DL-phenylalaline. Thin ver-tical black lines indicate experimental error bars.
troscopy in reflection geometry by inserting a golden mir- 344
ror between the last two parabolic mirrors in the setup 345
of fig. 4. The reflected THz spectrum shown in fig. 5(d) 346
restores thymines’s main peaks located within a 20-THz- 347
broad spectral window. Figures 5(e,f) detail the pre- 348
ciseness supplied by this method to discriminate between 349
stereoisomers of the same molecule. Here we observe the 350
four characteristic peaks of the D- and DL-phenylalanine 351
at the same position with similar amplitude. These spec- 352
tra, however, exhibit differences at low frequencies, which 353
demonstrates the ability of an ABCD-based broadband 354
THz spectroscopy to distinguish different isomers. 355
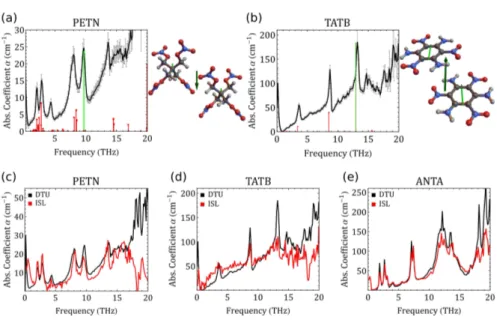
Ab-initio numerical calculations. Computations 356
based on the density functional theory were conducted 357
using the code CASTEP (Cambridge Serial Total En- 358
ergy Package [89]). CASTEP performs calculations of 359
molecular crystal eigenmodes corresponding to the phonon 360
frequencies (or energies) in a simulated unit cell (60 361
atoms/cell). These data enable us to compare the calcu- 362
L. Berg´e et al.
tra, and also to visualize the molecular motions in the
crys-364
tal. As an example, figs. 5(c) and 6(a,b) show the
absorp-365
tion spectrum of thymine and of two explosives, PETN
366
and TATB, where their calculated phonon modes are
plot-367
ted. Both positions and relative amplitudes of the latter
368
are in reasonable agreement with the experimental lines.
369
The four most important modes for thymine are 3.1 THz,
370
13.6 THz, 14.4 THz and 16.6 THz. At 3.1 THz, molecules
371
in the unit cell rotate relative to each other, which
cor-372
responds to an intermolecular motion of the whole
crys-373
tal. Going to higher frequencies, the crystal undergoes
374
intramolecular vibrations. PETN owns six distinct peaks
375
in the frequency range of 1 to 16 THz, above which the
sig-376
nal becomes noisy (see uncertainty bars). For TATB, the
377
spectrum evidences characteristic signatures at 3.5 THz
378
associated with intermolecular torsion, then at 8.5 and 13
379
THz associated with intramolecular angular oscillations.
380
Remote detection. To end with, figs. 6(c-e) show
spec-381
tra collectedwitha terawatt (5 mJ, 40 fs) Ti:Sa laser
op-382
erating at 100 Hz repetition rate, which was located at 15
383
meters from the ABCD detection system. The
environ-384
ment was bearing strong variations in temperature and
385
presence of dust and vibrations. We met stability
prob-386
lems in the laser beam energy and directionality triggered
387
by erratic temperature variations of ±3◦ C, which led us
388
to acquire spectra over short times (< 10 min) and
in-389
tegration times of 100 ms (300 ms used at DTU). These
390
spectra were reproduced 3 times for validation. Figure
391
6(c) displays the first-to-date 18-THz broad THz spectrum
392
of PETN measured with remote laser source. The
800-393
nm pump pulse freely propagated a distance > 10 m
be-394
fore reaching the optical table where the BBO crystal, the
395
sampleand ABCD setup were positioned. There, the
two-396
color pulse wasthenfocused by a 20-cm lens and created a
397
plasma producing radiation directed to the detection zone.
398
The red curve in fig. 6(c) shows the measured spectrum
399
from a nitrogen-saturated detection chamber. Note the
400
very good agreement with the PETN spectrum measured
401
in clean laboratory conditions (black curve)without
long-402
range pump pulse propagation. Figures 6(d,e) compare
403
the THz spectra of TATB and ANTA (explosives)
mea-404
sured with the same remote laser source (ISL) and in clean
405
atmosphere (DTU). The remote signals are less resolved
406
due to the above limitations. However, they still contain
407
the main spectral signatures of TATB and even achieve
408
an excellent agreement for the ANTA. Hence, these results
409
demonstrate that, even in noisy atmosphere and over large
410
distances > 10 m, a rapid acquisition of numerous
spec-411
tral signatures, over a broad bandwidth covering about 20
412
THz, is feasible and robust.
413
Conclusion. – Terahertz pulses produced by
ultra-414
fast lasers are able to cover a wide range of frequencies,
415
from gigahertz to mid-infrared, and offer rich perspectives
416
for characterizing many materials. In this article,
two-417
color plasma sources of terahertz radiation driven by
pho-418
tocurrents were discussed. Fully exploiting this
nonlin-419
ear conversion mechanism, the ALTESSE project demon- 420
strated the promising capabilities of portable laser devices 421
for operating an effective, remote detection of suspect ma- 422
terials, including explosives. 423
∗ ∗ ∗
The authors thank ANR and DGA for funding the 424
ASTRID Project “ALTESSE” (ANR-15-ASTR-0009). 425
They also acknowledge support from Laserlab.dk (Danish 426
Center for Laser Infrastructure). 427
REFERENCES 428
[1] Tonouchi M., Nat. Photon., 1 (2007) 9691. 429
[2] Chen J. et al., Opt. Express, 15 (2007) 12060. 430
[3] Leahy-Hoppa M. R. et al., Chem. Phys. Lett., 434 (2007) 431
227. 432
[4] Frederici J. F. et al., Semicond. Sc. Techn., 20 (2005) 433
S266. 434
[5] Kemp M. C. et al., Proc. SPIE, 5070 (2003) 44. 435
[6] Shen Y. C. et al., Appl. Phys. Lett., 86 (2005) 241116. 436
[7] Fischer B. M. et al., Proc. IEEE, 95 (2007) 1592. 437
[8] Pereira M. F. and Oleksiy Sh., THz for CBRN and 438
Explosives Detection and Diagnosis, edited by Springer 439
2017 440
[9] Liu J. et al., J. Phys.: Conf. Series, 680 (2016) 012030. 441
[10] Franz M. et al., J. Mol. Struct., 1006 (2011) 34. 442
[11] Berry E. et al., J. Laser Appl., 15 (2003) 192. 443
[12] Yu C. et al., Quant. Imaging Med. Surg., 2 (2012) 33. 444
[13] Gente R. and Koch M., Plant Methods, 11 (2015) 15. 445
[14] Hafez H. A. et al., J. Opt., 18 (2016) 093004. 446
[15] Klymenko M and Shulika Oleksiy V. and 447
Sukhoivanov I. A., Terahertz Spectroscopy - A Cutting 448
Edge Technology, edited by InTech 2017 449
[16] Crowe Th. et al., Proc. IEEE, 80 (1992) 1827 450
[17] Maestrini A. et al., Comptes Rendus Physique, 11 451
(2010) 480 452
[18] Kazarinov R., Sov. Phys.-Semicond., 5 (1971) 707. 453
[19] Faist J. et al., Science, 264 (1994) 553. 454
[20] Walther C. et al., Appl. Phys. Lett., 91 (2007) 131122. 455
[21] Bachmann D. et al., Optica, 3 (2016) 1087. 456
[22] Auston D. H. et al., Phys. Rev. Lett., 53 (1984) 1555. 457
[23] Suen J. Y. et al., Appl. Phys. Lett., 96 (2010) 141103. 458
[24] Shen Y. C. et al., Appl. Phys. Lett., 83 (2003) 3117. 459
[25] Hale P. J. et al., Opt. Express, 22 (2014) 26358. 460
[26] Yardimci N. T. et al., IEEE Trans. Terahertz Sci. Tech- 461
nol., 5 (2015) 223. 462
[27] Ropagnol X et al., Opt. Express, 24 (2016) 11299. 463
[28] Boyd R. W., Nonlinear Optics, edited by Academic 464
Press (San Diego) 2008 465
[29] Sun F. G. et al., CLEO 2000 Tech. Digest, 39 (2000) 479. 466
[30] Blanchard F et al., Opt. Express, 15 (2007) 13212. 467
[31] Loeffler T. et al., Opt. Express, 13 (2005) 5353. 468
[32] Hebling J. et al., Appl. Phys. B, 78 (2004) 593. 469
[33] Hebling J. et al., Opt. Express, 10 (2002) 1161. 470
[34] Blanchard F. et al., Opt. Lett., 39 (2014) 4333. 471
[35] Huang S. W. et al., Opt. Lett., 38 (2013) 796. 472
[36] Vicario C. et al., Phys. Rev. Lett., 112 (2014) 213901. 473
[37] L¨offler T. and Jacob F. and Roskos H. G., Appl. 474
Fig. 6: Absorption spectra (black curves) and simulated phonon modes (red bars) for (a) PETN and (b) TATB. Thin vertical black lines correspond to experimental error bars. On the right, characteristic molecular structures illustrating dipole excitations are shown (red: O, blue: N, grey: H atoms). Arrows indicate the center of mass dipole moments: the big arrow at center shows the total dipole moment of the unit cell related to the green absorption line; the two smaller arrows in the center of each molecule are the respective net dipole moments. (c-e) Absorption spectra collected in transmission far from the laser output for(c) PETN, (d) TATB and (e) ANTA. Red curves are spectra measured at Institut Saint-Louis (ISL - France)with the Ti:Sa source located at a distance of 15 m from the ABCD system. Black curves are spectra measuredin the laboratory over optical propagation paths of less than 1 min clean atmosphere (DTU/Fotonik - Denmark).
[38] Cook D. J. and Hochstrasser R. M., Opt. Lett., 25
476
(2000) 1210.
477
[39] Kress M. et al., Opt. Lett., 29 (2004) 1120.
478
[40] Kim K. Y. et al., Nat. Photon., 2 (2008) 605.
479
[41] Kim K. Y. et al., Opt. Express, 15 (2007) 4577.
480
[42] Braun A et al., Opt. Lett., 20 (1995) 73
481
[43] Berg´e L. et al., Rep. Prog. Phys., 70 (2007) 1633.
482
[44] Berg´e L. et al., Phys. Rev. Lett., 110 (2013) 073901.
483
[45] D’Amico C. et al., Phys. Rev. Lett., 98 (2007) 235002.
484
[46] Daigle J.-F. et al., Opt. Express, 20 (2012) 6825.
485
[47] Clerici M. et al., Phys. Rev. Lett., 110 (2013) 253901.
486
[48] Wang T.-J. et al., Appl. Phys. Lett., 97 (2010) 111108.
487
[49] Gonz´alez de Alaiza Mart´ınez P. et al., Phys. Rev.
488
Lett., 114 (2015) 183901.
489
[50] Hamster H. et al., Phys. Rev. Lett., 71 (1993) 2725.
490
[51] Gopal A. et al., Opt. Lett., 38 (2013) 4705.
491
[52] Liao G. Q. et al., Phys. Rev. Lett., 114 (2015) 255001.
492
[53] Gopal A. et al., Phys. Rev. Lett., 111 (2013) 074802.
493
[54] Leemans W. P. et al., Phys. Rev. Lett., 91 (2003) 074802.
494
[55] Liao G. Q. et al., Phys. Rev. Lett., 116 (2016) 205003.
495
[56] D´echard J. et al., Phys. Rev. Lett., 120 (2018) 144801.
496
[57] Herzer S. et al., New J. Phys., 20 (2018) 063019.
497
[58] Zhang X. C. et al., Nat. Photon., 11 (16) 2017.
498
[59] Wu Q. and Zhang X.-C., Appl. Phys. Lett., 70 (1997)
499
1784.
500
[60] Leitenstorfer A. et al., Appl. Phys. Lett., 74 (1999)
501
1516.
502
[61] Sharma G. et al., Opt. Lett., 37 (2012) 4338.
503
[62] Xie X. et al., Phys. Rev. Lett., 96 (2006) 075005.
504
[63] Dai J.-M. et al., Phys. Rev. Lett., 97 (2006) 103903.
505
[64] Karpowicz N. et al., Appl. Phys. Lett., 92 (2008) 011131.
506
[65] Liu K. and Zhang X.-C., THz for CBRN and Explosives
507
Detection and Diagnosis, edited by Springer (Dordrecht, 508
Netherlands) 2017 509
[66] Klarskov P. et al., New J. Phys., 15 (2013) 075012. 510
[67] Sharma G. et al., Opt Lett., 38 (2013) 2705. 511
[68] Liu J. and Zhang X.-C., Phys. Rev. Lett, 103 (2009) 512
235002. 513
[69] Liu J. et al., Nat. Photon., 4 (2010) 627. 514
[70] Dai J. et al., IEEE J. Sel. Top. Quantum, 17 (2011) 183. 515
[71] Tomasino A. et al., Optica, 4 (2017) 1358. 516
[72] Andreeva V. A. et al., Phys. Rev. Lett., 116 (2016) 517
063902. 518
[73] Babushkin I. et al., New J. Phys., 13 (2011) 123029. 519
[74] Nguyen A. et al., Opt. Express, 25 (2017) 4720. 520
[75] Keldysh L. V., Sov. Phys. JETP, 20 (1965) 1307. 521
[76] Perelomov A. M. et al., Sov. Phys. JETP, 23 (1966) 522
924. 523
[77] Thomson M. D. et al., Laser Photon. Rev., 1 (2007) 349. 524
[78] Babushkin I. et al., Phys. Rev. Lett., 105 (2010) 053903. 525
[79] Debayle A. et al., Opt. Express, 22 (2014) 13691. 526
[80] Zhang L.-L. et al., Phys. Rev. Lett., 119 (2017) 235001. 527
[81] You Y. S., Phys. Rev. Lett, 109 (2012) 183902. 528
[82] D’Amico C. et al., New J. Phys., 10 (2007) 013015. 529
[83] Sprangle P. et al., Phys. Rev. E, 69 (2004) 066415. 530
[84] Thiele I. et al., Phys. Rev. E, 94 (2016) 063202. 531
[85] Miao Ch. et al., Phys. Plasmas, 20 (2018) 063019. 532
[86] Gonz´alez de Alaiza Mart´ınez P. et al., Scient. Re- 533
ports, 6 (2016) 26743. 534
[87] Thiele I. et al., Optica, 5 (2018) 1617. 535
[88] ALTESSE Website: www.agencenationale- 536
recherche.fr/Project-ANR-15-ASTR-0009,. 537

![Table 1: Performances of various methods for generating in- in-tense THz waves [58]. THz fields are expressed in GV/m; fre-quencies and bandwidth are expressed in THz](https://thumb-eu.123doks.com/thumbv2/123doknet/13197611.392329/4.892.65.416.217.333/performances-various-methods-generating-expressed-quencies-bandwidth-expressed.webp)