HAL Id: hal-03209739
https://hal.archives-ouvertes.fr/hal-03209739
Submitted on 27 Apr 2021
HAL is a multi-disciplinary open access
archive for the deposit and dissemination of
sci-entific research documents, whether they are
pub-lished or not. The documents may come from
teaching and research institutions in France or
abroad, or from public or private research centers.
L’archive ouverte pluridisciplinaire HAL, est
destinée au dépôt et à la diffusion de documents
scientifiques de niveau recherche, publiés ou non,
émanant des établissements d’enseignement et de
recherche français ou étrangers, des laboratoires
publics ou privés.
Risks to coral reefs from ocean carbonate chemistry
changes in recent earth system model projections
K Ricke, J Orr, K Schneider, K Caldeira
To cite this version:
K Ricke, J Orr, K Schneider, K Caldeira. Risks to coral reefs from ocean carbonate chemistry changes
in recent earth system model projections. Environmental Research Letters, IOP Publishing, 2013, 8
(3), pp.034003. �10.1088/1748-9326/8/3/034003�. �hal-03209739�
LETTER • OPEN ACCESS
Risks to coral reefs from ocean carbonate
chemistry changes in recent earth system model
projections
To cite this article: K L Ricke et al 2013 Environ. Res. Lett. 8 034003
View the article online for updates and enhancements.
Related content
Sensitivity of ocean acidification and oxygen to the uncertainty in climate change
Long Cao, Shuangjing Wang, Meidi Zheng et al.
-Could artificial ocean alkalinization protect tropical coral ecosystems from ocean acidification?
Ellias Y Feng (), David P Keller, Wolfgang Koeve et al.
-Tropical seagrass meadows modify seawater carbon chemistry: implications for coral reefs impacted by ocean acidification
Richard K F Unsworth, Catherine J Collier, Gideon M Henderson et al.
-Recent citations
Modeling Coral Bleaching Mitigation Potential of Water Vertical Translocation – An Analogue to Geoengineered Artificial Upwelling
Ellias Y. Feng et al
-Changes of temperature and precipitation extremes in a typical arid and semiarid zone: Observations and multimodel ensemble projections
Cuiping Zhao et al
-The Potential Impact of Nuclear Conflict on Ocean Acidification
Nicole S. Lovenduski et al
IOP PUBLISHING ENVIRONMENTALRESEARCHLETTERS Environ. Res. Lett. 8 (2013) 034003 (6pp) doi:10.1088/1748-9326/8/3/034003
Risks to coral reefs from ocean carbonate
chemistry changes in recent earth system
model projections
K L Ricke
1, J C Orr
2, K Schneider
3and K Caldeira
11Department of Global Ecology, Carnegie Institution for Science, 260 Panama Street, Stanford, CA 94305, USA
2Laboratoire des Sciences du Climat et de l’Environnement, Institut Pierre Simon Laplace, F-91191 Gif-sur-Yvette Cedex, France
3Department of Environmental Earth System Science, Stanford University, 367 Panama Street, Stanford, CA 94305, USA
E-mail:[email protected] Received 27 March 2013
Accepted for publication 12 June 2013 Published 3 July 2013
Online atstacks.iop.org/ERL/8/034003
Abstract
Coral reefs are among the most biodiverse ecosystems in the world. Today they are threatened by numerous stressors, including warming ocean waters and coastal pollution. Here we focus on the implications of ocean acidification for the open ocean chemistry surrounding coral reefs, as estimated from earth system models participating in the Coupled Model
Intercomparison Project, Phase 5 (CMIP5). We project risks to reefs in the context of three potential aragonite saturation (a) thresholds. We find that in preindustrial times, 99.9% of reefs adjacent to open ocean in the CMIP5 ensemble were located in regions witha > 3.5. Under a business-as-usual scenario (RCP 8.5), every coral reef considered will be surrounded by water witha < 3 by the end of the 21st century and the reefs’ long-term fate is
independent of their specific saturation threshold. However, under scenarios with significant CO2emissions abatement, thea threshold for reefs is critical to projecting their fate. Our results indicate that to maintain a majority of reefs surrounded by waters witha > 3.5 to the end of the century, very aggressive reductions in emissions are required. The spread ofa projections across models in the CMIP5 ensemble is narrow, justifying a high level of confidence in these results.
Keywords: CMIP5, ocean acidification, coral reefs, Earth System Models
S Online supplementary data available fromstacks.iop.org/ERL/8/034003/mmedia
1. Introduction
When carbon dioxide dissolves into seawater it forms carbonic acid, decreasing the ocean’s pH, in a process generally referred to as ocean acidification [1]. Rising Content from this work may be used under the terms of theCreative Commons Attribution 3.0 licence. Any further distribution of this work must maintain attribution to the author(s) and the title of the work, journal citation and DOI.
concentrations of carbon dioxide (CO2) in the atmosphere have already increased the concentrations of hydrogen ions in ocean surface waters by 26%, i.e., a 0.1 unit reduction in global mean ocean surface pH [2]. These hydrogen ions react with carbonate ions to form bicarbonate ions, reducing the saturation of all mineral forms of calcium carbonate in seawater, including aragonite, which corals precipitate to build their skeletons. As the a decreases, so too do calcification rates of corals [3, 4]. The IPCC’s Fourth Assessment Report stated that doubling of atmospheric 1
Environ. Res. Lett. 8 (2013) 034003 K L Ricke et al
CO2 would reduce calcification of corals by 20–60% [5]. As acidification increases, damage will occur to the coral reefs that serve as protective coastal barriers, breeding and spawning grounds for fish and other marine life, sources of tourism income and hotspots of ocean biodiversity [6–8].
Thirteen Earth System Models (ESMs) participating in the Coupled Model Intercomparison Project 5 (CMIP5) each have interactive ocean biogeochemistry models that output state variables including total dissolved inorganic carbon (DIC), alkalinity, sea surface temperature (SST), and salinity. Several recent studies have used the CMIP5 ensemble to investigate the implications of temperature projections on coral bleaching [9,10]. Our study focuses on implications of geochemical projections of chemical stress on corals. We use results from these ESMs to examine the changing saturation state of aragonite (a), the mineral form of calcium carbonate that corals use to make their skeletons, of open ocean waters surrounding approximately 6000 coral reefs. In the remainder of this letter, when we refer to the chemistry of water surrounding coral reefs we mean the chemistry predicted by the Earth system models for the location of the reefs. For locations adjacent to but not in areas resolved by a model, we use the chemistry of water in the nearest location represented in the model.
2. Data and methods
We analyzea surrounding reefs in the CMIP5 simulations under several representative concentration pathway (RCP) scenarios. In the main text, we focus on three scenarios: RCP8.5, a business-as-usual scenario in which very little mitigation is undertaken this century; RCP4.5, under which greenhouse gas emissions peak in mid-century and are reduced and stabilized by late this century; and RCP2.6, a scenario in which emissions are dramatically curtailed in the near future and are negative (CO2 is captured from the air) by the end of the century [11,12]. Results for another scenario—RCP6.0—which fewer of the ensemble’s models simulated, are shown in the supplementary information (available atstacks.iop.org/ERL/8/034003/mmedia).
For each model,a was computed from simulated DIC, alkalinity, temperature, and salinity. But before computation each simulated input field was corrected for its decadal mean bias relative to modern observations, using a slight variant of the approach used in [2, 13]. That is, a was computed after first removing from each model field, the average difference between the model mean during 1989–1998 and the observational reference. For observed fields, we used the GLODAP gridded data product [14] for DIC and alkalinity along with the 2009 World Ocean Atlas climatology for temperature [15], salinity [16], and concentrations of phosphate and silica [17]. Changes to the concentrations of phosphate and silica were assumed to be zero, because all models did not provide those variables4. We 4 In the low latitude oceans, phosphate and silica generally have low
concentrations. Together their combined alkalinity affects the computed saturation state for aragonite by less than 0.005 in terms of the zonal mean.
computed a using routines based on the standard OCMIP carbonate chemistry adapted for earlier studies [2, 13] to compute all carbonate system variables and use recommended constants from the Guide to Best Practices for Ocean CO2 Measurements [18]. All equilibrium constants are on the total pH scale, except for KS, which is referenced the free pH scale. Total boron is computed as a function of salinity following [19]. To calculate saturation, we used the apparent solubility product for aragonite KsPfrom [20] and the calcium concentration as a function of salinity [21].
For analysis, model data were regridded to a common 1◦by 1◦grid using bilinear interpolation. Reef locations were taken from the Reef Base Global Database [22] and non-reef coral colonies were excluded from the analysis. If a reef was located in a water cell in a particular model, the aragonite saturation value for that cell was assigned to the reef. If a reef was in a masked-value cell (land or regions of the ocean not simulated), but was within 1◦of a water cell (i.e., chemistry of one or more of the eight surrounding cells was simulated), the reef was assigned the inverse-distance weighted mean value of all surrounding cells with data. Only reefs with an a value in all ensemble models were included in our analysis. Including interpolated values, 5901 reefs hada data values in all 13 ESMs. Of the ReefBase coral reefs considered, 3821 were excluded, mostly the zone in where there is no GLODAP gridded data (near Indonesia between the Indian and Pacific Oceans). Summary statistics were calculated by aggregating results for a given ESM first, then calculating quartiles and ranges across the ensemble.
See supplementary table S1 (available atstacks.iop.org/ ERL/8/034003/mmedia) for a list of models and modeling groups, a summary of the scenarios simulated using each ESM and the years of data available for each model scenario.
3. Results
The aragonite saturation threshold (acrit) for viable reef ecosystems is uncertain [23, 24], but the preindustrial distribution of water chemistry surrounding coral reefs may nevertheless provide some indication of viability. While a levels are different within coral reefs than in the surrounding ocean water, reef chemistry and calcification rates are strongly influenced by the open ocean aragonite saturation [25–27]. Thus we use open ocean a relative to preindustrial at reef locations as a proxy for a similar ratio within the reefs.
Historical simulations of ocean chemistry indicate that in preindustrial times, seawater surrounding coral reefs were typically oversaturated with respect to aragonite by a factor of at least 3.5. Given evidence that corals have some biological resilience to acidification [28] and in interest of presenting a However, in some areas with high nutrients such as the equatorial Pacific, the contribution is larger. We account for phosphate and silicate contributions in our calculations. As our baseline for those nutrients, we use the gridded data product from the World Ocean Atlas [17], and those are combined with other input, namely for DIC and Alk from GLODAP [14] as well as temperature and salinity from [15]. However, when adding the perturbations from the model simulations we neglect changes in phosphate and nutrients. We consider that those changes are relatively small and will have very little impact on computed saturation states.
Environ. Res. Lett. 8 (2013) 034003 K L Ricke et al
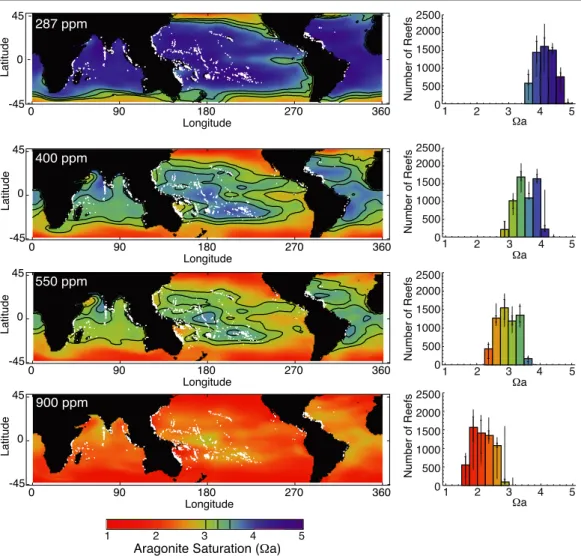
Figure 1. Aragonite saturations surrounding coral reefs as projected for RCP 8.5. Maps show coral reef locations (in gray) anda in areas where it can be computed from the CMIP5 ensemble and bias corrected with the GLODAP dataset. Histograms show those reefs binned by aragonite saturation of surrounding waters. Panels show ensemble median results for ensemble-member 10-year meana at: (a) the beginning of the ensemble simulations in the 1860s (287 ppm xCO2); (b) around present day (400 ppm); and for future conditions at (c) 550 ppm (mid-century for RCP 8.5 and end-of-century for RCP 4.5), and (d) 900 ppm (end-of-century under RCP 8.5). Contour lines showacritthresholds of 3, 3.25 and 3.5; panel (d) has no contours because all ocean waters havea < 3. Histogram error bars show ensemble quartile values and the maximum and minimum range.
conservative analysis, we use this lower bound of preindustrial chemistry conditions as an upper bound viability threshold and also test two lower values of acrit, 3.25 and 3, which are similar to thresholds used in some past studies [29–31]. Cao and Caldeira [32] conducted a similar analysis using simulations from a single intermediate-complexity model and found that with atmospheric CO2 concentrations of about 550 ppm or more, all reefs will be in waters witha values of 3.5 or less.
Figure1shows global maps ofa data and histograms of a at the included coral reef locations, designated on the maps, for four concentrations of atmospheric CO2. The values presented are ten-year means around the year where atmospheric CO2 reaches the designated values of 290, 390, 550 and 900 ppm. Each cell displayed in the maps and each bar in the histograms represent the multimodel ensemble median value. Theacrit thresholds that we focus on in our analysis are shown with contour lines on the maps. Error bars on the histograms show the ensemble quartiles and range.
While the data in figure 1 are taken from the RCP8.5 simulations, the proportion of reefs that lie above a threshold depends primarily on atmospheric CO2concentration (xCO2) and is not highly path dependent, as discussed below. As such, the time slices shown in the figure can also be considered approximately representative of the corresponding xCO2, regardless of scenario. In the 1860s (287 ppm CO2), all the coral reefs analyzed lie above the three acrit values under preindustrial conditions. Also illustrated are simulated conditions in the approximate present day (390 ppm); at 550 ppm, which corresponds to mid-century for RCP8.5 and end-of-century for RCP4.5; and 900 ppm, which corresponds to the end of the century under RCP8.5.
The importance of the correct value of acrit varies substantially by the scenario analyzed. Figure2 shows time series of percentage of reefs analyzed above acrit values of 3.5, 3.25 and 3 for the three RCP emissions scenarios in ensemble summary statistics (median, quartiles and range). For RCP8.5, the timing of reefs crossing the thresholds varies 3
Environ. Res. Lett. 8 (2013) 034003 K L Ricke et al
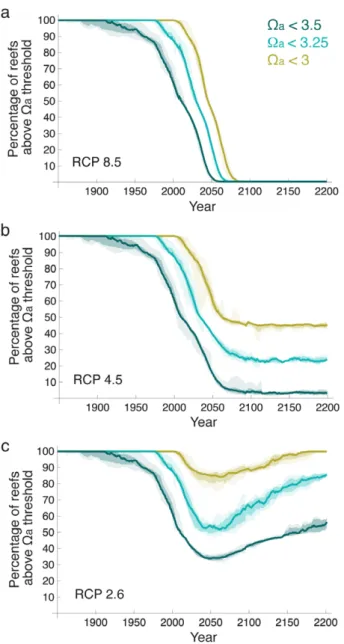
Figure 2. Percentage of coral reefs surrounded by open ocean waters above aragonite saturation thresholds as a function of time in three RCP scenarios. The ensemble median (lines), quartiles (darker shading) and range (lighter shading) are displayed for aragonite saturation thresholds (acrit) of 3.5, 3.25 and 3. Panels show RCP emissions scenarios (a) 8.5, (b) 4.5 and (c) 2.6. The future of coral reefs depends on both future emissions trajectories and the sensitivity of reefs to changes ina.
with the value ofacrit, but by the end of the 21st century all the seawater surrounding reefs analyzed have crossed all three thresholds, exiting the range of ocean chemistry conditions that surrounded coral reefs in preindustrial times. For RCP4.5, the fate of coral reefs strongly depends on the value of acrit; by the end of the 21st century aragonite saturation states have stabilized and approximately 1–5% of reefs are located in ocean waters witha > 3.5, 21–26% are located in ocean waters witha > 3.25, and 42–47% are located in ocean waters with a > 3. Under an aggressive emissions reduction scenario like RCP2.6, both the thresholds and the timescales for reef resilience are pertinent. Saturation states reach minimum values at mid-century with 32–37% of reefs
Figure 3. Percentage of coral reefs surrounded by open ocean waters above aragonite saturation thresholds as a function of atmospheric CO2concentration. The ensemble median (lines), quartiles (darker shading) and range (lighter shading) are displayed for aragonite saturation thresholds (acrit) of 3.5, 3.25 and 3. The narrow spread across all models and emissions scenarios considered indicates that xCO2is a good predictor of the distribution of aragonite saturation around coral reefs.
located in ocean waters with a > 3.5, 47–57% in ocean waters with a > 3.25, and 77–87% in ocean waters with a > 3; afterwards, a begins to increase again.
Figure 3 shows the same results from all scenario simulations as a function of atmospheric CO2 concentration instead of time. The ensemble median and quartilea values align closely between emissions scenarios, though the range varies considerably between the low and high emissions scenarios. Variability in the outlier models appears to depend on the rate of change of xCO2 as well as its absolute concentration. Between the point at which the population of reefs begins crossing the acrit threshold and that at which about 10% reefs are below the threshold, the decrease in the percentage of reefs aboveacritis roughly linear with xCO2 increase.
Results for individual models are plotted in the supplementary materials (see supplementary figures S1 and S2 available at stacks.iop.org/ERL/8/034003/mmedia). The 13 models’ ocean aragonite saturation responses to rising atmospheric CO2 track closely across the ensemble and display similar interannual variabilities. This agreement suggests that these ocean chemistry projections, unlike some other simulated climatological indicators such as precipitation, are fairly robust in the current generation of climate models.
4. Discussion
Many factors including light, temperature, salinity, nutrients, and sediment loading affect the distribution of coral reefs, and some of these factors are correlated with aragonite saturation state (a). Therefore, the absence (or near-absence) of coral reefs in waters with a levels less than 3, 3.25 or 3.5, does not necessarily mean that a threshold aragonite saturation limits the biogeographic distribution of coral reefs. However, while coral reefs have sustained existence under higher temperatures in the Earth’s past, such as during 4
Environ. Res. Lett. 8 (2013) 034003 K L Ricke et al
the Cretaceous, they have not thrived far outside of the tropics [33] where high aragonite saturations have prevailed. Such regions of high aragonite saturation are projected to disappear by the end of the century under RCP8.5. In the light of experimental data showing reduced calcification with decreasing aragonite saturation, the lack of overlap between the aragonite saturation levels surrounding coral reefs before the industrial revolution and those in a future ocean under continued CO2emissions provide reasons to doubt future reef sustainability. In the absence of substantial reductions in CO2 emissions, surrounding waters will go outside the bounds of the open ocean saturation states that surrounded all coral reefs before the industrial revolution.
Reefs that did not fall within 1◦ of a water cell in all 13 CMIP5 GLODAP-corrected datasets are excluded from our analysis. Coral reefs in certain regions are therefore not represented in our results. In particular, the reef-rich Indo-Pacific between the Korean peninsula and the northern coast of Australia was masked in the ensemble. Such lower latitude regions tend to have higher a values on average, which could indicate that our results are slightly biased.
A number of factors in addition to aragonite saturation will influence the fate of coral reefs in a changing climate, perhaps even more so than ocean acidification. Several recent analyses have examined potential future heat stress as predicted by the CMIP5 ensemble [9, 10]. Other human stresses on the environment in and around coral reefs also constitute significant threats to reef viability in coming decades, including pollution, overdevelopment and overfishing [34–37]. The correlation (or lack thereof) between changing carbonate chemistry and these other projected stresses is not clear, although the analysis in Meissner et al [31, 37] using one intermediate-complexity model suggests that the reefs that are chemically stressed first under the RCP scenarios are often different than those that are thermally stressed first [38].
Our results indicate that if civilization continues along its current carbon dioxide emissions trajectory (which is currently steeper than even RCP8.5), by the end of the century all existing coral reefs will be surrounded by ocean chemistry conditions well outside of preindustrial (or even present day) conditions. This result is consistent across all of the Earth System Models simulating ocean biogeochemistry in the CMIP5 ensemble. On the timescales and within the range of scenarios considered here, carbonate chemistry of waters surrounding reefs is closely related to atmospheric CO2 concentrations and is not sensitive to the pathway by which those concentrations are reached. With deep emission cuts, the fraction of reefs that remains sustainable from a chemical point of view depends sensitively upon the critical value ofa. Only with large emissions abatement efforts will a significant fraction of reefs remain in ocean waters with aragonite saturation states of three or more, and only under the most aggressive policies, possibly including direct capture of CO2 from the atmosphere, will reef-amenable carbonate chemistry conditions be preserved around a majority of reefs.
Acknowledgments
We acknowledge the World Climate Research Programme’s Working Group on Coupled Modelling, which is responsible for CMIP, and we thank the climate modeling groups (listed in table S1 of the supplementary materials available atstacks. iop.org/ERL/8/034003/mmedia) for producing and making available their model output. For CMIP the US Department of Energy’s Program for Climate Model Diagnosis and Intercomparison provides coordinating support and led development of software infrastructure in partnership with the Global Organization for Earth System Science Portals. We thank Long Cao and two anonymous reviewers for helpful comments on the manuscript. To produce the derived CMIP5 data for saturation states, JCO acknowledges support from two EU FP7 projects: EPOCA (grant 211384) and CARBOCHANGE (grant 264879).
References
[1] Broecker W and Clark E 2001 A dramatic Atlantic dissolution event at the onset of the last glaciation Geochem. Geophys. Geosyst.2 1065
[2] Orr J C et al 2005 Anthropogenic ocean acidification over the twenty-first century and it impact of calcifying organisms Nature437 681–6
[3] Chan N C S and Connolly S R 2013 Sensitivity of coral calcification to ocean acidification: a meta-analysis Glob. Change Biol.19 282–90
[4] Schneider K and Erez J 2006 The effect of carbonate chemistry on calcification and photosynthesis in the hermatypic coral Acropora eurystoma Limnol. Oceanogr.
51 1284–93
[5] Fischlin A et al 2007 Ecosystems, their properties, goods, and services Climate Change 2007: Impacts, Adaptation and Vulnerability. Contribution of Working Group II to the Fourth Assessment Report of the Intergovernmental Panel on Climate Change(Cambridge: Cambridge University Press) pp 211–72
[6] Connell J H 1978 Diversity in tropical rain forests and coral reefs Science199 1302–10
[7] Moberg F and Folke C 1999 Ecological goods and services of coral reef ecosystems Ecol. Econom.29 215–33
[8] Bellwood D R, Hughes T P, Folke C and Nystr¨om M 2004 Confronting the coral reef crisis Nature429 827–33
[9] Frieler K, Meinshausen M, Golly A, Mengel M, Lebek K, Donner S D and Hoegh-Guldberg O 2012 Limiting global warming to 2◦
C is unlikely to save most coral reefs Nature Clim. Change3 165–70
[10] van Hooidonk R, Maynard J A and Planes S 2013 Temporary refugia for coral reefs in a warming world Nature Clim. Change3 508–11
[11] Moss R H et al 2010 The next generation of scenarios for climate change research and assessment Nature463 747–56
[12] van Vuuren D P et al 2011 The representative concentration pathways: an overview Clim. Change109 5–31
[13] Orr J C 2011 Recent and future changes in ocean carbonate chemistry Ocean Acidification ed J-P Gattuso and L Hansson (Oxford: Oxford University Press) pp 41–66 [14] Key R M et al 2004 A global ocean carbon climatology:
results from global data analysis project (GLODAP) Glob. Biogeochem. Cycles18 GB4031
[15] Locarnini R A et al 2010 World Ocean Atlas 2009, Volume 1: Temperature(NOAA Atlas NESDIS 68) ed S Levitus (Washington, DC: US Government Printing Office)
Environ. Res. Lett. 8 (2013) 034003 K L Ricke et al
[16] Antonov J I et al 2010 World Ocean Atlas 2009, Volume 2: Salinity(NOAA Atlas NESDIS 69) ed S Levitus (Washington, DC: US Government Printing Office) [17] Garcia H E et al 2010 World Ocean Atlas 2009, Volume 4:
Nutrients (Phosphate, Nitrate, Silicate)(NOAA Atlas NESDIS71) ed S Levitus (Washington, DC: US Government Printing Office)
[18] Dickson A G, Sabine C L and Christian J R (ed) 2007 Guide to Best Practices for Ocean CO2Measurements(PICES Special Publication)
[19] Uppstr¨om L R 1974 Boron/chlorinity ratio of deep-sea water from the Pacific Ocean Deep-Sea Res. 21 161–2
[20] Mucci A 1983 The solubility of calcite and aragonite in seawater at various salinities, temperatures, and one atmosphere total pressure Am. J. Sci.283 780–99
[21] Riley J P and Tongudai M 1967 The major cation/chlorinity ratios in sea water Chem. Geol.2 263–9
[22] Tupper M, Tan M K, Tan S L, Radius M J and Abdullah S 2011 ReefBase: A Global Information System on Coral Reefs(available from:www.reefbase.org)
[23] Kleypas J A, Buddemeier R W, Archer D, Gattuso J P, Langdon C and Opdyke B N 1999 Geochemical
consequences of increased atmospheric carbon dioxide on coral reefs Science284 118–20
[24] Guinotte J M, Buddemeier R W and Kleypas J A 2003 Future coral reef habitat marginality: temporal and spatial effects of climate change in the Pacific basin Coral Reefs
22 551–58
[25] Bates N R, Samuels L and Merlivat L 2001 Biogeochemical and physical factors influencing seawater fCO2and air–sea CO2exchange on the Bermuda coral reef Limnol.
Oceanogr.46 833–46
[26] Shaw E C et al 2012 Impacts of ocean acidification in naturally variable coral reef flat ecosystems J. Geophys. Res.117 C03038
[27] Kleypas J A, Anthony K R N and Gattuso J-P 2011 Coral reefs modify their seawater carbon chemistry—case study from a barrier reef (Moorea, French Polynesia) Glob. Change Biol.17 3667–78
[28] Fabricius K E, Langdon C, Uthicke S, Humphrey C,
Noonan S, De’ath G, Okazaki R, Muehllehner N, Glas M S and Lough J M 2012 Losers and winners in coral reefs acclimatized to elevated carbon dioxide concentrations Nature Clim. Change1 165–9
[29] Guinotte J M et al 2003 Future coral reef habitat marginality: temporal and spatial effects of climate change in the Pacific basin Coral Reefs22 551–8
[30] Kleypas J A et al 1999 Environmental limits to coral reef development: where do we draw the line? Am. Zool. 39 146–59
[31] Meissner K J et al 2012 The importance of the terrestrial weathering feedback for multimillennial coral reef habitat recovery Glob. Biogeochem. Cycles26 GB3017
[32] Cao L and Caldeira K 2008 Atmospheric CO2stabilization and ocean acidification Geophys. Res. Lett.35 L19609
[33] Kiessling W 2001 Paleoclimatic significance of Phanerozoic reefs Geology29 751–4
[34] Wilkinson C 2008 Status of Coral Reefs of the World: 2008 (Townsville: Global Coral Reef Monitoring Network and Reef and Rainforest Research Centre) p 296
[35] Pandolfi J M et al 2011 Projecting coral reef futures under global warming and ocean acidification Science333 418–22
[36] Reopanichkul P et al 2009 Sewage impacts coral reefs at multiple levels of ecological organization Mar. Pollut. Bull.
58 1356–62
[37] Meissner K, Lippmann T and Gupta A S 2012 Large-scale stress factors affecting coral reefs: open ocean sea surface temperature and surface seawater aragonite saturation over the next 400 years Coral Reefs31 309–19