Publisher’s version / Version de l'éditeur:
The Journal of Physical Chemistry B: Condensed Phase, 109, 1, pp. 609-616,
2005-01-13
READ THESE TERMS AND CONDITIONS CAREFULLY BEFORE USING THIS WEBSITE. https://nrc-publications.canada.ca/eng/copyright
Vous avez des questions? Nous pouvons vous aider. Pour communiquer directement avec un auteur, consultez la première page de la revue dans laquelle son article a été publié afin de trouver ses coordonnées. Si vous n’arrivez pas à les repérer, communiquez avec nous à [email protected].
Questions? Contact the NRC Publications Archive team at
[email protected]. If you wish to email the authors directly, please see the first page of the publication for their contact information.
NRC Publications Archive
Archives des publications du CNRC
This publication could be one of several versions: author’s original, accepted manuscript or the publisher’s version. / La version de cette publication peut être l’une des suivantes : la version prépublication de l’auteur, la version acceptée du manuscrit ou la version de l’éditeur.
For the publisher’s version, please access the DOI link below./ Pour consulter la version de l’éditeur, utilisez le lien DOI ci-dessous.
https://doi.org/10.1021/jp047510q
Access and use of this website and the material on it are subject to the Terms and Conditions set forth at
Highly stable phospholipid unilamellar vesicles from spontaneous
vesiculation : a DLS and SANS study
Yue, Baohua; Huang, Chien-Yueh; Nieh, Mu-Ping; Glinka, Charles J.;
Katsaras, John
https://publications-cnrc.canada.ca/fra/droits
L’accès à ce site Web et l’utilisation de son contenu sont assujettis aux conditions présentées dans le site LISEZ CES CONDITIONS ATTENTIVEMENT AVANT D’UTILISER CE SITE WEB.
NRC Publications Record / Notice d'Archives des publications de CNRC:
https://nrc-publications.canada.ca/eng/view/object/?id=e39a317b-2207-400d-8a85-80f321547316 https://publications-cnrc.canada.ca/fra/voir/objet/?id=e39a317b-2207-400d-8a85-80f321547316Highly Stable Phospholipid Unilamellar Vesicles from Spontaneous Vesiculation: A DLS
and SANS Study
Baohua Yue,† Chien-Yueh Huang,*,† Mu-Ping Nieh,‡,§Charles J. Glinka,|and John Katsaras‡ Otto H. York Department of Chemical Engineering and Department of Chemistry and EnVironmental Science,
New Jersey Institute of Technology, Newark, New Jersey 07102, National Research Council, Steacie Institute for Molecular Sciences, Chalk RiVer, Ontario K0J 1J0, Canada, Department of Physics, UniVersity of Guelph,
Guelph, Ontario N1G-2W1, Canada, and Center for Neutron Research, National Institute of Standards and Technology, Gaithersburg, Maryland 20899
ReceiVed: June 9, 2004; In Final Form: September 8, 2004
Spontaneously formed unilamellar vesicles (ULV) composed of short- and long-chain phospholipids, dihexanoyl phosphorylcholine (DHPC) and dimyristoyl phosphorylcholine (DMPC), respectively, were doped with a negatively charged lipid, dimyristoyl phosphorylglycerol (DMPG), and studied with small-angle neutron scattering (SANS) and dynamic light scattering (DLS). Upon dilution, the spontaneous formation of vesicles was found to take place from bilayered micelles, or so-called “bicelles”. SANS and DLS data show that ULV with narrow size distributions are highly stable at low lipid (Clp< 0.50 wt %) and NaCl salt (Cs) concentrations.
ULV size was found to be independent of both Clp and Cs when they were below 0.33 and 0.5 wt %,
respectively. Surface charge and salinity were found to be important factors in preparing ULV of a certain size. This observation is not in complete agreement with previous experimental results and cannot be completely explained with current theoretical predictions based on equilibrium calculations for catanionic surfactant mixtures. ULV size is found to be invariant over a wide range of temperatures, both below and above the phase-transition temperature, TM, of DMPC, and was stable for periods of weeks and months, even after
sonication.
Introduction
Unilamellar vesicles (ULV) consisting of a single closed bilayer are considered to be one of the better drug encapsulation and delivery devices. Although liposomal ULV often form spontaneously in vivo, they are seldom found in simple aqueous solutions. Over the past decade, several groups have investigated spontaneously forming ULV occurring in certain cationic-anionic surfactant1-12and cationic surfactant systems.13
How-ever, because of biocompatibility issues, surfactant systems are normally considered to be less suitable for biological applica-tions.
Conventional methods for the preparation of lipid ULV are tedious and involve procedures such as repeated freezing and thawing, multiple extrusions, and sonications. Normally, high pressure is required to produce small, extruded ULV (pore size ∼50 nm or smaller), and the production rate is very low. Another concern of extruded vesicles is that the samples are almost always contaminated with larger multilamellar vesicles (MLV). In contrast, spontaneous forming ULV have many advantages, including ease of preparation, good size reproducibility, high stability over time, and less contamination from MLV. Because these ULV are formed “spontaneously”, they can either be energetically stable or kinetically trapped. For the purposes of drug delivery, of great interest are their low polydispersity and size (50-150 nm).14,15 Here, we report on the characteristics
of spontaneously forming, stable phospholipid ULV. Their size
and polydispersity and the insensitivity of these two character-istics to changes in lipid concentration and salinity make them likely candidates as drug-delivery vehicles.
Spontaneously forming ULV were previously observed in solutions consisting of long- and short-chain lipid mixtures.16,17
Typically, they were obtained from micelle-to-vesicle transitions induced by detergent elimination18-20or a temperature jump.21-24
In those studies, the average vesicle radius,〈Ro〉, was always
found to change with lipid concentration, Clp, indicating that
the ULV were sensitive to the chemical potential of the lipids. A recent study25,26 has shown that the structure and size of
spontaneously forming DMPG or Ca2+-doped ULV were
practically independent over a wide range of Clp. However, when
the systems were doped with both DMPG and Ca2+, vesicle
radius again became sensitive to changes in Clp. It is known
that adding Ca2+to lipid mixtures alters the ionic strength of
the solution and the bilayer’s charge density because of the strong chemical binding of Ca2+ ions with PC headgroups.27
In the present study, we attempt to minimize these complications by using NaCl, instead of CaCl2, as Na+does not bind with the
lipid headgroups as strongly as Ca2+but instead forms a “loose”
counterion layer surrounding the headgroups, as previously revealed by NMR.27,28
Most theoretical studies of spontaneous vesiculation and ULV stability were applied to equilibrium systems. Using Helfrich’s model29and fluid lipid bilayers, the microscopic energy per
spherical vesicle has a simple scale-free relationship of 4π(2kb
+ kG), where kband kGare the bending modulus and Gaussian
modulus, respectively. These moduli depend on factors such as surfactant distribution, cosurfactants, surface charge, molecule packing, and so forth. Winterhalter and Helfrich30,31and other
* Corresponding author. E-mail: [email protected].
†New Jersey Institute of Technology. ‡Steacie Institute for Molecular Sciences. §University of Guelph.
|National Institute of Standards and Technology.
10.1021/jp047510q CCC: $30.25 © 2005 American Chemical Society Published on Web 12/16/2004
groups32-35 have examined the effect of electrostatic double
layers on the bending elasticity of fluid membranes using Poisson-Boltzmann (P-B) theory. One of the most prominent findings is that the Gaussian modulus, depending on charge density and the Debye length, can be negative for the spontane-ous formation of ULV. Safran et al.36,37 calculated the free
energy of ULV formed in surfactant mixtures and suggested that, compared to extended lamellae, surfactant mixtures with a high bending modulus may yield a lower elastic energy if there is a strong attraction between the two surfactants. Bergstro¨m and Eriksson8,9derived an effective kbfor surfactant
mixtures by considering a variety of contributions such as geometric packing, Coulombic and headgroup interactions, chain conformation, and mixing. Oberdisse et al.38-40applied the
so-called vesicle cell model (VCM) and P-B theory to investigate the effect of charge density (F), dilution, salinity, and bending modulus on ULV size. Israelachvili et al.41,42developed
mean-field theories by considering molecular geometric packing, self-assembly, and interactions among surfactant molecules and lipids. More sophisticated molecular models,43-45which
con-sider the energy change related to molecular translation and rotation, headgroup interaction, chain conformation, and elec-trostatic interactions, have also been employed to predict the size of small ULV.
It has recently been reported18-20,45 that spontaneously
forming ULV may be kinetically trapped. These findings led to the kinetic model proposed by Leng et al.,46,47which suggests
a growth mechanism for bicelles upon dilution and the closure of large bicelles to form vesicles when the perimeter line tension dominates the bending elastic energy. The size of the kinetically trapped vesicles can thus be determined by controlling Clpand Cs.
The present work investigates the self-assembled structures of DMPC/DMPG/DHPC mixtures doped with Na+using SANS
and DLS. Surface charge is introduced by doping with the negatively charged lipid, DMPG. Compared to Ca2+, Na+does
not bind tenaciously to lipid headgroups, thus the surface charge density of Na+-doped mixtures can simply be controlled with
the DMPG/DMPC molar ratio. Nevertheless, it is noticed that the zeta potential of the vesicles may be affected by the electrochemical double layer and thus the concentration of NaCl.27,28The vesicle size was monitored as a function of lipid
concentration (Clp), solution salinity (Cs), temperature (T), and
time (t). Throughout the experiment, the molar ratio of long-(DMPC) to short-chain (DHPC) lipids remained constant at 4.0, whereas the DMPC/DMPG ratio for all samples was 60. These molar ratios were selected on the basis of our previous experimental results (data not shown), which indicate that stable ULV exist only for DMPC/DHPC molar ratios between 2 and 5. Beyond this range, DMPC/DHPC/DMPG mixtures form discoidal bicelles or MLV.23-26
A structural phase diagram of lipid mixtures in the dilute regime (Clp< 1.00 wt %) is presented. It is found that under
numerous experimental conditions the ULV size is insensitive to both Clpand Cs. The structural phase diagram is consistent
with Winterhalter and Helfrich’s prediction,31namely, that at
the surface charge densities and Debye lengths studied, the calculated Gaussian modulus and total elastic energy are negative, predicting the spontaneous formation of ULV. As salinity increases, the total elastic energy increases, eventually leading to a ULV-MLV transition. The origin of nearly constant-size vesicles as a function of lipid concentration and salinity is presently not clear: at low Clp, it may be due to the
dominant role of enthalpic interactions or due to kinetic reasons
during ULV formation. Despite this lack of detailed understand-ing, the DLS results are highly reproducible, and most samples remained unchanged for weeks and even months at low Clp.
Strong mechanical energy input, such as vortexing, centrifuga-tion, and even bath sonicacentrifuga-tion, was applied to the ULV, but no size change was observed once they were formed.
Experimental Section
Materials.DMPC, DHPC, and DMPG were purchased from
Avanti Polar Lipids54(Alabaster, AL); sodium chloride (NaCl)
was obtained from Sigma-Aldrich (St. Louis, MO). All chemi-cals were used as received. Prior to use, deuterium oxide (99.8%, Fisher Scientific) was filtered through a 0.1-µm Millipore Millex-VV sterile syringe-driven PVDF filter.
Sample Preparation. Stock solutions of DMPC/DHPC
(molar ratio ) 4/1) and DMPC/DMPG/DHPC (molar ratio ) 60/2/15) were prepared to a Clpof 5.00 wt % in D2O. Vortexing
and temperature cycling from 4 to 50°C were used to dissolve the lipids. The two 5.00 wt % solutions were then mixed accordingly to a final DMPC/DMPG/DHPC molar ratio of 60/ 1/15. After equilibrating for 24 h at T ) 4 °C, the solutions were diluted to Clp) 1.00 wt % using filtered D2O. Sodium
chloride was then added to yield a Csin the range of 0.10 to
1.00%. The solutions were then frozen at -10°C followed by a single thawing step to room temperature for better mixing. Finally, solutions were diluted with appropriate amounts of D2O
to the final Clpvalues. After preparation, samples were stored
at 4 °C for 4 months, and selected samples were further incubated at 30°C for a period of 1 month. Most samples were occasionally tested using DLS over the 5-month period, whereas all SANS experiments were conducted 1 month after sample preparation.
Small-Angle Neutron Scattering
Theory. The scattering intensity, I(Q), from a solution
composed of particles can be expressed in terms of a form factor,
F(Q), and a structure factor, S(Q), where Q is the scattering
vector (Q ) (4π/
λ) sin(θ/2)). The form factor reveals the
geometric characteristics of the single aggregate in solution, and the structure factor accounts for correlations due to interparticle interactions. The form factor and the structure factor are assumed to be independent, and the scattering intensity can be expressed as
where npis the number density of the scattering particles.
In our case, the F(Q) of a ULV can be simulated using a spherical shell model with three parameters: vesicle size, bilayer (shell) thickness, and polydispersity.23,24,26For S(Q), an
analyti-cal form can be obtained by solving the Ornstein-Zernike equation using a mean spherical approximation (MSA).48The
derived S(Q), which accounts for the repulsive electrostatic interactions between particles, was used in fitting the ULV system. The parameters pertaining to ULV charge density and salt concentration can be estimated from Clpand Cs; a 20%
variation is allowed in the fitting procedure.
Experiment. SANS experiments were conducted using the
30m NG7 SANS (Glinka et al., 1998) located at the NIST Center for Neutron Research (Gaithersburg, MD). The neutron wave-length was 0.81 nm with a full width at half-maximum (fwhm) spread of 0.11. Two sample-to-detector distances (1.50 and 15.30 m) were selected, covering an effective Q range between 0.002 and 0.3 Å-1. A detector offset of 20 cm was employed I(Q)∝np|〈F(Q)〉2|S(Q) (1)
to provide adequate overlap for combining data sets. Ambient background and empty cell scattering were subtracted from the 2-D raw data. The corrected data were then circularly averaged to yield a 1-D intensity distribution, I(Q), which was put on an absolute scale (cross section per unit volume) using the incident neutron flux. The incoherent scattering was obtained from the intensity plateau at high Q of the reduced data and was subtracted from the raw data. All of the SANS experiments were carried out at 30°C.
Dynamic Light Scattering
Theory.For a dilute solution of monodisperse, noninteracting
spherical particles, the Stokes-Einstein equation adequately describes the relationship between the particle’s diameter d and the diffusion coefficient D and is written as
where kB, T and η are the Boltzmann constant, absolute
temperature, and solvent viscosity (D2O, in our case),
respec-tively.
The autocorrelation function (ACF), G(τ), obtained from the scattering data can be written as follows:
where I(t) is the detected intensity at time t and τ is the delay time. Assuming that the intensity distribution of the measured signal is Gaussian, we can rewrite the ACF as
where g(τ) is the field autocorrelation function that can be expressed as the superposition of the different decaying modes
with the decay rate being
where Q is the scattering vector and Airepresents the prefactor of the ith mode. The data were reduced using CONTIN,49 a
cumulant analysis and regularization method with an inverse Laplace transformation. CONTIN calculates diffusion coef-ficients Diby solving eq 5 through eigenvalue decomposition and uses a nonlinear statistical “smoothing” algorithm to reduce the number of parameters used to describe the data. CONTIN can be applied to both unimodal and multimodal size distribu-tions.
Experiment.DLS experiments were performed on a
Beck-man N4 Plus photon correlation spectrometer at a scattering angle of 90°. The instrument is equipped with a laser source of wavelength 632.8 nm and an 80-channel correlator with multi-τ channel spacing. Before experimentation, the instrument was calibrated using a standard latex solution. All samples were tested at three different temperatures, 10 , 30 , and 50°C. The viscosities at these temperatures are 1.679, 0.9759 and 0.6519, respectively. At comparable temperatures, solutions with D2O,
compared to those with H2O, exhibit a higher viscosity due to
increased hydrogen bonding. Both intensity- and number-weighted results were obtained. For quantitative comparisons of DLS results with SANS data, only number-weighted average
histograms are shown in the paper. However, intensity-weighted histograms are better suited in distinguishing large particles such as MLV.
Results
Visual Observations. All ULV solutions were transparent
with some “bluish” appearance, commonly seen in mixtures of vesicles with diameters in the range of tens of nanometers. The non-DMPG stock solution of Clp) 5.0 wt % became opaque
as the temperature increased from 4 to 25°C and vice versa, presumably because of a transition from bicelles to MLV.24At
high concentrations and low T (∼10°C), the nondoped lipid mixtures formed bicelles. Because of the small size of this structure, bicellar solutions are also transparent. However, MLV solutions usually appear opaque, and over a period of time, MLV colloids can separate macroscopically from solution. The 60/ 2/15 DMPC/DMPG/DHPC stock solution (also 5 wt %) remained transparent and became highly viscous when T was increased from 4 to 25°C.
After mixing the two stock solutions to yield the desired DMPC/DMPG ratios, we stored the mixture at 4°C for 1 day and then diluted it to 1.00 wt %. After a single freeze/thaw cycle, all 1.00 wt % solutions became totally transparent around 10 °C. When these samples (1 wt %) were heated to room temperature, their appearance turned from transparent, to bluish, and, finally, to opaque, indicative of a bicelle-ULV-MLV phase transition. These low NaCl solutions (<2 wt %) were stable only at low temperature for days, whereas mixtures with very high amounts of NaCl (10 wt %) remained clear for at least 6 months at 4°C. The addition of NaCl can induce phase separation, resulting in an opaque appearance at room temper-ature; a similar change has also been observed in surfactant systems.5Though the appearance of the solution was used as a
subjective determinant of MLV formation,23,24,26DLS
intensity-weighted histograms have indicated the presence of a multi-modal distribution with large particles (>100 nm).
All ULV samples were prepared by directly diluting the 1.00 wt % transparent solutions (bicelle phase) with D2O at room
temperature, the exception being the 0.033 wt % sample that was diluted from a 0.10 wt % sample at room temperature. Samples at 4°C were subjected to a T jump and underwent a bicelle-to-vesicle transition25with an accompanying change of
appearance, from clear to bluish, that remained unchanged for months at 4°C. No phase separation was observed in samples with Clplower than 0.5 wt % and Cslower than 0.33 wt % for
4 months. Phase separation occurred after only days or weeks in samples with Clp> 0.5 wt % and Cs> 0.33 wt %. Slight
cloudiness was observed in samples with Clphigher than 0.33
wt % after a 4-month storage period in a refrigerator but was easily eliminated by shaking or heating the samples to room temperature. A similar observation was previously reported in CTAB/SOS surfactant systems.6A 2-D schematic phase diagram
is presented in Figure 1 summarizing the various observations described.
Effects of Clpand Cson Vesicle Stability and Size.To study the effect of Clpon the resultant self-assembled structures present
in the various mixtures, we measured ULV size at a series of
Clpconcentrations: 0.033, 0.10, 0.33, 0.50, and 0.75 wt % with Cs) 0.1 wt %. As mentioned previously, SANS experiments
were conducted at 30°C after the samples were incubated at 4
°C for a period of 1 month. DLS experiments were conducted at 10 , 30 , and 50 °C immediately after sample preparation and at intervals during the 4 months of storage, the only exception being the 0.75 wt % sample that turned opaque at T
D) kBT 3πηd (2) G(τ) )
∫
0∞I(t) I(t + τ) dt (3) G(τ) ) 1 + γg(τ)2 (4) g(τ) )∑
i Aie-Γi τ (5) Γi) DiQ 2 (6)> 30 °C. The 0.75 wt % sample was tested only at 10 °C immediately after preparation.
SANS data and the corresponding best-fit curves using the three-parameter spherical shell model are presented in Figure 2. A detailed mathematical expression of the model has been described elsewhere.23,24,26 For better comparison, the SANS
data for the 0.50 and 0.75 wt % samples were offset by scaling factors of 100 and 200, respectively. The best-fit results from the spherical shell model are found to be in good agreement with the experimental data for Clpe0.5 wt % samples. The
results also indicate that, as a function of Clp, bilayer thickness
(∼3.2 nm) remains unaltered and in agreement with previously reported values.23-26 Moreover, vesicle radii remain virtually
constant (24 ( 1 nm) and are independent of lipid concentration for Clpe0.33 wt % samples. Larger monodisperse ULV (∼31
nm) are observed for the Clp) 0.5 wt % sample. For Clp)
0.75 wt %, SANS data show a monotonic decay in intensity with a slope of -2, implying the existence of large, polydisperse aggregates, possibly large ULV.
DLS measurements (Figure 3) for Clpe0.33 wt % samples
depict a unimodal size distribution of low polydispersity and a number-weighted average hydrodynamic radius, RH, of about
25 ( 2 nm. Of note is that the best-fit vesicle radius from SANS experiments is usually slightly smaller than the hydrodynamic radius (RH) measured by DLS. This is possibly due to the fact
that RH includes the contribution from associated water
mol-ecules whereas the radius obtained from SANS studies does not. Both SANS and DLS results demonstrate that the size of ULV remains practically unchanged over a range of Clp(e0.33
wt %). As Clpwas increased to 0.5 wt %, ULV size was found
to increase. A clear bimodal distribution has been observed in the intensity-weighted histogram (not shown) for a Clp) 0.75
wt % sample, indicating the presence of large aggregates. Although highly stable ULV were found when doped either with a charged lipid (i.e., DMPG) or a salt (i.e., CaCl2),25,26this is
the first observation of a highly stable ULV system doped simultaneously with a charged lipid (DMPG) and a salt (NaCl). To study the effect of ionic strength, we added NaCl to liposomal solutions. Unlike Ca2+, which strongly binds to lipid
bilayers and, in some cases, induces vesicle fusion,50sodium
salts such as NaCl and NaBr do not bind tenaciously to the lipid’s headgroup. They can thus be used to control the ionic strength in surfactant and liposomal systems efficiently.46,47,51
The effect of ionic strength on vesicles was tested by using samples prepared at three Clpvalues: 0.033, 0.1, and 0.33 wt
%. For the Clp) 0.33 wt % sample, five salt concentrations
(Cs ) 0, 0.10, 0.33, 0.50, and 1.00 wt %) were examined,
whereas only two Cssamples (0.10 and 0.33 wt %) were studied
for the other Clp.
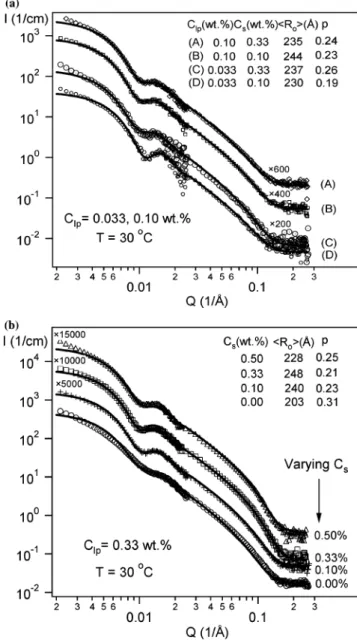
Figure 4a and b depict SANS data for the above-mentioned samples. With the exception of the lowest (0 wt %) and highest (1 wt %) Cs, the best fits from SANS data yield a radius of 24
( 1 nm and a polydispersity of ∼20%. The sample with Cs)
0 wt % (non-NaCl-doped) had a slightly smaller radius (∼20 nm) and also a slightly higher polydispersity (∼30%); the sample with the highest Cs(1.00 wt %) turned opaque 1 day
after preparation, presumably forming MLV.
The finding of forming nearly constant-size ULV was also examined by DLS. Figure 5a and b shows the size distributions Figure 1. Schematic diagram of sample appearance as a function of
Clpand Cs: O, transparent bluish tinge after prolonged storage at high and low temperatures; b, transparent only at low T for a short period of time; f, transparent and stable only at low T, but for an extended period of time.
Figure 2. SANS data and fitting results for various Clpvalues and a Cs of 0.10 wt %: Clp ) 0.033, 0.10, 0.33, 0.50, and 0.75 wt %, respectively. To better compare, scaling factors of 100 and 200 were applied to the 0.50 and 0.75 wt % data, respectively. An obvious size increase was observed when the Clpreached 0.50 wt %. The data of the Clp) 0.75 wt % sample were not fit because of the large object size and high polydispersity.
Figure 3. DLS size distribution functions for various Clp(0.033, 0.10, 0.33, 0.50 and 0.75 wt %) at a fixed Cs(0.10 wt %).〈RH〉values are similar for the three low concentrations (0.033, 0.10, and 0.33%) but shifted to larger size for the 0.50 wt % sample. Note that all of the data shown above were taken after 1 month of storage time except for the 0.75% sample, which was tested at 10 °C immediately after preparation to avoid phase separation.
obtained from DLS that exhibited similar histograms for all samples. Though the polydispersity of the samples varied with salt and lipid concentrations, it is shown that all number-weighted〈RH〉values were around 25 ( 3 nm, except for the Cs ) 0% sample, whose 〈RH〉 is 16 nm. From an
intensity-weighted size distribution analysis, we found another small peak with a much larger RH( >100 nm) in a few samples. Their
negligible number percentages were not seen in the number-weighted histograms. The existence of a few large particles may explain the discrepancy between the SANS data and the fit to the data at very low Q values (<0.04 nm-1).
Other Effects on Vesicle Stability and Size.Time EVolution. The stability of ULV size versus time for four different Clp
samples (0.033, 0.1, 0.33, and 0.5 wt %) was monitored using DLS. All samples were kept at 4°C for the first 4 months before experimentation. DLS measurements were taken immediately after the temperature was increased to 30°C. Table 1 depicts
the evolution of the number-average〈RH〉of four samples over
a 4-month period. For Clpe 0.1 wt %,〈RH〉 values of ULV
were found to be practically invariant over the 4-month storage period at 4°C, in addition to 1 month of storage at 30°C. For the most part, ULV size remains practically unchanged. The
Clp/Cs) 0.50/0.1% sample became unstable after 2 months of
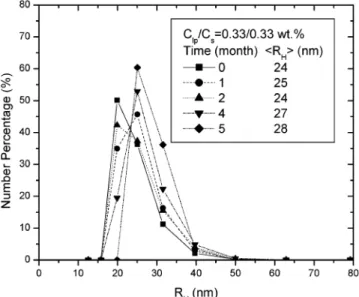
storage and had phase separated. Figure 6 shows the size evolution of a Clp/Cs) 0.33/0.33% mixture, exhibiting a narrow
unimodal distribution immediately after sample preparation. The appearance of the sample remained unchanged during the first 4 months but became cloudy after 1 month of storage at 30°C. In this case, another peak (>100 nm) is observed in the intensity Figure 4. SANS data and best-fit results for samples with various Cs
at (a) Clp ) 0.033, 0.10 wt % and (b) Clp) 0.33 wt %. Two salt concentrations (Cs) 0.1 and 0.33 wt %) were investigated for samples with Clp) 0.033 and 0.10 wt %, whereas four Csvalues (0, 0.1, 0.33, and 0.5 wt %) were examined for the samples with Clp) 0.33 wt %. Data were rescaled to better compare. Vesicle radii were found to be nearly constant except for the sample without NaCl (Cs) 0 wt %), where the radius was smaller.
Figure 5. Size distribution functions under different salt concentrations and lipid concentrations: (a) Clp) 0.033 and 0.10 wt % and (b) Clp) 0.33 wt %. Monodisperse vesicles with nearly constant size were observed for all samples except for the one with Cs) 0 in b, where the vesicle size is smaller.
TABLE 1: Number-Weighted Average Hydrodynamic Radius〈RH〉(nm) Obtained from Four Selected Samples
versus Time after the DLS Measurements Were Takena
Clp, Cs(wt %) 0 month 1 month 2 months 4 months 5 months
0.033, 0.33 26 25 26 27 25
0.10, 0.10 25 27 X X 28
0.33, 0.33 24 25 24 27 28
0.50, 0.10 34 33 X X X
aIn general, the ULV size increases very slightly over the period of
histogram (not shown), indicative of the formation of large aggregates, possibly MLV.
Effect of Temperature. The structural phase transition of
DMPC/DHPC mixtures is often observed when the temperature is increased beyond the chain-melting transition of DMPC, around 23°C.23,24Within the range of Clpinvestigated (<1 wt
%), most of the structures formed above TMwere structures
with a higher curvature (e.g., ULV), in contrast to bicelles, which are found at temperatures below TM. An exception to this is
certain DMPC/DHPC mixtures that form ULV both above and below TM.25,26 This may imply that changes to DMPC’s
hydrocarbon chain conformation may not directly affect the self-assembled structure.
In the present study, ULV stability as a function of temper-ature was examined via DLS for samples prepared at three lipid concentrations. Figure 7 shows the size distribution for a Clp/ Cs ) 0.1/0.33 wt % sample at 10, 30, and 50 °C. Size
distributions are practically indistinguishable and appear to be narrow at higher temperatures. A similar behavior has been observed in the Clp) 0.33 wt % sample; however, the Clp)
0.75 wt % sample became opaque at T > 25°C, indicating the presence of MLV.
Discussion
Effect of Lipid Concentration, Clp.The size of spontane-ously forming ULV, in general, varies with Clp.25,26 Our
observations of samples with Clp> 0.33 wt % are consistent
with those previously reported. For cases of Clpe0.33 wt %,
the vesicle size becomes Clp-independent, similar to that for
systems doped with either DMPG or Ca2+ ions but not with
both.25,26A previous study of nondoped ([DMPC]/[DMPG] ) ∞) and strongly DMPG-doped ([DMPC]/[DMPG] ) 15) systems, at the same temperature and lipid concentration, confirmed the presence of MLV and bicelles, respectively.24
MLV are vesicles composed of a wide range of radii and conformations, which are entropically stabilized and incur only a small penalty for deviating from their spontaneous curvature. The formation of bicelle systems with elevated DMPG levels implies that strong Coulombic interactions between charged lipids may stiffen the membrane and drive the short-chain DHPC lipids toward the rim of the disklike bicellar structure. When introduced with an appropriate amount of charge, DMPC/DHPC mixtures form a vesicular structure with a specific radius (possibly related to the spontaneous curvature of the system). This implies that an appropriate surface charge may induce a reasonably deep local free-energy minimum resulting in the observed size insensitivity. Note that the ratio between charged (DMPG) and noncharged lipids was held constant during the entire study, with the assumption that the ULV membrane composition remains unaltered as a function of temperature and concentration. The size insensitivity to lipid concentration also contradicts the predictions by Oberdisse et al.,39,40whose results,
for a given surface charge density, indicate a size increase with increasing lipid concentration. In our experiments, the range of total lipid concentration, whereby ULV radii remained unaltered, was small (<0.5 wt %) and even smaller for the case of charge density. The insensitivity of ULV to a changing chemical potential may be the result of a deep local free energy in forming the self-assembled structures.
Recently, Leng, Egelhaaf, and Cates47 proposed a kinetic
model to explain the formation of vesicles in a lecithin/bile salt system. The model stated that ULV can be kinetically trapped as the detergent (charged short-chain lipid) molecules are removed from the rim of disklike micelles (bicelles) upon dilution. In the Leng et al.46,47study, bicelles coalesce into a
larger planar structure to compensate for the loss of short-chain lipids. As the radius of the newly formed bicelles reaches a critical radius, r*, the rate of vesicle formation exceeds the rate of forming larger bicelles, and most of the short-chain lipids (bile salt) are released from the bicelle’s rim into the bulk solution. The vesicle size is, therefore, approximately equal to
r*/2, depending on the interaction between aggregates, packing
constraints, and salt concentrations. Once vesicles are formed, the size may be insensitive to certain changes in salt or lipid concentration because only a small amount of bile salt remains in the membranes. The formation of ULV in our study is different from the scenario just described. Although bicelles were found at Clp) 1 wt % and low temperature,26the
short-chain DHPC lipid does not carry any charge and most likely localizes itself at the rim of the bicelle. Most of the charged DMPG molecules are expected to stay in the bilayers with DMPC because both compounds have the same chain length. This, of course, does not preclude the formation of ULV from another kinetically controlled mechanism. However, more Figure 6. Size evolution as a function of time for the 0.33/0.33 wt %
sample. A slight increase was observed after 5 months.
Figure 7. Size distribution for a Clp) 0.10 and Cs) 0.33 wt % sample at 10 , 30 , and 50°C. The data show that as a function of temperature the ULV size remains practically unaltered.
studies on the stability and the size of ULV formed via various pathways are needed.
Effect of Ionic Strength.The screening effect of Coulombic
interactions on the self-assembled charged structures can be studied by changing the ionic strength (e.g., salt concentrations) of the solution and thus the Debye length, χD. Our experimental
results show a slightly smaller vesicle radius for the NaCl-free mixtures (∼20 nm, SANS) compared to that for mixtures with NaCl (∼24 nm, SANS). Assuming complete dissociation of DMPG in a NaCl-free mixture with Clp ) 0.33 wt %, the
calculated χD is about 38.5 nm, larger than the radius of
curvature. The surface charge density of a DMPC/DMPG bilayer (neglecting the charge difference between the inner and outer layers and taking Ro) 24 nm and Ri) 21 nm) is about 3.5 ×
10-3 C/m2. Compared to calculations by Winterhalter and
Helfrich,30,31the above experimental charge density and Debye
length decrease and result in a small, positive bending modulus and a negative Gaussian modulus, leading to a negative total elastic energy favoring spontaneous vesiculation. Reducing the screening length (by increasing salt concentration) reduces the bending modulus; however, under the present charge density conditions, the negative Gaussian modulus increases with ionic strength, eventually leading to a positive total energy at a threshold Cs,MLVvalue, where the transition from ULV to MLV
takes place.
Figure 1 depicts such a trend as a function of salt concentra-tion. An increase in vesicular size (from 20 to 24 nm according to SANS data) upon the addition of NaCl agrees with the above explanation. For samples doped with NaCl, the Debye length χDvaries from 4 nm (Cs) 0.033 wt %, 5.6 mM) to 1.3 nm (Cs
) 0.33 wt %, 56 mM), with the ULV size remaining unaltered. Again, our observations of ULV size insensitivity are in contradiction to what has been predicted by Oberdisse et al.39,40
In their case, the size monotonically increased with salinity at higher charge density. Though there is no direct comparison between our data and calculations from a more detailed treatment, such as P-B theory with translational entropy, asymmetric charge density, and so forth, the insensitivity of vesicular size may be attributed to a low entropic contribution due to low lipid concentration and a dominant enthalpic contribution. As the lipid concentration increases, other degrees of freedom should be considered, and the entropic contribution should increase with the total lipid concentration, eventually destabilizing the ULV structure at a threshold salinity of Cs,MLV,
which decreases with total lipid concentration (as shown in Figure 1). A more extensive study is presently in progress to better understand the various structures and their stability at present lipid and salt concentrations.
Aging and Temperature Effect.The size evolution of ULV
systems depends on the rate of exchange between the surfactant/ lipid from aggregates to solution and the flip-flop rate of surfactant/lipid molecules between the inner and outer leaflets. Although it was found that the size of certain surfactant vesicles remained unaffected over a period of months,52 sometimes
vesicle size was observed to increase rapidly over a short period of time and then slowly stabilize over a period of months.53
Nonsterically stabilized lipid vesicles are rarely stable for extended periods.14,15
Despite an invariant ULV size (Figure 6), the issue of whether these ULV are kinetically trapped or thermodynamically stable is not yet understood. After 4 months, a slight increase in size and polydispersity was observed in the Clp) 0.33 wt % sample,
implying either a slow structural evolution or lipid degradation. Note that samples were stored at 4°C, lower than the TMof
DMPC, except during measurements. For the most part, DMPC was in the gel phase, a more rigid molecular structure than the LR phase, hence the exchange rate of DMPC from ULV to
solution or vice versa was slow. The invariant ULV size at low temperature (4 °C) may suggest that ULV are kinetically trapped. After 4 months of storage at 4°C, the Clp) 0.33 wt
% sample was heated to 30°C and incubated for a period of 1 month. After incubation, the sample was studied with DLS, indicating the possible presence of MLV.
Conclusions
Low-polydispersity, spontaneously forming ULV were found in DMPC/DMPG/DHPC phospholipid mixtures by diluting a high-concentration lipid solution at low temperature (4 °C). SANS and DLS results show that the ULV are reasonably stable over extended periods of time and are unaffected by certain changes in lipid concentration, solution ionic strength, and temperature. Under the imposed constant surface charge density, the structural phase diagram could be explained by the theoreti-cal predictions of Winterhalter and Helfrich.30,31However, the
nearly constant ULV size as a function of lipid concentration (Clp< 0.33%), salinity (Cs< 0.5 wt %), and temperature is
different from theoretical predictions39,40and previous
experi-mental reports. A possible explanation may be that the enthalpic contribution from the negative Gaussian modulus dominates at low lipid concentrations. Another possibility may be the energetically favorable packing of DMPC and DMPG that renders a slow response to changes in chemical potential and structural transformation at low concentrations. Further work on stable structures obtained via various pathways in systems with the same chemical composition is needed to understand the formation mechanism of these ULV. Such an understanding may then facilitate the design of ULV for prolonged stability and encapsulation needed for pharmaceutical and biomedical applications.
Acknowledgment. We thank the instrument scientists at
NCNR NG7 for their assistance. C.-Y.H. is grateful for the financial support of the SBR grant from NJIT. J.K. and M.-P.N. are grateful for funding from the Advanced Foods and Materials network in Canada. Also, we acknowledge an insightful discussion with Dr. V. A. Rughunathan (Raman Research Institute).
References and Notes
(1) Kaler, E. W.; Murthy, A. K.; Rodrigues, B. E.; Zasadzinski, J. A.
Science 1989, 245, 1371.
(2) Kaler, E. W.; Herrington, K. L.; Murthy, A. K.; Zasadzinski, J. A.
J. Phys. Chem. 1992, 96, 6698.
(3) Murthy, A. K.; Kaler, E. W.; Zasadzinski, J. A. J. Colloid Interface
Sci. 1991, 145, 598.
(4) Hoffmann, H.; Thunig, C.; Munkert, U. Langmuir 1992, 8, 2629. (5) Hoffmann, H.; Munkert, U.; Thunig, C.; Valinente, M. J. Colloid
Interface Sci. 1994, 163, 217.
(6) Yatcilla, M. T.; Herrington, K. L.; Brasher, L. L.; Kaler, E. W.; Chiruvolu, S.; Zasadzinski, J. A. J. Phys. Chem. 1996, 100, 5874.
(7) Bergstro¨m, M. Langmuir 1996, 12, 2454.
(8) Bergstro¨m, M.; Eriksson, J. C. Langmuir 1996, 12, 624. (9) Bergstro¨m, M.; Eriksson, J. C. Langmuir 1998, 14, 288. (10) Bergstro¨m, M.; Pedersen, J. S.; Schurtenberg, P.; Egelhaaf, S. U.
J. Phys. Chem. B 1999, 103, 9888.
(11) Bergstro¨m, M.; Pedersen, J. S. J. Phys. Chem. B 2000, 104, 4155. (12) Bergstro¨m, M. J. Colloid Interface Sci. 2001, 240, 294. (13) Viseu, M. I.; Edwards, K.; Campos, C. S.; Costa, S. M. Langmuir 2000, 16, 2105.
(14) Lasic, D. TIBTECH 1998, 16, 307.
(15) Lasic, D. D.; Joannic, R.; Keller, B. C.; Frederik, P. M.; Auvray, L. AdV. Colloid Sci. 2001, 89-90, 337.
(17) Ollivon, M.; Lesieur; S.; Grabrielle-Madelmont, C.; Paternotre, M.
Biochim. Biophys. Acta 2000, 1508, 34.
(18) Schurtenberger, P.; Mazer, N.; Waldvogel, S.; Kanzig, W. Biochim.
Biophys. Acta 1984, 775, 111.
(19) Schurtenberger, P.; Mazer, N.; Kanzig, W. J. Phys. Chem. 1985,
89, 1042.
(20) Egelhaaf, S. U.; Schurtenberger, P. Phys. ReV. Lett. 1999, 82, 2804. (21) Andelman, D.; Kozlov, M. M.; Helfrich, W. Europhys. Lett. 1994,
25, 231.
(22) Lesieur, P.; Kiselev, M. A.; Barsukov, L. I.; Lombardo, D. J. Appl.
Crystallogr. 2000, 33, 623.
(23) Nieh, M.-P.; Glinka, C. J.; Krueger, S.; Prosser, R. S.; Katsaras, J.
Langmuir 2001, 17, 2629.
(24) Nieh, M.-P.; Glinka, C. J.; Krueger, S.; Prosser, R. S.; Katsaras, J.
Biophys. J. 2002, 82, 2487.
(25) Nieh, M.-P.; Harroun, T. A.; Raghunathan, V. A.; Glinka, C. J.; Katsaras, J. Phys. ReV. Lett. 2003, 91, 158105.
(26) Nieh, M.-P.; Harroun, T. A.; Raghunathan, V. A.; Glinka, C. J.; Katsaras, J. Biophys. J. 2004, 86, 2615.
(27) Seelig, J.; MacDonald. P. M.; Scherer, P. G. Biochemistry 1987,
26, 7535.
(28) Kurland, R.; Newton, C.; Nir, S.; Papahadjopoulos, D. Biochimica
Biophys. Acta 1979, 551, 137.
(29) Helfrich, W. Z. Naturforsch. 1973, 28C, 693-703.
(30) Winterhalter, M.; Helfrich W. J. Phys. Chem. 1988, 92, 6865. (31) Winterhalter, M.; Helfrich W. J. Phys. Chem. 1992, 96, 327. (32) Lekkerkerker, H. N. W. Physica 1989, A159, 319.
(33) Lekkerkerker, H. N. W. Physica 1990, A167, 384.
(34) Mitchell, D. J.; Ninham B. W. Langmuir 1989, 5, 1121. (35) Kumaran, V. Phys. ReV. E 2001, 64, 051922.
(36) Safran, S. A.; Pincus, P.; Andelman, D.; Mackintosh, F. C. Phys.
ReV. A 1991, 43, 1071.
(37) Safran, S. A.; Pincus, P.; Andelman, D. Science 1990, 248, 354. (38) Oberdisse, J.; Couve, C.; Appell, J.; Berret, J. F.; Ligoure, C.; Porte, G. Langmuir 1996, 12, 1212.
(39) Oberdisse, J.; Porte, G. Phys. ReV. E 1997, 56, 1965. (40) Oberdisse, J. Eur. Phys. J. B 1998, 3, 463.
(41) Israelachvili, J. N.; Mitchell, D. J.; Ninham, B. W. Faraday Trans. 1976, 72, 1525.
(42) Israelachvili, J. N.; Mitchell, D. J.; Ninham, B. W. Biochim.
Biophys. Acta 1977, 470, 185.
(43) Nagarajan, R.; Ruckenstein, E. J. Colloid Interface Sci. 1979, 71, 580.
(44) Yuet, P. K.; Blankschtein, D. Langmuir 1996, 12, 3802. (45) Yuet, P. K.; Blankschtein, D. Langmuir 1996, 12, 3819. (46) Leng, J.; Egelhaaf, U.; Cates, M. E. Europhys. Lett. 2002, 59, 311. (47) Leng, J.; Egelhaaf, U.; Cates, M. E. Biophys. J. 2003, 85, 1624. (48) Hayter, J. B.; Penfold, J. Molecular Phys. 1981, 42, 109. (49) Provencher, S. W. Comput. Phys. Commun. 1982, 27, 229. (50) Koynova R.; Caffrey, M. Biochim. Biophys. Acta 1998, 91, 1376. (51) Brasher, L. L.; Kaler, E. W. Langmuir 1996, 12, 6270. (52) Marques, E. F. Langmuir 2000, 16, 4798.
(53) Iampietro, D. J.; Kaler, E. W. Langmuir 1999, 15, 8590. (54) The identification of any commercial product or trade name does not imply endorsement or recommendation by the National Institute of Standards and Technology (NIST).