HAL Id: hal-02961394
https://hal.univ-lorraine.fr/hal-02961394
Submitted on 1 Dec 2020HAL is a multi-disciplinary open access
archive for the deposit and dissemination of sci-entific research documents, whether they are pub-lished or not. The documents may come from teaching and research institutions in France or abroad, or from public or private research centers.
L’archive ouverte pluridisciplinaire HAL, est destinée au dépôt et à la diffusion de documents scientifiques de niveau recherche, publiés ou non, émanant des établissements d’enseignement et de recherche français ou étrangers, des laboratoires publics ou privés.
Distributed under a Creative Commons Attribution| 4.0 International License
Ametryn detection by proton assisted transfer at a
single micro-interface between two immiscible
electrolyte solutions
Guofeng Lu, Christelle Despas, Liang Liu, Grégoire Herzog
To cite this version:
Guofeng Lu, Christelle Despas, Liang Liu, Grégoire Herzog. Ametryn detection by proton assisted transfer at a single micro-interface between two immiscible electrolyte solutions. Journal of Electroan-alytical Chemistry, Elsevier 2020, 877, pp.114745. �10.1016/j.jelechem.2020.114745�. �hal-02961394�
1
Ametryn detection by proton assisted
transfer at a single micro-interface between
two immiscible electrolyte solutions
Guofeng Lu, Christelle Despas, Liang Liu, Grégoire Herzog*
Université de Lorraine, CNRS, LCPME, F -54000 Nancy, France *Corresponding author: gregoire.herzog@univ -lorraine.fr
This document is a postprint. Final version has been published in Journal of the Electroanalytical
Chemistry 2020, 877, 114745 (https://doi.org/10.1016/j.jelechem.2020.114745).
Abstract:
Ion transfer at micro-interfaces formed between two immiscible electrolyte solutions (µITIES) is a powerful platform for the detection of charged species. Ametryn is used as a model target analyte to investigate the detection at µITIES of lipophilic and ionisable herbicides derived from triazine. A two-step detection method is proposed, which is taking advantage of the spontaneous partition of triazine derivatives at open-circuit potential, and of their ability to assist proton transfer across the interface. First, the neutral form of ametryn is accumulated in a small volume of organic phase (Vorg = 50 µL) at
open-circuit potential, which leads to its preconcentration (Vaq >> Vorg). In a second step, AC
voltammetry was run to allow the limit of detection to reach sub-micromolar levels of ametryn in 3 river samples. Phosphate buffer was added to the real samples to provide a constant supply of proton for ametryn detection. The excess of buffer ensured that the analytical response was proportional to the ametryn concentration.
2
1. Introduction
The improvement of sensitivity and the lowering of detection limits at the interface between two immiscible electrolyte solutions (ITIES) are a constant drive for the development of new accumulation and preconcentration procedures. Stripping voltammetry at the ITIES has taken advantage through the preconcentration of ions close to the interface during the accumulation period [1,2]. It is achieved by the application of a potential difference across the interface and with the help of an ionophore [3,4] or of the organic electrolyte anion [5–9], which lower the Gibbs free energy of transfer to allow ion transfer within the potential window available. Stripping voltammetric detection at the ITIES was reported for choline [10], oligopeptides [3], food additives [4], protein digests [9], and proteins such as hen-egg-white-lysozyme [5], insulin [6], amylin [7], and haemoglobin [8]. Stripping voltammetric methods at the ITIES can be accompanied with the miniaturisation of the ITIES down to the micro- and to the nanoscale to benefit from the improved mass transfer due to radial diffusion and to the reduced iR drop and capacitive current [11–14]. However, such an accumulation method is not suited for non-charged species present in environmental samples, such as many pesticides. We propose here a method for the accumulation and the detection of neutral lipophilic molecules at the ITIES, using ametryn as a model molecule. Ametryn (AME) is a selective herbicide of the triazine family used in fruits and vegetables farming, which does not degrade easily and can accumulate in soil and in natural waters [15,16]. Because of its relatively high solubility in water (209 mg L-1 at 25 °C), residues of ametryn are found in rivers
causing concern for drinking water. Triazine detection and quantification can be achieved by high performance liquid chromatography [17–19], surface-enhanced Raman spectroscopy [20] and by electrochemical methods [21–32]. Triazine molecules are reduced at mercury [22,25,26], carbon [29–32] and gold [23] electrodes, or oxidised at gold electrodes [24,27,28]. Reduction of ametryn is occurring at a potential of -1.0 V [22], overlapping with the reduction of dissolved oxygen, and thus requiring the purging with nitrogen to avoid interferences from oxygen. Electrochemical detection of triazine is also possible at the ITIES by ion transfer voltammetry [33–35]. Such an electrochemical mechanism does not involve electron transfer and is not hindered by the presence of dissolved oxygen. However, species need to be in an ionic form to be detectable at the ITIES. Triazines are lipophilic weak bases, which require very acidic conditions (pH < 2) to be fully protonated.
We report here a protocol for the accumulation and detection of lipophilic molecules at a single µITIES supported by a glass capillary, using AME as a model target analyte (pKa = 4.1, log P = 2.63 [36]). This protocol could be generalised to molecules with the following properties: they should (i) be lipophilic (log P >> 0), and (ii) and they should be neutral around pH 7 (pKa < 7) and susceptible to be protonated. The protocol is based on the accumulation of AME from a solution close to neutral
3 pH into an organic phase through spontaneous transfer at open-circuit potential. For the second step, the capillary containing the organic phase is transferred to a mildly acidic (pH 3) AME-free solution for a voltammetric detection through proton transfer assisted by AME. The presence of neutral molecules dissolved in the organic phase can indeed facilitate the transfer of proton across the interface by lowering the Gibbs free energy of transfer [37–45].
We propose here to use the proton transfer, assisted by the AME preconcentrated in the organic phase, as the analytical signal, allowing the accumulation and detection neutral species by electrochemistry at the ITIES.
2. Experimental Section
Chemicals & Reagents: The organic phase electrolyte was 1,2-dichloroethane (1,2-DCE, 99%
Sigma-Aldrich) containing 10 mM Bis (triphenylphosphoranylidene) ammonium tetrakis (4-chlorophenylborate) (BA+TPBCl−). The organic salt was prepared by metathesis of Bis
(triphenylphosphoranylidene) ammonium chloride (BA+Cl−, 97% Aldrich) and potassium tetrakis
(4-chlorophenylborate) (K+TPBCl−, 98% Fluka). All aqueous solutions were prepared in purified water
(resistivity of 18.2 MΩ cm). For pH adjustment, solutions of HCl or NaOH were used. Sodium chloride (NaCl, 99% Aldrich) was used as the aqueous phase electrolyte. Ametryn (AME, 99%) was obtained from Sigma-Aldrich and used without further purification. Stock solutions of 2 mM AME in ethanol were prepared and stored in the dark at 4°C. 50 mM tetramethylammonium chloride (TMA+Cl-, 98% Aldrich) was prepared in water to characterise the size of single pore capillary. 50
mM tetrabutylammonium chloride (TBA+Cl-, 97% Aldrich) was also prepared in water and was used
to calibrate the half-wave Galvani potential of AME. Real samples were spring waters collected in the watershed of the Strengbach River (Vosges, France). They were stored at 4°C and filtered using 0.22 µm filter from Millipore before electrochemical and ion chromatography experiments. Electrochemical analyses were performed in these samples spiked with ametryn at selected concentrations.
Preparation of capillaries: µITIES is established by pulling borosilicate glass capillaries, (inner
diameter = 0.86 mm and outer diameter was 1.5 mm) according to the fabrication protocol described by Stockmann et al [46]. Briefly, a home-made vertical capillary puller was used to seal through heating the capillary, which contained a gold wire (Ø = 50 µm). The capillary was split into two pieces, each contained a piece of the sealed gold wire. The capillary was then placed in an aqua regia solution of 3:1 HCl (36.5-38.0 %, Aldrich): HNO3 (70 %, Aldrich), which dissolved the gold wire
leaving a microchannel of uniform diameter. After rinsing thoroughly with water, the µITIES tip was polished with sandpaper (granulation: 4000). The inside walls of the capillary were silanized with
4 chlorotrimethylsilane (98%, Aldrich) prior cyclic voltammetry experiments to prevent the leakage of the organic phase.
Electrochemical Measurements: Cyclic voltammetry (CV) was performed with a potentiostat
(302N) controlled by NOVA software (Version 1.11) from Autolab (Netherlands). All the measurements were done in customary set-up for ion transfer voltammetry with a silver wire serving as both a pseudo-reference electrode and a counter electrode for the organic phase. For the aqueous phase, a platinum mesh was used as a counter electrode, a silver-silver chloride wire (Ag | AgCl) as a reference electrode. All measurements were carried out at room temperature (25°C). The potential scale was calibrated with the ion transfer of TBA+, whose formal transfer
potential at the aqueous – DCE interface was established at ∆𝑜𝑤𝜙𝑇𝐵𝐴0 + = −0.270 V (∆𝐺𝑇𝐵𝐴0 + = −26 𝑘𝐽 𝑚𝑜𝑙−1) [47].
AC voltammetry experiments were measured with an Autolab PGSTAT302N (Metrohm), equipped with a FRA32 frequency response analyzer, connected to the electrochemical cell. The potentiostat was controlled by NOVA 2.1.4 software. The frequency selected was 1 Hz, the amplitude was 10 mV, and the step potential was 10 mV. We assumed that the electrochemical cell behaves as a Randles circuit. The analytical signal, Y, used to plot the AC voltammograms was determined by equation (1), as it was described previously [48]:
𝑌 = − 106
𝜔𝑍𝐼𝑚𝐴− 𝐶𝑑 (1)
where is the angular frequency (rad s-1), Z
Im is the imaginary part of the impedance (), A is the
surface area of the interface (A = 1.96 × 10⁻⁵ cm2) and C
d is the double layer capacitance (µF cm-2)
determined in the absence of analyte.
Ion chromatography analysis: Both anionic and cationic compositions of real samples were
determined by ion chromatography using a Metrohm 882 Compact IC plus instrument with a conductivity detector. A high-pressure pump, sequential (Metrohm CO2 suppressor MCS) and
chemical (Metrohm suppressor MSM II for chemical) suppression modules were installed on the instrument. The cation separation was performed on a Metrosep C6-150/4.0 column packed with silica gel particles functionalized with carboxyl groups (5 µm particles diameter) and preceded by a guard column (Metrosep C6/4.0 guard) and an RP 2Guard column to remove traces of organic compounds. The mobile phase consisted of a solution of HNO3 (1.7 mmol L-1) and picolinic acid (1.7
mmol L-1) in ultrapure water (18.2 MΩ cm at 293 K). The flow rate was 0.9 mL min-1 and the sample
loop volume was 5 µL. Phosphate determination was performed on a MetrosepA Supp 16-250/4.0 column packed with quaternary ammonium-functionalized polystyrene-divinylbenzene copolymer (4.6 µm particles diameter) and preceded by a guard column (Metrosep A supp 16Guard/2,0) and
5 an RP 2Guard column to remove traces of organic compounds. The mobile phase consisted of a solution of Na2CO3 (7.5 mmol L-1) and NaOH (0.75 mmol L-1) in ultrapure water (18.2 MΩ cm at 293
K). The flow rate was 0.8 mL min-1, and the sample loop volume was 20 µL. The MagIC Net™ 2.3
Professional chromatography software controlled the 882 Compact IC plus instrument and its peripherals.
3. Results and Discussion
3.1 Ametryn transfer voltammetry at µITIES
The electrochemical behavior of AME at a single µITIES was investigated by cyclic voltammetry. In pH conditions where AME was protonated, AMEH+, (pH << pK
a), the direct transfer of AMEH+ from
the aqueous phase to the organic phase was observed (Equation 1). The direct ion transfer was confirmed by the asymmetric diffusion profile of the cyclic voltammogram (Figure 1A).
𝐴𝑀𝐸𝐻𝑎𝑞+ ↔ 𝐴𝑀𝐸𝐻𝑜𝑟𝑔+ (I)
In the forward scan, the current reached a steady-state due to the radial diffusion of AMEH+ towards
the µITIES. On the reverse scan, the transfer current took the shape of a peak, linked to the linear diffusion of the AMEH+ in the organic phase, restricted by the side walls of the glass capillary. At pH =
1.1, the transfer potential for AMEH+, ∆
𝑜 𝑤𝜙
𝐴𝑀𝐸𝐻+ 1/2
6
Figure 1. Cyclic voltammetry of AME (A) at pH 1.1 ([AME] = 320 µM); (B) at pH 2.1 ([AME] = 70 µM);
(C) at pH 4 ([AME] = 50 µM). = 10 mV s-1.
When the pH was raised to 2.1, the shape of the voltammogram changed to a peak-shaped response on both forward and reverse scans (Figure 1B), indicating that a linear diffusion is limiting ion transfer. This change of diffusion profile was linked to a different transfer mechanism. With the increase of pH, the neutral form of AME transferred spontaneously to the organic phase and assisted the transfer of protons to the organic phase according to the following reaction:
𝐴𝑀𝐸𝑜𝑟𝑔+ 𝐻𝑎𝑞+ ↔ 𝐴𝑀𝐸𝐻𝑜𝑟𝑔+ (II)
In such conditions, the proton assisted transfer was limited by the linear diffusion of AME in the organic phase, conferring the peak-shaped voltammograms in both forward and reverse scans. These observations were confirmed by the scan rate studies conducted for 320 µM AME at pH 1.1 and 70 µM at pH 2.1 (Figure 2). At pH 1.1, the asymmetric behaviour was preserved when the scan rate increased. The limiting current for the direct transfer of AMEH+ was constant although the reverse peak current
was linear with the square root of the scan rate. At pH 2.1, both forward and reverse currents varied linearly with the square root of the scan rate, confirming limitation of the diffusion of AME in the organic side.
Figure 2.
Cyclic voltammetry of AME (A) at pH 1.1 ([AME] = 320 µM); (B) at pH 2.1 ([AME] = 70 µM). Scan rates were 10, 15, 20, and 25 mV s-1.When pH was further increased to pH 4, the shape of the voltammogram showed again an asymmetric diffusion profile (Figure 1C), although it was still associated to the proton transfer assisted by AMEorg.
However, the low concentration of H+ became the limiting factor and was determining the CV shape.
On the forward scan, the transfer current reached a steady state, resulting from the radial diffusion of H+ in the aqueous phase.
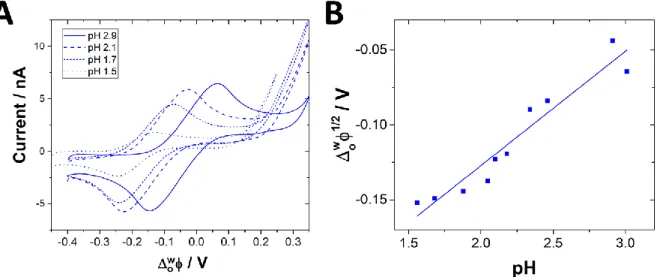
7 The influence of pH on the electrochemical behaviour of AME was then investigated by cyclic voltammetry for gradually increasing pH values from 1.1 to 2.9 (Figure 3). The transfer current increased with the pH and the transfer potential is shifted towards more positive potential difference values. When pH > pKa – log P, the variation of transfer potential should vary linearly with the pH with a slope of 2.3𝑅𝑇
𝑧𝐹 where R was the universal gas constant (in J K
-1 mol-1), T the temperature (in K), z the
charge transferred (+1) and F the Faraday constant (96485.15 C). The slope of the variation of transfer potential was measured at 76 mV per pH unit, which is greater than the theoretical slope of 59 mV per pH unit (Figure 3B). However, this variation of transfer potential with pH is supporting the assisted proton transfer in these pH conditions.
Figure 3. (A) Cyclic voltammograms obtained for variable pH value (from pH1 to pH3) of aqueous
solution within 70µM AME. (B) Evolution of the half-wave potential of transfer of AME as a function of pH.
For an initial concentration of 70 µM of AME in the aqueous phase, a transfer current of 0.69 nA was recorded at pH 1.1, while it rose to 6.2 nA at pH 2.9 for the same concentration. This important increase of transfer currents found their origin in the asymmetric diffusion profiles observed at µITIES, as well as in the volume differences between the organic and the aqueous phases. Variation of peak current as a function of pH was also observed at macroITIES for prometryn, another molecule of the triazine family [33], yet in that report, the peak current decreased as the pH increased. The difference of this trend with the one observed for AME at µITIES, was due to the difference of volume ratios between the organic and aqueous phases. In the case of macroITIES, the volume ratio is close to 1, so the spontaneous transfer of prometryn to the organic phase led to a prometryn concentration in the organic phase lower than in the aqueous phase, while, here, the concentration of [AME]org rose
significantly as the volume of the organic phase, Vorg, was smaller than the volume of the aqueous
8 3.2 AME distribution across the liquid-liquid interface
When dissolved in an aqueous solution, AME was dissociated according to reaction (III), for which the dissociation constant, Ka, was written as described by equation (2).
𝐴𝑀𝐸𝐻
𝑎𝑞+↔ 𝐴𝑀𝐸
𝑎𝑞+ 𝐻
𝑎𝑞+(III)
𝐾
𝑎=
[𝐴𝑀𝐸]𝑎𝑞[𝐻 +] 𝑎𝑞 [𝐴𝑀𝐸𝐻+] 𝑎𝑞(2)
Since AME is a lipophilic molecule, its neutral form was distributed spontaneously between the organic and aqueous phase as follows:
𝐴𝑀𝐸
𝑎𝑞↔ 𝐴𝑀𝐸
𝑜𝑟𝑔(IV)
𝑃 =
[𝐴𝑀𝐸]𝑜𝑟𝑔[𝐴𝑀𝐸]𝑎𝑞
(3)
Equation (4) describes the mass conservation:
𝑉𝑜𝑟𝑔∗ [𝐴𝑀𝐸]𝑜𝑟𝑔+ 𝑉𝑎𝑞∗ [𝐴𝑀𝐸]𝑎𝑞+ 𝑉𝑎𝑞∗ [𝐴𝑀𝐸𝐻+]𝑎𝑞 = 𝑛 (4)
Where n was the total number of moles initially present in the system, Vorg and Vaq were the volumes
of the organic and aqueous phases, respectively. Previous studies have investigated the effect of the ratio of the volumes of the two phases on the transfer potential and current at either macroscopic ITIES [43,49–54] and thick film modified electrodes [55,56]. By combining equations (2), (3) and (4), we can express the concentrations [AME]aq, [AME]org and [AMEH+]aq at equilibrium. We assumed that in
the absence of the application of interfacial potential, the protonated species AMEH+ and H+ were only
present in the aqueous phase due to their negligible solubility in the organic phase.
[𝐴𝑀𝐸]
𝑎𝑞=
𝑛𝐾𝑎 𝐾𝑎(𝑃𝑉𝑜𝑟𝑔+𝑉𝑎𝑞)+[𝐻+]𝑎𝑞𝑉𝑎𝑞(5)
[𝐴𝑀𝐸𝐻
+]
𝑎𝑞=
𝑛[𝐻+]𝑎𝑞 𝐾𝑎(𝑃𝑉𝑜𝑟𝑔+𝑉𝑎𝑞)+[𝐻+]𝑎𝑞𝑉𝑎𝑞(6)
[𝐴𝑀𝐸]
𝑜𝑟𝑔=
𝑛𝑃𝐾𝑎 𝐾𝑎(𝑃𝑉𝑜𝑟𝑔+𝑉𝑎𝑞)+[𝐻+]𝑎𝑞𝑉𝑎𝑞(7)
The distribution of AME in the biphasic system as a function of pH was shown in Figure 4 using the following experimental conditions: n = 25 nmol, Vaq = 2 mL and Vorg = 50 µL. With pH ranging from 0 to
6, three domains were identified: (i) a low pH domain where the predominating form of AME was AMEH+
aq; (ii) a medium pH domain where the neutral form of AME in the organic phase dominated but
[AME]org remained lower than [H+]aq; (iii) and a high pH domain where [AME]org > [H+]aq. The boundaries
of domains were marked by the following equations:
[AMEH
+]
aq
= [AME]
org(8)
[𝐻
+]
9 The equation (11) was observed when:
𝑝𝐻 = 𝑝𝐾𝑎 − 𝑙𝑜𝑔 𝑃 (10)
indicating that this limit was independent of the volumes Vorg and Vaq. When pH < pKa-log P, the
electrochemical signal was the result of the direct transfer of 𝐴𝑀𝐸𝐻𝑎𝑞+, resulting in the steady state voltammogram (as shown in Figure 1). The limiting current, Ilimiting, was defined by equation
𝐼𝑙𝑖𝑚𝑖𝑡𝑖𝑛𝑔= 4𝑧𝐹𝐷𝑎𝑞𝐴𝑀𝐸𝐻 +
[𝐴𝑀𝐸𝐻+]
𝑎𝑞𝑟 (11)
Although Ilimiting is directly proportional to the [𝐴𝑀𝐸𝐻+]𝑎𝑞, the very acidic conditions for the detection
of AMEH+ via direct transfer are not preferred.
Figure 4. Concentration distribution of [AME]org (blue line based on equation 7), [AMEH+]aq (red line
based on equation 6), [AME]aq (black line based on equation 5), and [H+]aq (green line). n = 25 nmol, Vaq
= 2 mL and Vorg = 50 µL.
However, the upper limit of the second domain (shown in Figure 4) is the solution of the quadratic equation:
𝑉
𝑎𝑞([𝐻
+]
𝑎𝑞𝑙𝑖𝑚)
2+ 𝐾
𝑎(𝑃𝑉
𝑜𝑟𝑔+ 𝑉
𝑎𝑞)[𝐻
+]
𝑎𝑞𝑙𝑖𝑚− 𝑛𝑃𝐾
𝑎= 0
(12)
[𝐻
+]
𝑎𝑞 𝑙𝑖𝑚=
−𝐾𝑎(𝑃𝑉𝑜𝑟𝑔+𝑉𝑎𝑞)+√𝐾𝑎 2(𝑃𝑉 𝑜𝑟𝑔+𝑉𝑎𝑞) 2 +4𝑛𝑃𝐾𝑎𝑉𝑎𝑞 2𝑉𝑎𝑞(13)
When pKa-log P < pH < pHlim, the electrochemical signal was the result of the proton facilitated by the
neutral form of AME dissolved in the organic phase, AMEorg. As in this pH range, [H+]aq > [AME]org, the
transfer current is proportional to the [AME]org:
𝐼𝑝= 2.69 × 10⁵𝑧3/2𝐴(𝐷𝑜𝑟𝑔𝐴𝑀𝐸) 1/2
10 When the Vorg tends to 0, the upper limit depends on the initial concentration, [𝐴𝑀𝐸]𝑎𝑞𝑖𝑛𝑖 = 𝑛/𝑉𝑎𝑞,
which is given by equation (15):
𝑙𝑖𝑚 𝑉𝑜𝑟𝑔→0[𝐻 +] 𝑎𝑞 𝑙𝑖𝑚 =−𝐾𝑎+√𝐾𝑎 2+4[𝐴𝑀𝐸] 𝑎𝑞 𝑖𝑛𝑖𝑃𝐾 𝑎 2 (15)
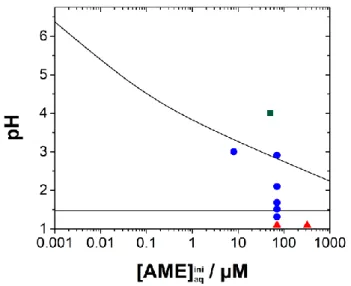
The evolution of pHlim as a function of
[𝐴𝑀𝐸]
𝑎𝑞𝑖𝑛𝑖 was plotted in Figure 5 and the three domains weredefined by equations (10) and (15).
Figure 5. Distribution of the three domains as a function of the pH and [𝐴𝑀𝐸]𝑎𝑞𝑖𝑛𝑖. The solid lines separating the domains were established with equations (10) and (15). The shape of the data points represents the types of ion transfer observed experimentally: () AMEH+ ion transfer, () H+ assisted
by AMEorg, and () H+ limited assisted transfer.
When pH > pHlim, [H+]aq < [AME]org so the proton assisted transfer is limited by the proton
concentration. As a result, a steady state voltammogram is observed and the limiting current is given by the following equation:
𝐼𝑙𝑖𝑚𝑖𝑡𝑖𝑛𝑔= 4𝑧𝐹𝐷𝑎𝑞𝐻 +
[𝐻+]
𝑎𝑞𝑟 (16)
The analysis above could qualitatively explain the shape of voltammogram of AME at different pH. It may also provide an estimation on the limiting current of peak current. Nevertheless, it should also be noted that the actual condition is a mixed transfer of [AMEH+]
aq, [AME]aq and [H+], so the current
expressions are valid only under strict approximations when only one ion is considered, and they should not be overinterpreted.
3.3 Proton transfer assisted by ametryn in buffered solutions
Results shown in section 3.2 have demonstrated that both accumulation and peak current for the proton assisted transfer are pH-dependent. Accumulation will be optimal at pH >> pKa, and ametryn detection will be optimal at pH < pHlim as defined by equation (15). Such contradictory conditions would
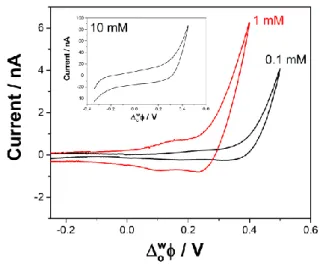
11 require a time-consuming two-step protocol. Furthermore, detection conditions would vary greatly with the nature of the target analytes pKa and P. To circumvent these limitations, we have investigated the effect of the addition of buffer to the aqueous solution. The presence of buffer in the aqueous solution ensures a constant concentration of protons available for the transfer across the interface. Figure 5 shows the cyclic voltammograms of 8 µM ametryn initially dissolved in the aqueous phase at pH 6.8, 0.1, 1, and 10 mM phosphate buffer. At 0.1 mM phosphate buffer, the proton transfer assisted by ametryn was not observed. The buffer concentration was not high enough and limited the transfer reaction. However, when the phosphate buffer concentration was 1 mM, a peak for the transfer of 8 µM ametryn was observed, and thus allowing the one-step detection of ametryn. Increasing the concentration of phosphate buffer to 10 mM resulted in a loss of ametryn signal due to the rise of background current (inset of Figure 5). All subsequent experiments were done in the presence of 1 mM phosphate buffer (pH 6.8).
Figure 6. Cyclic voltammograms of 8 µM AME in a 10 mM LiCl aqueous solution containing 0.1 (red
curve), 1 (black curve) and 10 mM (inset) phosphate buffer. Scan rate was 10 mV s-1. The CVs were
recorded after the electrochemical cell was left 30 min at open-circuit potential to reach equilibrium.
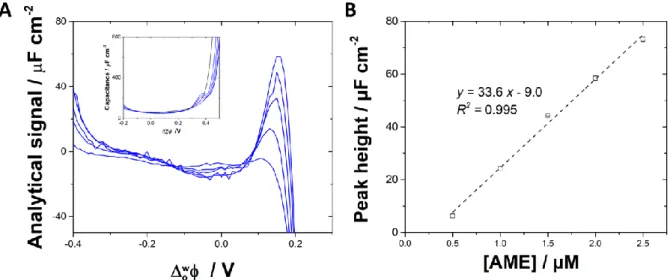
A more sensitive electrochemical method was required to overcome the mediocre limit of detection reached with cyclic voltammetry (Figure 6). Recently, AC voltammetry was described by Suárez-Herrera and Scanlon [48] as an quantitative analytical method at the ITIES. It was used here to improve the sensitivity of the ametryn detection (Figure 7). The frequency of the AC signal was set at a value of 1 Hz, which favoured the Faradaic response of the proton assisted transfer limited by AME diffusion in the organic phase. An electrochemical cell was set with 10 mM LiCl + 1 mM phosphate buffer as an aqueous phase. A blank cyclic voltammogram and a blank AC voltammogram were recorded prior to additions of ametryn to the aqueous phase. After each ametryn addition, AC voltammograms were
12 recorded after 30 minutes of waiting time at open-circuit potential to allow the partition of neutral lipophilic ametryn to reach equilibrium. AC voltammograms for ametryn concentrations ranging from 0.5 to 2.5 µM are shown in Figure 7. A peak at 0.16 V, corresponding to the proton transfer assisted by AME, was measured and its height increased linearly with the concentration of AME (Figure 7B). The sensitivity of 33.6 µF cm-2 µM-1 allowed to reach a limit of detection of 0.2 µM (calculated as 3 times
the standard deviation divided by the sensitivity). Such a limit of detection is 40 times lower than with cyclic voltammetry.
Figure 7. (A) Background subtracted AC voltammograms for increasing concentrations of AME (0.5 –
2.5 µM) in the aqueous phase (10 mM LiCl + 1 mM phosphate buffer, pH 6.8). Experiments were done in triplicate. Inset: AC voltammograms before background subtraction. (B) Calibration curve for AME obtained from the AC voltammograms. Error bars are smaller than symbols when not visible.
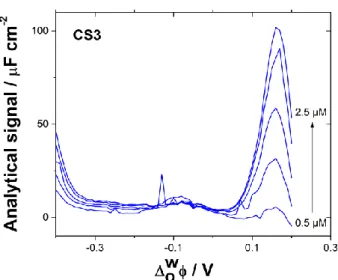
Three river water samples (CS3, CS4 and SG) were then analysed by AC voltammetry. The ionic composition of the three river samples was determined by ion chromatography. Phosphate concentration was measured at 27.7 µM for CS3 and below the limit of detection for ion chromatography for the other two samples (CS4 and SG). Since the phosphate concentration in the samples was naturally insufficient, 1 mM phosphate buffer was added, and the pH was set 6.8. AC voltammograms for increasing concentrations are shown after subtraction of the blank (Figure 8). As for the model solution, the analytical signal increased linearly with the concentration of AME in the aqueous phase for all three real samples investigated. Analytical figures of merit for the real samples are gathered in Table 1.
13
Figure 8. AC voltammograms for increasing spiked concentrations of AME (0.5 – 2.5 µM) in real sample
CS3 from the Strengbach river (Vosges, France). 1 mM phosphate buffer (pH 6.8) was added to the sample. 30 minutes of waiting time after each addition prior to AC voltammetry run. The voltammograms were background subtracted.
Concentrations of Li+, Na+, NH
4+, K+ were also determined by ion chromatography since the presence
of those ions could interfere with proton assisted transfer. Their concentrations in the samples tested are given in Table 1. Among those four cations found naturally in the river samples, NH4+ has the lowest
standard transfer potential with ∆𝑜𝑤𝜙𝑁𝐻4+
0 = 0.531 V and is hence the most likely to interfere with the proton assisted transfer. The standard transfer potential of K+ is slightly higher with ∆
𝑜 𝑤𝜙 𝐾+ 0 = 0.542 V, followed by Na+ (∆ 𝑜 𝑤𝜙 𝑁𝑎+ 0 = 0.606 V) and Li+ (∆ 𝑜 𝑤𝜙 𝐿𝑖+ 0 = 0.620 V) [57]. For Li+, K+ and NH 4+, the
concentrations are between 3.6 and 37.2 µM. The natural concentrations of these three ions did not significantly alter the limits of detection achieved as they were comprised in the range 0.2 < LOD < 0.31 µM. The real samples tested were naturally more concentrated in Na+, but the concentration was
artificially increased to 1.5 mM due to the addition of the sodium salt of the phosphate buffer. The proximity of the proton transfer assisted by AME with the Na+ transfer may hamper the limit of
detection.
Table 1: Analytical performance and chemical composition of the solution analysed.
Analytical performances
Cation concentration
Sensitivity
µF cm
-2µM
-1Dynamic
range
µM
R
2LOD
aµM
[Li
+]
[Na
+]
[NH
4+] [K
+]
14
Model
solution
33.6 0.5 – 2.5 0.995 0.20 10 mM 1.49 mM 0 0CS3
b 46.3 0.5 – 2.5 0.994 0.22 --c 96.6 µMd --c 3.6 µMCS4
b 26.9 0.5 – 2.5 0.994 0.31 --c 96.1 µMd --c 11.6 µMSG
b 22.3 0.5 – 2.5 0.988 0.27 37.2 µM 104.7 µMd 5.2 µM 3.7 µMa: Limit of detection was calculated as 3 times the standard deviation of the intercept divided by the
sensitivity. b: These sample names correspond to sampling points on the Strengbach river. c:
concentration below the limit of detection of ion chromatography. d: determined by IC before addition
of phosphate buffer.
4. Conclusion
We investigated the cyclic voltammetry of cationic lipophilic model target analyte, ametryn, at a single µITIES as a function of pH. Both direct ion transfer and proton assisted transfer were observed depending on the pH of the aqueous phase. When pH < pKa – log P, the transfer of direct ion transfer of the protonated ametryn, AMEH+, was predominant. Spontaneous transfer of the neutral form of
ametryn, AME, from the aqueous to the organic phase led to a switch of ion transfer mechanism from direct AMEH+ transfer to H+ transfer assisted by AME
org. The presence of AME in the organic phase
assisted the transfer of H+ across the interface, which was either limited by the diffusion of AME in the
organic phase (when pKa – log P < pH < pHlim) or by the concentration of H+ in the aqueous phase (when
pH > pHlim). Furthermore, the microscopic dimension of the interface and the volume ratio Vaq / Vorg >>
1 favoured the accumulation of AME in the organic phase and a preconcentration effect was thus observed. The addition of 1 mM phosphate buffer to the aqueous phase provided an excess source of protons available to transfer across the ITIES, assisted by the presence of AME in the organic phase. In such conditions, the detection of sub-micromolar concentrations of AME in real samples was possible. This simple protocol may be applicable to lipophilic ionisable molecules and could be implemented for flow-cell analysis [58] or for stripping voltammetry using paper-based electrochemical systems [59].
Acknowledgments
GL is grateful to the China Science Council for sponsoring his PhD (N°201708070029). The authors thank the French PIA project “Lorraine Université d’Excellence” (Reference No. ANR-15-IDEX-04-LUE).
References
15 solutions by means of a hanging electrolyte drop electrode, Anal. Chim. Acta. 141 (1982) 65– 72. https://doi.org/10.1016/S0003-2670(01)95311-5.
[2] V. Mareček, Z. Samec, Determination of calcium, barium and strontium ions by differential pulse stripping voltammetry at a hanging electrolyte drop electrode, Anal. Chim. Acta. 151 (1983) 265–269.
[3] M.D. Scanlon, G. Herzog, D.W.M. Arrigan, Electrochemical Detection of Oligopeptides at Silicon-Fabricated Micro-Liquid∣Liquid Interfaces, Anal. Chem. 80 (2008) 5743–5749. https://doi.org/10.1021/ac800089p.
[4] G. Herzog, V. Kam, A. Berduque, D.W.M. Arrigan, Detection of Food Additives by Voltammetry at the Liquid−Liquid Interface, J. Agric. Food Chem. 56 (2008) 4304–4310.
https://doi.org/10.1021/jf7035966.
[5] E. Alvarez de Eulate, D.W.M.M. Arrigan, Adsorptive Stripping Voltammetry of Hen-Egg-White-Lysozyme via Adsorption–Desorption at an Array of Liquid–Liquid Microinterfaces, Anal. Chem. 84 (2012) 2505–2511. https://doi.org/10.1021/ac203249p.
[6] S. O’Sullivan, E. Alvarez de Eulate, Y.H. Yuen, E. Helmerhorst, D.W.M. Arrigan, Stripping voltammetric detection of insulin at liquid–liquid microinterfaces in the presence of bovine albumin, Analyst. 138 (2013) 6192. https://doi.org/10.1039/c3an01123b.
[7] E. Alvarez De Eulate, S. O’Sullivan, S. Fletcher, P. Newsholme, D.W.M.M. Arrigan, Ion-transfer electrochemistry of rat amylin at the water-organogel microinterface array and its selective detection in a protein mixture, Chem. - An Asian J. 8 (2013) 2096–2101.
https://doi.org/10.1002/asia.201300215.
[8] E. Alvarez de Eulate, L. Serls, D.W.M. Arrigan, Detection of haemoglobin using an adsorption approach at a liquid–liquid microinterface array, Anal. Bioanal. Chem. 405 (2013) 3801–3806. https://doi.org/10.1007/s00216-012-6622-2.
[9] G. Herzog, A. Roger, D. Sheehan, D.W.M. Arrigan, Ion-Transfer Voltammetric Behavior of Protein Digests at Liquid|Liquid Interfaces, Anal. Chem. 82 (2010) 258–264.
https://doi.org/10.1021/ac901909j.
[10] H.J. Lee, C. Beriet, H.H. Girault, Stripping Voltammetric Determination of Choline Based on Micro-Fabricated Composite Membrane., Anal. Sci. 14 (1998) 71–77.
https://doi.org/10.2116/analsci.14.71.
16 Soc. Rev. 40 (2011) 2236. https://doi.org/10.1039/c0cs00168f.
[12] G. Herzog, V. Beni, Stripping voltammetry at micro-interface arrays: A review, Anal. Chim. Acta. 769 (2013) 10–21. https://doi.org/10.1016/j.aca.2012.12.031.
[13] G. Herzog, Recent developments in electrochemistry at the interface between two immiscible electrolyte solutions for ion sensing, Analyst. 140 (2015) 3888–3896.
https://doi.org/10.1039/C5AN00601E.
[14] D.W.M. Arrigan, Y. Liu, Electroanalytical Ventures at Nanoscale Interfaces Between Immiscible Liquids, Annu. Rev. Anal. Chem. 9 (2016) 145–161. https://doi.org/10.1146/annurev-anchem-071015-041415.
[15] A.E. Jacomini, P.B. De Camargo, W.E.P. Avelar, P.S. Bonato, Assessment of ametryn
contamination in river water, river sediment, and mollusk bivalves in São Paulo State, Brazil, Arch. Environ. Contam. Toxicol. 60 (2011) 452–461. https://doi.org/10.1007/s00244-010-9552-z.
[16] Y. Liu, L.Y. Ma, Y.C. Lu, S.S. Jiang, H.J. Wu, H. Yang, Comprehensive analysis of degradation and accumulation of ametryn in soils and in wheat, maize, ryegrass and alfalfa plants, Ecotoxicol. Environ. Saf. 140 (2017) 264–270. https://doi.org/10.1016/j.ecoenv.2017.02.053.
[17] A.R. Koohpaei, S.J. Shahtaheri, M.R. Ganjali, A.R. Forushani, F. Golbabaei, Optimization of solid-phase extraction using developed modern sorbent for trace determination of ametryn in environmental matrices, J. Hazard. Mater. 170 (2009) 1247–1255.
https://doi.org/10.1016/j.jhazmat.2009.05.125.
[18] Y.N. Li, H.L. Wu, X.D. Qing, Q. Li, S.F. Li, H.Y. Fu, Y.J. Yu, R.Q. Yu, Quantitative analysis of triazine herbicides in environmental samples by using high performance liquid
chromatography and diode array detection combined with second-order calibration based on an alternating penalty trilinear decomposition algorithm, Anal. Chim. Acta. 678 (2010) 26–33. https://doi.org/10.1016/j.aca.2010.08.007.
[19] C.G. Zambonin, F. Palmisano, Determination of triazines in soil leachates by solid-phase microextraction coupled to gas chromatography-mass spectrometry, J. Chromatogr. A. 874 (2000) 247–255. https://doi.org/10.1016/S0021-9673(99)01267-4.
[20] Y. Chen, Z.P. Chen, J.W. Jin, R.Q. Yu, Quantitative determination of ametryn in river water using surface-enhanced Raman spectroscopy coupled with an advanced chemometric model, Chemom. Intell. Lab. Syst. 142 (2015) 166–171.
17 https://doi.org/10.1016/j.chemolab.2015.01.012.
[21] D. Guse, M.J. Bruzek, P. DeVos, J.H. Brown, Electrochemical reduction of atrazine: NMR evidence for reduction of the triazine ring, J. Electroanal. Chem. 626 (2009) 171–173. https://doi.org/10.1016/j.jelechem.2008.12.006.
[22] L.M. Ignjatović, D.A. Marković, D.S. Veselinović, B.R. Bešić, Polarographic behavior and determination of some S‐triazine herbicides, Electroanalysis. 5 (1993) 529–533. https://doi.org/10.1002/elan.1140050525.
[23] R. Shoji, T. Takeuchi, I. Kubo, Atrazine sensor based on molecularly imprinted polymer-modified gold electrode., Anal. Chem. 75 (2003) 4882–6.
http://www.ncbi.nlm.nih.gov/pubmed/14674467.
[24] K. Islam, R. Chand, D. Han, Y.S. Kim, Microchip Capillary Electrophoresis Based Electroanalysis of Triazine Herbicides, Bull. Environ. Contam. Toxicol. 94 (2015) 41–45.
https://doi.org/10.1007/s00128-014-1378-3.
[25] L. Pospíšil, R. Trsková, R. Fuoco, M.P. Colombini, Electrochemistry of s-triazine herbicides: Reduction of atrazine and terbutylazine in aqueous solutions, J. Electroanal. Chem. 395 (1995) 189–193. https://doi.org/10.1016/0022-0728(95)04096-7.
[26] J. Skopalová, M. Kotouček, Polarographic behaviour of some s-triazine herbicides and their determination by adsorptive stripping voltammetry at the hanging mercury drop electrode, Fresenius. J. Anal. Chem. 351 (1995) 650–655. https://doi.org/10.1007/BF00323342. [27] O. Tavares, S. Morais, P. Paíga, C. Delerue-Matos, Determination of ametryn in soils via
microwave-assisted solvent extraction coupled to anodic stripping voltammetry with a gold ultramicroelectrode, Anal. Bioanal. Chem. 382 (2005) 477–484.
https://doi.org/10.1007/s00216-004-3045-8.
[28] K. Islam, S.K. Jha, R. Chand, D. Han, Y.S. Kim, Fast detection of triazine herbicides on a
microfluidic chip using capillary electrophoresis pulse amperometric detection, Microelectron. Eng. 97 (2012) 391–395. https://doi.org/10.1016/j.mee.2012.03.034.
[29] Ľ. Švorc, M. Rievaj, D. Bustin, Green electrochemical sensor for environmental monitoring of pesticides: Determination of atrazine in river waters using a boron-doped diamond electrode, Sens. Actuators B Chem. 181 (2013) 294–300. https://doi.org/10.1016/j.snb.2013.02.036. [30] P.M.L. Bonin, D. Bejan, L. Schutt, J. Hawari, N.J. Bunce, Electrochemical Reduction of
18 1595–1599. https://doi.org/10.1021/es0305611.
[31] S. Luo, Y. Wu, H. Gou, A voltammetric sensor based on GO-MWNTs hybrid nanomaterial-modified electrode for determination of carbendazim in soil and water samples, Ionics (Kiel). 19 (2013) 673–680. https://doi.org/10.1007/s11581-013-0868-3.
[32] Y. Ya, C. Jiang, L. Mo, T. Li, L. Xie, J. He, L. Tang, D. Ning, F. Yan, Electrochemical Determination of Carbendazim in Food Samples Using an Electrochemically Reduced Nitrogen-Doped
Graphene Oxide-Modified Glassy Carbon Electrode, Food Anal. Methods. 10 (2017) 1479– 1487. https://doi.org/10.1007/s12161-016-0708-y.
[33] A. V. Juárez, L.M. Yudi, Electrochemical Study of s-Triazine Herbicides Transfer Across the Water/1,2-Dichloroethane Interface, Electroanalysis. 15 (2003) 1481–1487.
https://doi.org/10.1002/elan.200302718.
[34] M. Velázquez-Manzanares, J. Amador-Hernández, C. Cisneros-Cisneros, K.A. Heredia-Lezama, Triazine Herbicides Transfer at the Water/1,2-Dichloroethane Interface, J. Electrochem. Soc. 155 (2008) F218. https://doi.org/10.1149/1.2965795.
[35] M. Velázquez-Manzanares, H.G. Martínez, L.M. Yudi, J. Amador-Hernández, I.M. de la Garza Rodríguez, E.M.C. Urbina, Electrochemical Behavior of Simetryn Herbicide at Water|1,2-Dichloroethane Interface, J. Electrochem. Soc. 166 (2019) H286–H290.
https://doi.org/10.1149/2.0481908jes.
[36] Y. Yang, Y. Chun, G. Shang, M. Huang, pH-dependence of pesticide adsorption by wheat-residue-derived black carbon, Langmuir. 20 (2004) 6736–6741.
https://doi.org/10.1021/la049363t.
[37] M. Velázquez-Manzanares, D.J. Schiffrin, Kinetics of facilitated proton transfer by hydrophobic aromatic amines across the water/1,2-dichloroethane interface, Electrochim. Acta. 49 (2004) 4651–4658. https://doi.org/10.1016/j.electacta.2004.05.027.
[38] M. Rimboud, C. Elleouet, F. Quentel, J.M. Kerbaol, M. L’Her, Proton transfer across liquid{divides}liquid interfaces facilitated by the disproportionation reaction of a lutetium bisphthalocyanine: A voltammetric study at the microinterfaces between water and nitrobenzene or 1,6-dichlorohexane, J. Electroanal. Chem. 622 (2008) 233–237. https://doi.org/10.1016/j.jelechem.2008.06.006.
[39] A. Benvidi, S.N. Lanjwani, Z. Ding, Facilitated proton transfer by 2-acetylpyridine-4-phenyl-3-thiosemicarbazone across water/1,2-dichloroethane interface, J. Electroanal. Chem. 641
19 (2010) 99–103. https://doi.org/10.1016/j.jelechem.2009.12.011.
[40] K. Holub, H. Jänchenová, K. Štulík, V. Mareček, Proton transfer across a liquid/liquid interface facilitated by phospholipid interfacial films, J. Electroanal. Chem. 632 (2009) 8–13.
https://doi.org/10.1016/j.jelechem.2008.10.008.
[41] H. Bingol, A. Coskun, Facilitated proton transfer by a novel 2-aminothiazole derivative across the water/1,2-dichloroethane interface, J. Solution Chem. 40 (2011) 1505–1515.
https://doi.org/10.1007/s10953-011-9681-7.
[42] S.A. Dassie, Facilitated proton transfer or protonated species transfer reactions across oil|water interfaces, J. Electroanal. Chem. 728 (2014) 51–59.
https://doi.org/10.1016/j.jelechem.2014.06.020.
[43] F. Vega Mercado, J.M. Ovejero, F.M. Zanotto, M.R. Serial, M.I. Velasco, R.A. Fernández, R.H. Acosta, S.A. Dassie, Facilitated proton transfer across liquid | liquid interfaces under forced hydrodynamic conditions. Determination of partition coefficients of neutral weak bases, J. Electroanal. Chem. 791 (2017) 64–74. https://doi.org/10.1016/j.jelechem.2017.03.005. [44] E.D. Burgoyne, T.J. Stockmann, A.F. Molina-Osorio, R. Shanahan, G.P. McGlacken, M.D.
Scanlon, Electrochemical Detection of Pseudomonas aeruginosa Quorum Sensing Molecules at a Liquid|Liquid Interface, J. Phys. Chem. C. 123 (2019) 24643–24650.
https://doi.org/10.1021/acs.jpcc.9b08350.
[45] E.D. Burgoyne, A.F. Molina-Osorio, R. Moshrefi, R. Shanahan, G.P. McGlacken, T.J. Stockmann, M.D. Scanlon, Detection of Pseudomonas aeruginosa quorum sensing molecules at an
electrified liquid|liquid micro-interface through facilitated proton transfer, Analyst. (2020). https://doi.org/10.1039/D0AN01245A.
[46] T.J. Stockmann, J. Zhang, J.C. Wren, Z. Ding, Hydrophobic alkylphosphonium ionic liquid for electrochemistry at ultramicroelectrodes and micro liquidliquid interfaces, Electrochim. Acta. 62 (2012) 8–18. https://doi.org/10.1016/j.electacta.2011.10.087.
[47] A.J. Olaya, M.A. Méndez, F. Cortes-Salazar, H.H. Girault, Voltammetric determination of extreme standard Gibbs ion transfer energy, J. Electroanal. Chem. 644 (2010) 60–66. https://doi.org/10.1016/j.jelechem.2010.03.030.
[48] M.F. Suárez-Herrera, M.D. Scanlon, Quantitative Analysis of Redox-Inactive Ions by AC Voltammetry at a Polarized Interface between Two Immiscible Electrolyte Solutions, Anal. Chem. 92 (2020) 10521–10530. https://doi.org/10.1021/acs.analchem.0c01340.
20 [49] Y. Kubota, H. Katano, M. Senda, Ion-transfer Voltammetry of Local Anesthetics at an Organic
Solvent / Water Interface and Pharmacological Activity vs . Ion Partition Coefficient Relationship, Anal. Sci. 17 (2001) 65–70.
[50] V. Gobry, S. Ulmeanu, F. Reymond, G. Bouchard, P.A. Carrupt, B. Testa, H.H. Girault, Generalization of ionic partition diagrams to lipophilic compounds and to biphasic systems with variable phase volume ratios, J. Am. Chem. Soc. 123 (2001) 10684–10690.
https://doi.org/10.1021/ja015914f.
[51] M. Zhang, P. Sun, Y. Chen, F. Li, Z. Gao, Y. Shao, Studies of Effect of Phase Volume Ratio on Transfer of Ionizable Species across the Water/1,2-Dichloroethane Interface by a Three-Electrode Setup, Anal. Chem. 75 (2003) 4341–4345. https://doi.org/10.1021/ac0263824. [52] J.I. Garcia, R.A. Fernández, A.J. Ruggeri, S.A. Dassie, Novel electrochemical approach to the
determination of the partition coefficient of neutral weak bases, J. Electroanal. Chem. 594 (2006) 80–88. https://doi.org/10.1016/j.jelechem.2006.05.034.
[53] R.A. Fernández, S.A. Dassie, Electroanalytical procedure to resolve a sample solution containing tetracycline and its toxic degraded product: Anhydrotetracycline, J. Electroanal. Chem. 624 (2008) 121–128. https://doi.org/10.1016/j.jelechem.2008.08.002.
[54] J.I. Garcia, M.B. Oviedo, S.A. Dassie, Effect of ligand protonation on the facilitated ion transfer reactions across oil/water interfaces. IV. Buffer solution effect, J. Electroanal. Chem. 645 (2010) 1–9. https://doi.org/10.1016/j.jelechem.2010.02.035.
[55] F.M. Zanotto, R.A. Fernández, S.A. Dassie, Facilitated proton transfer-electron transfer coupled reactions at thick-film modified electrodes, Electrochim. Acta. 258 (2017) 727–734. https://doi.org/10.1016/j.electacta.2017.11.119.
[56] F.M. Zanotto, T.A. Hernández, R.A. Fernández, S.A. Dassie, An integrated theoretical-experimental approach to understand facilitated proton transfer-electron transfer coupled reactions at thick-film modified electrodes, Electrochim. Acta. 283 (2018) 1719–1731. https://doi.org/10.1016/j.electacta.2018.07.053.
[57] M. Zhou, S. Gan, L. Zhong, X. Dong, J. Ulstrup, D. Han, L. Niu, Improvement in the assessment of direct and facilitated ion transfers by electrochemically induced redox transformations of common molecular probes, Phys. Chem. Chem. Phys. 14 (2012) 3659–3668.
https://doi.org/10.1039/c2cp23184k.
21 aqueous phase and a thin organic phase for the absolute determination of trace ionic species, J. Electroanal. Chem. 707 (2013) 95–101. https://doi.org/10.1016/j.jelechem.2013.08.030. [59] M. Podrazka, E.W. Nery, A. Pacowska, D.W.M. Arrigan, M. Jönsson-Niedziółka, Paper-Based
System for Ion Transfer Across the Liquid-Liquid Interface, Anal. Chem. 90 (2018) 8727–8731. https://doi.org/10.1021/acs.analchem.8b02695.
![Figure 2. Cyclic voltammetry of AME (A) at pH 1.1 ([AME] = 320 µM); (B) at pH 2.1 ([AME] = 70 µM)](https://thumb-eu.123doks.com/thumbv2/123doknet/14440335.516804/7.892.115.782.605.891/figure-cyclic-voltammetry-ame-ame-µm-ame-µm.webp)
![Figure 4. Concentration distribution of [AME] org (blue line based on equation 7), [AMEH + ] aq (red line based on equation 6), [AME] aq (black line based on equation 5), and [H + ] aq (green line)](https://thumb-eu.123doks.com/thumbv2/123doknet/14440335.516804/10.892.262.599.416.684/figure-concentration-distribution-based-equation-ameh-equation-equation.webp)