Publisher’s version / Version de l'éditeur:
Vous avez des questions? Nous pouvons vous aider. Pour communiquer directement avec un auteur, consultez la première page de la revue dans laquelle son article a été publié afin de trouver ses coordonnées. Si vous n’arrivez pas à les repérer, communiquez avec nous à [email protected].
Questions? Contact the NRC Publications Archive team at
[email protected]. If you wish to email the authors directly, please see the first page of the publication for their contact information.
https://publications-cnrc.canada.ca/fra/droits
L’accès à ce site Web et l’utilisation de son contenu sont assujettis aux conditions présentées dans le site LISEZ CES CONDITIONS ATTENTIVEMENT AVANT D’UTILISER CE SITE WEB.
Research Report (National Research Council of Canada. Institute for Research in
Construction), 2003-07-17
READ THESE TERMS AND CONDITIONS CAREFULLY BEFORE USING THIS WEBSITE.
https://nrc-publications.canada.ca/eng/copyright
NRC Publications Archive Record / Notice des Archives des publications du CNRC : https://nrc-publications.canada.ca/eng/view/object/?id=dfaa533c-57c3-4f06-9be7-5d393d4c163b https://publications-cnrc.canada.ca/fra/voir/objet/?id=dfaa533c-57c3-4f06-9be7-5d393d4c163b
Archives des publications du CNRC
For the publisher’s version, please access the DOI link below./ Pour consulter la version de l’éditeur, utilisez le lien DOI ci-dessous.
https://doi.org/10.4224/20386513
Access and use of this website and the material on it are subject to the Terms and Conditions set forth at
Acoustic Satisfaction in Open-Plan Offices: Review and
Recommendations
Acoustic Satisfaction in Open-Plan Offices: Review and
Recommendations
Navai, M.; Veitch, J.A.
IRC-RR-151
July 17, 2003
Acoustic Satisfaction in Open-Plan Offices: Review and Recommendations
Manna Navai and Jennifer A. Veitch
Institute for Research in Construction
National Research Council Canada, Ottawa, ONT, K1A 0R6, Canada
Research Report RR-151
Acoustic Satisfaction in Open-Plan Offices: Review and Recommendations Manna Navai and Jennifer A. Veitch
Executive Summary
Open-plan offices lack walls and doors. Although one common assumption has been that such a design would encourage communication between co-workers, it has become apparent that the primary source of discomfort for occupants of the open-plan office environment is unwanted sound. This paper reports on a literature review of the relationship between acoustics and satisfaction in the open-plan office, conducted with the aim of developing empirically derived recommendations for satisfactory acoustic conditions. For the purposes of this review, acoustic satisfaction was defined as a state of
contentment with acoustic conditions; it is inclusive of annoyance, loudness, and distraction - all concepts used by one or another researcher in this area to assess subjective experiences associated with the acoustic environment in offices.
Based on the results of field surveys conducted over the course of thirty years, background noise levels as high as 79 dB(A) were observed. Higher levels of ambient noise existed in the 1970’s and 1980’s and were primarily caused by noisy office equipment and co-workers' conversations. Today, although office machinery have become substantially less noisy, ambient levels continue to remain unsatisfactory, primarily due to unwanted speech sounds. Average levels recorded in contemporary surveys range from 46-58 dB(A).
The key issues for sound in open-plan offices are characteristics of sound such as level and spectrum, time variation of level, and speech masking effects. The majority of papers were found to be concerned with level effects, while there seemed to be a void in studies concerning spectrum and masking effects in the open-plan environment.
The results from the studies reviewing level effects concluded that ambient levels exceeding 45 dB(A) are associated with lowered acoustic satisfaction. Some researchers claimed that intermittent peak noises fluctuating above average levels were responsible for determining annoyance ratings, however, we could not determine the specific peak levels associated with annoyance.
Results from the studies investigating spectrum effects revealed that, in general, higher frequencies are associated with lower acoustic satisfaction. Researchers have found this problematic because higher frequencies mask speech sounds better than lower frequencies, although these hissing sounds are aversive to human ears. There is a great need for further investigations concerning the relationship between masking techniques and subjective responses to masking noises in open office environments.
Differences in measurement techniques and methodological weaknesses made it difficult to make quantitative comparisons between the various studies. Reliability and validity in measurement of acoustic satisfaction have received too little attention, as has consistency in the selection and reporting of acoustic measurements. Advances in this important area of office design await improvements in research quality and in the quantity of relevant investigations.
Table of Contents
1.0 Introduction... 4
2.0 Definition and Measurement of Acoustic Conditions... 5
2.1 Sound as a Physical Stimulus... 5
2.2 Sound as a Subjective Experience... 6
2.3 Sound Masking... 6
2.4 Acoustic Conditions Past and Present ... 8
3.0 Operationalizing Acoustic Satisfaction... 9
4.0 Effects of Acoustic Conditions on Acoustic Satisfaction ... 9
4.1 Scope of Review... 9
4.2 Sound Level Effects ... 10
4.2.1 Average levels. ... 10
4.2.2 Peak levels. ... 15
4.2.3 Summary... 15
4.3 Sound Spectrum Effects ... 15
4.4 Sound Masking Effects ... 17
5.0 Discussion ... 18 5.1 Research Limitations ... 18 5.2 Future Directions... 18 6.0 Conclusions... 19 7.0 References... 20 Acknowledgements... 22
1.0 Introduction
Generally categorised by the absence of walls and partitions, the open-plan office concept was first conceived by two West German furniture manufacturers, Eberhard and Wolfgang Schnelle, and was promoted in the United States around the 1960’s (Hundert & Greenfield, 1969). These innovators believed that the open office offered several managerial, economic and working condition advantages, such as better communication between departments, space saving due to the elimination of corridors and better overall environmental conditions (Boyce, 1974; Hundert & Greenfield, 1969; Zalesny & Farace, 1987). By the mid-1970’s, open offices became common in North America, and remain as the primary type of office design. Today, the open-plan office can be defined as “a workspace whose perimeter boundaries do not go to the ceiling. Most often constructed of relocatable panels and panel-hung work surfaces and storage, or of relocatable panels with free-standing furniture or of non-relocatable, drywall boundaries (not to the ceiling) and free standing furniture” (Brill, Weidemann, & BOSTI Associates, 2001, p. 17).
Since its inception, researchers have sought to determine whether the purported advantages of the open-plan office are realised (e.g., Hundert & Greenfield, 1969; Sundstrom, Burt, & Kamp, 1980). Studies investigating the alleged benefits of open-plan offices found little or no empirical support (e.g., Oldham & Brass, 1979; Zalesny & Farace, 1987).
Common problems associated with the open-plan office include frequent complaints of loss of privacy, aural distractions and frequent interruptions by other employees (Hedge, 1982). Brookes and Kaplan (1972) investigated the emotional (affective) effect of the open-plan office on employees of a major U. S. firm. Employees were moved from a mixed environment (private, semi-private and open offices) into an entirely open-plan space. Results from employee surveys indicated that the new open-plan office was more aesthetically appealing, more sociable, and more adaptable, but less efficient, less private and more noisy. Sundstrom, Town, Rice, Osborn, and Brill (1994) surveyed over 2,000 U.S. and
Canadian office workers in various office settings and found that 54% reported feeling bothered often by one or more sources of noise such as telephones, conversations and office equipment. Noise produced by co-workers' conversations, the ringing of telephones and other machinery has all contributed significantly to employee annoyance and dissatisfaction (Brookes & Kaplan, 1972; Nemecek & Grandjean, 1973; Sailer & Hassenzahl, 2000). Office workers feel frustrated by the distractions posed by the noise as well as the inability to engage in private conversations themselves.
Distractions due to speech sounds have been found to be significantly problematic in open-plan offices. Studies have found that intelligible speech is attended to and is more distracting than
unintelligible speech or sounds with no information content (Boyce, 1974; Sundstrom et al., 1994). Acoustic problems are common in the open-plan environment due to the nature of the layout. Sound transmits effortlessly in a barrier free environment. With no floor to ceiling barriers or doors to attenuate the sound transmission, problems with noise prevail in typical open office environments, unless absorbed or contained by acoustically treated partitions or ceilings or masked by ambient sounds
(Sundstrom, 1986).
In an effort to quantify the relationship between acoustic conditions and employee satisfaction in open-plan offices, this review aims to answer the following question: What acoustic conditions would be satisfactory to occupants of open-plan offices? This key question will be answered based on a review of the relevant psychology and acoustics literature.
2.0 Definition and Measurement of Acoustic Conditions
2.1 Sound as a Physical Stimulus
Sound consists of pressure changes that travel in a wave-like manner through the air and can be detected by the human ear. Sound varies according to frequency and pressure. The number of times per second the air pressure increases, decreases, and then returns to normal pressure is defined as frequency in hertz (Hz) or cycles per second (cps). Frequency can also be referred to as pitch. The human ear can perceive sound between 2 Hz and 20 kHz. The degree to which air particles are compressed and rarefied from their normal state is called sound pressure. Sound energy is directly proportional to the square of sound pressure (Kryter, 1985).
In order to relate the intensity of sound to its effects on people, three general measurements have been developed: Sound Pressure Level (SPL), Event Exposure Level (Lex), and the Multiple-Event Sound Equivalent Level (Leq), all of which are defined in decibels (dB). A decibel (dB) is a sound intensity ratio measured on a logarithmic scale (Kryter, 1985). Because the decibel scale is logarithmic rather than arithmetic, a large increase in sound energy will be reflected in a change of only a few decibels. An increase of 10 dB is required for a sound to be judged twice as loud. The SPL is a measure that relates the physical energy of sounds of 1 sec or shorter to auditory system responses to sounds. The Lex is used for sounds of longer duration, and is comprised of successive 1 sec SPL’s summed over time. The Leq is an averaged measure of 1-sec SPL’s over a specific period of time (e.g., 5 minutes, or 1 hour); in other words, it is a cumulative measure of noise exposure (Kryter, 1985).
The human auditory system responds to different frequencies in different ways. Sounds of the same level but at different frequencies will not be considered equally loud. In an effort to better understand the effects of different frequency ranges on the human ear, equal subjective loudness curves relate subjective loudness to sound pressure and frequency (International Organization for Standardization (ISO), 1987). These equal loudness curves are valid only for pure tones. Because most noises consist of many different frequencies (not just pure tones), the curves do not predict the loudness of everyday noises, although they are the basis for frequency weightings used today. These weightings, called A, B, C and D contours, are used to calculate SPL’s that correct for the varying sensitivity of human hearing to sounds of varying frequency (see Figure 1). The four contours differ in the weights applied to various frequencies. The A-weighting has become the most widely used method of measuring broadband sounds because it is believed to best approximate human aural sensitivity (Kryter, 1985). D is infrequently used, having been developed primarily for research concerning aircraft noise.
-80 -70 -60 -50 -40 -30 -20 -10 0 10 16 63 250 1k 4k 16k FREQUENCY, Hz RELATIVE RESPONSE, dB A B C
2.2 Sound as a Subjective Experience
Several non-physical characteristics of sound are related to subjective responses to noise. Noise is defined as a psychological concept involving unwanted sound perceived by the listener as being
unpleasant, bothersome, distracting or psychologically harmful (Cohen & Weinstein, 1982). Sounds can be unwanted because of non-physical properties such as information content, predictability, necessity, and controllability. Speech sounds have high information content, but sounds other than speech can also carry information that is interpreted according to their prior associations. For example, sounds may indicate an emergency, such as with an alarm, or may remind one of a pleasant or unpleasant event.
Predictable sounds include continuous, repetitive or regular sounds such as those made by ventilation systems. Predictable sounds can be less stressful than unpredictable sounds because
individuals expect the noise and are prepared to experience the sound. Unpredictable sounds, defined as sounds that occur suddenly, without warning, or at irregular intervals, tend to be more stressful (Glass & Singer, 1972; Sundstrom, 1986). It is easier to habituate to constant noise than to variable noise
(Kjellberg, Landström, Tesarz, Söderberg, & Åkerlund, 1996).
Issues of controllability and necessity are also related to subjective noise assessment. The results of an extensive survey regarding the cognitive variables related to noise assessment revealed control and necessity of the noise as key factors. Necessity of the noise refers to the perception that the noise is inevitable for a given setting or activity (e.g., keyboard noise is necessary to typing). Individuals who perceive the noises they are exposed to as unnecessary will perceive the noise as more aversive than individuals who perceive the noise as necessary (Graeven, 1975).
Controllable sounds are those that the hearer can influence. Predictability can create the
perception of control. Classic psychological experiments demonstrated that controllable noise causes less post-exposure frustration and reduced post-exposure performance effects than uncontrollable noise (Glass, Reim, & Singer, 1971; Reim, Glass, & Singer, 1971). Sounds that are generated by others, or unpredictable sounds (e.g., telephone rings) can be considered uncontrollable, and hence more aversive or stressful (Kjellberg & Landström, 1994).
2.3 Sound Masking
Sound masking consists of artificial, non-meaningful sound used to cover unwanted sounds.
Sound masking is most commonly used to mask speech sounds, because speechcan be considered to be the most annoying and distracting type of office noise. Speech not only contains information, but is unpredictable and uncontrollable (Sundstrom, 1986).
Sound masking can be defined as “the process by which the detectability of one sound, the signal, is impaired by the presence of another sound, the masker” (Oborne, 1987, p. 255). Signal to noise ratios are frequently referred to when discussing how well noise masks unwanted speech sounds. In this case, the “signal” is speech and the “noise” is the masking sound. If being able to hear speech sounds is important then a high speech to noise ratio would be favourable. If, however (as is the case in open-plan offices) speech is considered unwanted sound, a low speech to noise ratio is preferred. In calculating a speech:noise ratio, one uses the corresponding SPL’s (measured on the same scale) for the two quantities. Thus, in an office setting one might calculate a speech:noise ratio from measurements of the sound pressure level (SPL) at the point of the listener’s head, and the SPL of ambient noise at the listener’s head, and the equivalent hearing threshold level.
How well sound can mask speech, particularly in the context of the indoor environment, depends on two main qualities: intensity and frequency. The louder, and hence, the greater the intensity of the artificial sound, as compared to the speech sound, the more masking will occur. Sound masking can also occur if the frequency of the masker approaches that of the signal (speech). Researchers often refer to the concept of a ‘critical band’ of masking which means that frequency components of the noise need to lie within a narrow band surrounding the centre frequency of the signal in order to be effective. If the noise is composed of frequencies outside of the critical band of the speech noise, for example, then interference
will not occur. However, if the noise intensity is sufficiently high, it can mask the signal regardless of its frequency components (Oborne, 1987, p. 255).
16 31.5 63 125 250 500 1000 2000 4000 8000 20 30 40 50 60 70 N-1 N-2 N-3 N-4 N-5 Speech S P L, dB Frequency, Hz
Figure 2. Sound masking. The dotted line is a speech spectrum; the five solid lines represent 5 levels of a
neutral spectrum approximating the ASHRAE neutral spectrum. The lowest two levels will mask poorly; the highest three levels have intensities higher than the speech spectrum in all frequencies, and will mask the speech..
White noise incorporates all sound frequencies, and has equal energy per unit bandwidth. It
possesses a hissing or humming quality that can mask typical office noises, and if played at a constant sound level can also mask temporal variations in office noise intensity. Sounds from conversations, telephone rings and other office machinery become less salient with the introduction of white noise. Another variant used for speech masking is so-called pink noise, which has equal energy per constant percentage bandwidth. For example, pink noise would have the same energy or sound level in each octave or 1/3 octave band filter. Some acousticians rely on a modified spectrum that sounds similar to typical ventilation noises for masking in offices, rather than on white or pink noise, which have tendencies to sound irritating or unpleasant (Beranek, 1971, Fig 18.15).
When trying to predict the effects of noise on speech in indoor environments, researchers usually use composite measurements such as the Articulation Index (AI) and the Speech Intelligibility Index (SII), which are frequency-weighted speech:noise ratios. The frequency weightings used for these indices are derived from psychoacoustic data on the recognition of speech under varying noise conditions. Articulation tests are tests involving how well syllables or phonemes are recognised, whereas intelligibility tests usually refer to the ability to comprehend words or sentences.
The AI, developed by French and Steinberg (1947), holds that speech intelligibility is
proportional to the average difference in dB between the masking noise levels and the speech levels taken at the centre frequency of 20 narrow frequency bands. These 20 frequency bands are assumed to each contribute an equal amount to speech intelligibility. The AI predicts the number of unrelated words that can be identified in noise (Beranek, 1947; French & Steinberg, 1947). Maximum intelligibility would merit a score of 1.0, and maximum unintelligibility would merit a score of 0.0. According to Pirn (1971), each 6 dB increase in ambient noise levels in open-plan offices generally results in an AI decrease of 0.2. He recommended that for good communication the AI should be around 0.5 or higher. However, if confidential privacy for a speaker is desired, then an AI of 0.00-0.05 is the target; for normal privacy an AI of 0.05-0.20 is recommended. The American National Standards Institute (ANSI) developed and established a standard for calculating the AI in 1969, ANSI S3.5-1969 (American National Standards Institute, 1970).
The speech intelligibility index (SII) is also a measure used to determine the intelligibility of speech under various sound conditions. The SII was generated as a major revision to the AI standard by ANSI. The main difference between AI and SII is that the SII includes new data collected since 1969, regarding the various parameters and procedures used in the calculations such as the standard speech spectrum level, and the relative importance of various frequencies to speech intelligibility (American National Standards Institute, 1997). The speech source spectrum recommended for the calculation of the AI is about 3 dB higher in level than for SII. The SII also includes the masking effects of lower frequency bands, which the AI did not, and is therefore more difficult to calculate (Bradley & Wang, 2001). It is highly correlated to the AI and is similar to the AI in that a value of 1.0 indicates maximum speech transmission and a value of 0.0 indicates no speech transmission. Again, lower SII values are desired for open-plan offices, as they indicate adequate levels of speech privacy. Maintaining an SII of 0.2 or lower is generally the rule of thumb in open-plan offices (John S. Bradley, personal communication, August 1, 2002). Although the SII and the AI are very similar and generally measure the same thing, SII values are usually slightly different than AI values (Wang & Bradley, 2002).
2.4 Acoustic Conditions Past and Present
What are the acoustic conditions like in real open-plan offices? Researchers have been measuring the sound levels in open-plan offices since the 1960’s with the hopes of properly addressing the acoustic problem. Over this period there have been substantial changes in office equipment that have changed the level and the nature of sounds in offices, most notably the change from typewriters on the desks of clerical staff to computers on every desk. Keighley (1966), for example, found that in the UK, office noise levels varied from 60 – 79 dB(A). Levels have dropped since that time.
Nemecek and Grandjean (1973) carried out an extensive study of 15 landscaped offices in Switzerland. Fifteen-minute noise measurements were made repeatedly in various points of each of the offices with a Bruel and Kjaer (B & K) sound level meter. The mean noise level varied from 48 to 53 dB(A) with frequent peaks averaging 8 to 9 dB(A) above the mean level.
In an effort to understand the spectral and temporal characteristics of sound in the office
environment, Moreland (1988) found that between 9 a. m. and 4 p. m. , the average sound level in seven open-plan offices was 44.9 dB(A), ranging from 42.9 dB(A) to 48.4 dB(A). Noise samples were collected every 2 minutes between the hours of 7 a. m. and 7 p. m. , with a Rion model SA 25 one-third octave band spectrum analyser, and B & K type 4165 and 2615 microphones.
Offices were among the sites visited by Landström, Kjellberg, and Soderberg (1998) (the survey included industrial control rooms, which are not relevant here and not discussed). A-weighted levels average 53.3 dB(A) in offices. In Hong Kong, the mean was slightly higher: Tang and Wong (1998) surveyed workstations in 6 air-conditioned, landscaped offices, and found that the average Leq levels in the six offices ranged from 52 to 58 dB(A). Articulation Index values ranged from 0.69 to 0.75 indicating extremely low acoustical privacy conditions. Results from questionnaires revealed that the majority of disturbing noise sources consisted of human speech, followed by air conditioners, office machinery, and traffic, respectively.
AI and SII values depend on speech effort as well as background noise levels. Field
measurements of speech levels are few, but Warnock and Chu (2002) collected speech recordings from 118 participants in nine offices. Participants wore head-sets with microphones attached and were told to speak as naturally and freely to another person in their workstation as they normally would. Each
individual speech recording lasted 1 minute. Background noise measurements were also measured at each of the 9 offices, in various locations throughout the working day. Average male and female voice levels in open-plan offices were 51.3 dB(A) and 50.6 dB(A) respectively corrected to 0.9 m in front of the speaker (the measurements were taken at a shorter distance). The average sound level across all nine offices was 46 dB(A).
3.0 Operationalizing Acoustic Satisfaction
Acoustic satisfaction is a dimension of environmental satisfaction, which for the COPE project is defined as “a state of contentment with physical environmental conditions”. As the name suggests, acoustic satisfaction refers specifically to satisfaction, or contentment, with acoustic conditions.
Within the acoustics and psychology literatures alike, terms relating to this construct more often reflect dissatisfaction. The words distracting, irritating, and annoying are sometimes used
interchangeably to denote the same meaning, and are frequently used to assess annoyance with acoustic conditions. Loudness is a psychophysical construct, but some inquiries ask for an affective judgement of sound as being “too loud” or “too soft”.
Using several different terms to refer to the same construct can create measurement error. Several researchers have tried to differentiate between each of the terms to clarify the issue (e. g., Hellman, 1982; Laird & Coyle, 1929), but the literature does not reveal consensus. Hellman (1982) defined annoyance as an individual’s reaction to noise within the context of a given situation; noisiness as a quality of sound; and loudness as sound intensity, and found that the three attributes produced distinctly different results when assessing sound spectra. He concluded that loudness appeared to be the underlying basis of judged annoyance and noisiness. Kjellberg et al. (1996) found that annoyance and distraction were the two main subjective responses to noise, each influenced by different variables and noise characteristics. However, they are not mutually exclusive; distraction is one of several responses to noise that contributes to the overall annoyance response. Sailer and Hassenzahl (2000) claimed that it was more advantageous to use the term loudness, as opposed to annoyance, when assessing subjective responses to noise because people seemed to imply the same thing with the concept of loudness while the question of annoyance varied in its definition and could be interpreted much differently.
Despite the desirability of focusing on a refined construct, it is apparent that there is no agreement in the literature concerning the definition of separate aspects of response to acoustic conditions.
Therefore, for the purposes of this COPE review we interpreted the various terms broadly, if it appeared likely that the measurements tapped the same underlying construct of acoustic satisfaction or its negative complement.
4.0 Effects of Acoustic Conditions on Acoustic Satisfaction
4.1 Scope of Review
The studies reviewed in this report were selected through an extensive literature search of articles published between 1965 to 2002. Although many studies published between 1930- 1965 were found to be somewhat pertinent, they were omitted from this review because they lacked important details and because they included conditions that can no longer be regarded as typical. The vast literature pertaining to the performance effects of noise was considered beyond the scope of this review and was therefore omitted.
The search engines PsycINFO, Ergonomics Abstracts International, INSPEC, and EI Compendex were used. Several key words and search terms were used to locate relevant literature such as: speech; sound; sound masking; open-plan; open; office; satisfaction; speech intelligibility; speech masking; annoyance; spectrum; sound level; sound frequency; noise; noise level; noise spectrum; distraction; and open-environment. Most of the relevant articles obtained were peer-reviewed journal or conference proceedings papers. Sources included academic journals such as: Environment and Behavior, Noise and
Vibration Control, Human Factors, The Journal of the Acoustical Society of America, Noise Control Engineering Journal, and Journal of Sound and Vibration, to name but a few.
Investigations in office settings (either field studies or laboratory experiments) were exclusively chosen. Only papers with enough information on acoustic conditions to know what was measured or manipulated, and in which no obvious confounds existed in the research design, were included. Papers were also selected on the basis of whether they contained enough outcome information to determine how
the acoustic conditions affected satisfaction. We also considered whether or not it was reasonable to apply the findings to present-day open-plan offices incorporating current technology, particularly when
reviewing papers written prior to the 1990s (when technological changes altered office equipment and work habits).
Both field studies and laboratory studies were included. Both have their advantages and both can add to a better understanding of any situation. Field studies can be regarded as more generalizable because they are conducted within the setting and with the population to which we want to draw
conclusions. Extraneous variables are difficult to control in field studies, which is why laboratory studies can be beneficial. Variables can be controlled and manipulated much more rigorously in laboratory settings, allowing for a clearer understanding of the relationships between the target variables. However, laboratory settings cannot fully reproduce all of the contextual conditions that might influence people in workplaces, which restricts generalizability. Both types of studies were included in this review.
4.2 Sound Level Effects
Keighley (1966) sought to isolate the factors governing people’s responses to noise, in which he investigated the differences between several scaling methods and defining criteria for tolerable noise conditions. The surveys consisted of demographic questions, personal and occupational characteristics, and a section addressing employees’ descriptions and assessments of noise. Other questions addressed issues of noise annoyance, irritation and disruption. Questions concerning the noise climate included a noisiness scale, a noisiness and proportion of time scale, and an acceptability scale (satisfactory – unsatisfactory). Respondents were asked to say how noise affected them in terms of annoyance, irritation and disruption of work.
4.2.1 Average levels.
Twelve offices were surveyed with a total of 1204 respondents. The buildings in which the offices were housed varied considerably, however no specific details regarding the differences are provided. Three quarters of the participants were female, all of whom had routine jobs frequently
associated with machine work (the specific type of machinery they operated is not mentioned). All of the men had supervisory type positions. Sound measures were gathered by means of a portable sound level meter and readings were taken at different points in the room at various intervals during the working day (Keighley, 1966). Office noise was tape recorded in each office for one minute at a time at 20-minute intervals. Results indicated that differences in personal tolerance of noise, the extent of momentary fluctuations and the sound pressure levels were all related to differences in noise ratings.
The average levels of sound in the 12 offices varied between 60 – 79 dB(A) (Keighley, 1966). Subjective assessments of the noise varied considerably between the twelve offices and acceptability scores ranged from 37% to 68% (0%= “unsatisfactory”, 100%= “satisfactory”). Noise level, transitory noise peaks, and individual noise tolerance all influenced acceptability. Overall, Keighley recommended an upper limit of acceptability of 68 dB(A) for offices, with the caveat that it did not apply to rooms in which extensive verbal communication took place. It is difficult to judge the applicability of the findings today, given that the study was conducted in the mid-1960’s and because the type of work being
conducted in each of the offices is unknown. The average sound levels were much higher than is typical of contemporary offices (see above).
Warnock (1973) exposed office staff to masking sounds of varying spectrum or level (45, 48 and 51 dB(A)) and asked participants to mark their preference using a five-point scale. Results indicated that office staff preferred the quieter condition, even when they were not aware of the presence of the masking noise. Based on the findings, Warnock recommended that noise levels above 48dB(A) should be avoided. Interestingly, the participants did not feel it important to have acoustical privacy in order to accomplish their work, and felt the masking noise interfered more than it did good. In general, an increase in masking noise level was related to decreases in speech intelligibility (as one would expect). Data were not
provided to permit the calculation of a composite measure of sound masking ability, such as AI.
Nemecek and Grandjean (1973) surveyed occupants as well as measuring noise levels (the means varied from 48 to 53 dB(A) with frequent peaks averaging 8 to 9 dB(A) above that). Five hundred and
nineteen employees were interviewed regarding their subjective impressions of the open-plan office environment. The results of the survey revealed that 35% of the employees questioned were “very much disturbed by noise”, 45% were “slightly disturbed” and 20% were “not at all disturbed” by office noise. When asked about which types of noise sources were found to be disturbing by the 411 employees who were “very much” or “slightly” disturbed by noise, 46% answered “conversations”, followed by office machines (25%) and telephones (19%).
Landström, Kjellberg, and Soderberg (1991) investigated ventilation noise in four different workplaces. All four workplaces were assumed to be equal in respect to gender ratio, tasks, working hours and age as well as the technical character of the ventilation system, size, shape, lighting and climate of offices, although the occupancy of one office was lower than the other three. Ventilation noise was recorded during quiet night periods, at each person’s workspace for 5 minutes. Sound was recorded with a sound level meter, a microphone and a tape recorder. Subjective responses were recorded on a
questionnaire designed to evaluate ventilation noise. Annoyance was estimated on a 100mm scale from “not annoying at all” to “almost unbearable”. Questions regarding individual background data, work tasks, working hours and health were also included on the survey.
Results indicated higher A-weighted sound levels in the first two offices (A = 38.8 dB(A) & B= 39.2 dB(A), p<0.05) than in the other two offices (C= 35.2 dB(A) & D= 33.5 dB(A), p= 0.05).
Ventilation noise was rated as more annoying at workplaces A and B compared to C and D (p<0.05). However, the mean annoyance ratings were low to moderate in all offices (highest in office A at 34, and lowest in C at 19). There was a small overall correlation, r=.22 (p<.05), between annoyance and
ventilation noise levels in dB(A). The authors recommended that ventilation noise should not exceed 40 dB(A) and that levels above 35 dB(A) should be avoided to keep annoyance levels below “somewhat annoying” (Landström et al., 1991).
The results are suggestive, but not conclusive. The validity of the assumption that the workplaces were equivalent in gender ratio, tasks, working hours and age is unknowable; these variables might explain the differences between offices. Moreover, the annoyance measurements taken during the day almost certainly included responses to sounds other than ventilation noise. This study does not give clear guidance as to desirable acoustic conditions for occupied workplaces.
Kjellberg et al. (1996) were interested to know how factors such as predictability and
controllability, necessity of the noise, information content, ongoing activity and individual differences contributed to feelings of noise annoyance in the work place. Ratings of noise annoyance for 386 participants in three different types of workplaces (office, laboratories and industries) were gathered in addition to 5 minute recorded samples of the physical sound characteristics at each work site.
The results, which were presented over all workplaces, indicated that the sound level and self-rated necessity of the noise were mostly related to annoyance ratings. Sound level exposures ranged from less than 50.5 dB(B) to approximately 80.5 dB(B) and a linear relationship between sound level in dB(B) and averaged annoyance ratings (r2= 0.89) was found (using averaged annoyance ratings inflated the size of the correlation). Concerning predictability and controllability, annoyance was greater for machines used by others as compared to machines used by oneself. Unfortunately it is difficult to distinguish between what specific acoustic conditions were found in each of the three categories of workspaces (office, laboratory or industry). It would have been helpful if the authors had made the distinction clear.
Time of day and day of week were added variables in another investigation by the Swedish researchers (Landström et al., 1998). They asked occupants to complete a questionnaire as well as rate their noise annoyance on a scale of 0 to 100 three times each day for five days. Annoyance was low, the mean rating being 18.8 out of 100; the offices has a mean sound level of 53.3 dB(A). Not surprisingly, annoyance was not related to sound levels in this sample. The most frequently identified annoying sounds were speech, impact noise, and machine noise. Annoyance did not change over the course of the day but there was a tendency for lower annoyance later in the week.
Tang and Wong (1998) surveyed occupants concerning the sources of disturbing noise. The majority of disturbing noise sources consisted of human speech, followed by air conditioners, office
machinery, and traffic, respectively (the range of average noise levels in the six offices was 52 to 58 dB(A)). They found that several acoustical indices were good linear predictors of mean auditory sensation, including Leq. The cross-over point (“suitable”) from “too quiet” to “too noisy” occurred at
approximately Leq.= 49.5 dB(A). (It is not clear why the authors did not do the more conventional
regression of individual auditory sensation on acoustical variables.)
Ayr, Cirillo, and Martellotta (2001) measured the SPL and other noise indices and spectral measurements of noise in several air-conditioned work-stations in an software company office in Italy. Two hundred and ninety participants completed surveys regarding annoyance, noisiness and loudness of the noise in their workstations. Statistical analysis revealed a strong correlation between the LA90 (A-weighted percentile level for 90% exceedence) and annoyance, followed by the LA10 and the LeqA. Linear regression results clarified that annoyance rose from “insignificantly annoyed” to “a little annoyed” between approximately 40 and 48 LA90 (dB(A)).
Most recently, Veitch, Bradley, Legault, Norcross, and Svec (2002) investigated the effects of noise level and spectrum on acoustic satisfaction. Participants were exposed to 15 different simulated ventilation noises (3 spectra x 5 noise levels) in combination with simulated telephone conversations and were asked to complete a satisfaction rating for each sound condition. The noise levels varied from approximately 39 dB(A) to 51 dB(A). The laboratory experiment was conducted in a mock-open office consisting of 6 open-plan workstations, a shared filed cabinet space and printers at both ends of the room. Questionnaires were administered to participants regarding satisfaction, speech intelligibility and the characteristics of noise (such as rumble, hiss and loudness). There was a linear effect of noise level on ratings of acoustic satisfaction, speech intelligibility, rumble, hiss, and loudness. None of the conditions reached good acoustic satisfaction, and noise levels above 45 dB(A) were judged to be too loud.
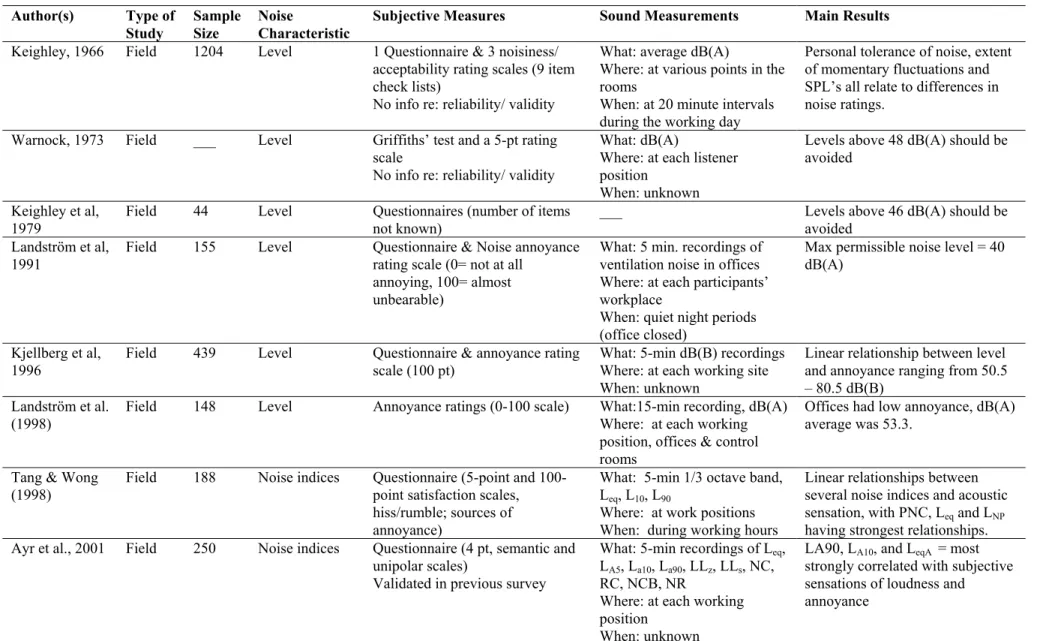
(Interactions of noise level and masking noise spectrum are discussed below.) Table 1 provides a summary of the studies reviewed above.
Table 1. Principal characteristics of cited studies. Author(s) Type of Study Sample Size Noise Characteristic
Subjective Measures Sound Measurements Main Results
Keighley, 1966 Field 1204 Level 1 Questionnaire & 3 noisiness/ acceptability rating scales (9 item check lists)
No info re: reliability/ validity
What: average dB(A)
Where: at various points in the rooms
When: at 20 minute intervals during the working day
Personal tolerance of noise, extent of momentary fluctuations and SPL’s all relate to differences in noise ratings.
Warnock, 1973 Field ___ Level Griffiths’ test and a 5-pt rating scale
No info re: reliability/ validity
What: dB(A)
Where: at each listener position
When: unknown
Levels above 48 dB(A) should be avoided
Keighley et al, 1979
Field 44 Level Questionnaires (number of items not known)
___ Levels above 46 dB(A) should be avoided
Landström et al, 1991
Field 155 Level Questionnaire & Noise annoyance rating scale (0= not at all
annoying, 100= almost unbearable)
What: 5 min. recordings of ventilation noise in offices Where: at each participants’ workplace
When: quiet night periods (office closed)
Max permissible noise level = 40 dB(A)
Kjellberg et al, 1996
Field 439 Level Questionnaire & annoyance rating scale (100 pt)
What: 5-min dB(B) recordings Where: at each working site When: unknown
Linear relationship between level and annoyance ranging from 50.5 – 80.5 dB(B)
Landström et al. (1998)
Field 148 Level Annoyance ratings (0-100 scale) What:15-min recording, dB(A) Where: at each working position, offices & control rooms
Offices had low annoyance, dB(A) average was 53.3.
Tang & Wong (1998)
Field 188 Noise indices Questionnaire (5-point and 100-point satisfaction scales, hiss/rumble; sources of annoyance)
What: 5-min 1/3 octave band, Leq, L10, L90
Where: at work positions When: during working hours
Linear relationships between several noise indices and acoustic sensation, with PNC, Leq and LNP
having strongest relationships. Ayr et al., 2001 Field 250 Noise indices Questionnaire (4 pt, semantic and
unipolar scales)
Validated in previous survey
What: 5-min recordings of Leq,
LA5, La10, La90, LLz, LLs, NC,
RC, NCB, NR
Where: at each working position
When: unknown
LA90, LA10, and LeqA = most
strongly correlated with subjective sensations of loudness and annoyance
Author(s) Type of Sample Noise Subjective Measures Sound Measurements Main Results
Study Size Characteristic
Veitch et al., 2002 2 Lab experi-ments 35, 31 Level & frequency
14- item Questionnaire (5 pt) What: speech levels dB(A), total A-weighted noise levels; overall loudness levels Where: 1m from source as measured in a free field; at location of listener’s ear
Noise levels above 45 dB(A) = too loud
Too much high frequency unsatisfactory, but too much low frequency reduced sound masking and decreased satisfaction.
Other researchers have found that ambient noise levels were not as
responsible for ratings of annoyance as were the isolated instances in which noise levels significantly raised above the average ambient levels. Keighley (1970), found that peak noise levels above the average background noise were most responsible for employee annoyance, and that there was no relationship between ambient sound levels and acceptability ratings. He proposed that an effective means to determine acceptable noise levels in the office should not only include overall levels in dB(A) but also measures of the rate and magnitude of impact noises rising above the average level (Keighley, 1970).
4.2.2 Peak levels.
Hay and Kemp (1972) related annoyance to the amount of sound that could be heard above the background noise, and concluded that 85% of employees would remain content with the noise levels as long as office machine noise levels did not exceed 6 dB above the overall background noise levels. Tape recordings of total office noise was recorded for 60 seconds at 1200s intervals throughout the working day (8:30 a. m. – 4:45 p. m. ) at 10 different air-conditioned landscaped offices. Questionnaires were administered to 729 individuals, assessing their subjective responses to the noise.
Recall that the types of office machinery being used at that time were such things as typewriters, calculators, telex and duplicating machines, all of which have changed dramatically since the 1970’s. This study was however fairly well done; many variables such as both internal and external noise sources were considered, as well as individual differences and job characteristic variables. The results pertaining to peak levels above the ambient sound might apply to intermittent sounds today.
Dornic and Laaksonen (1989) found that noise levels chosen by participants as being “clearly annoying” ranged according to temporal variability where the average noise levels considered “clearly annoying” were 83.9 dB for continuous noise, 90 dB for intermittent regular noise and 89.6 dB for intermittent irregular noise. The results, contrary to other researchers' findings (e.g., Hay & Kemp, 1972; Keighley, 1970; Kjellberg & Landström, 1994) revealed that noise-induced annoyance was related to the overall amount of noise rather than temporal variability. It is difficult to say whether the findings of this study could be generalized to the open-plan office, however, because it was conducted in a laboratory setting, in a sound proof room, with participants who were primarily university students. The settings and situations in which these annoyance tests were conducted were completely artificial and in no way mimic a real-world open-plan office setting. Participants sat alone in an experimental room, wore head phones, and were exposed to the noise conditions for a few minutes at a time. The noise was simply white noise, with no informational content. They were required to manipulate the noise levels three consecutive times for each of the three noises until they reached the point of “clearly annoying”. Experimenters recorded the chosen intensities as well as the time it took to make the decision each time.
It seems that ambient noise levels (from all sources) that exceed 45-50 dB(A) are associated with annoyance. However, none of the above-mentioned studies investigated the effects of specific office noises and their relationship to employee satisfaction, rather, total annoyance with a combination of office noises was considered. There could be some sources that are more annoying even at lower levels, or others that are tolerable at higher levels.
4.2.3 Summary
Some researchers claim that it is not the overall ambient sound levels that determine annoyance ratings, but intermittent peak noises that fluctuate above the average levels (Hay & Kemp, 1972; Keighley, 1970; Kjellberg & Landström, 1994). We were unable to find contemporary office data to resolve the question concerning how momentary fluctuations above the average sound level are associated with annoyance.
4.3 Sound Spectrum Effects
It is generally agreed that the standard human ear perceives sounds ranging from 20 Hz to 20 kHz, and that speech sound frequencies range between 500 Hz to 5 kHz (Kryter, 1985). Current
frequency weighting measures often used to assess noise are based on equal loudness curves that describe the different hearing sensitivities of the human ear at different frequencies, which is a separate issue from the pleasantness of the hearing experience. Laird and Coyle (1929) found that high pitches are more
annoying than low or medium pitches. The papers reviewed in the following section are concerned with how certain frequencies are related to subjective perceptions of noise annoyance in the open-plan office.
Key and Payne (1981) sought to understand the effects of noise frequency on performance and annoyance. Sixty participants (30 male and 30 female) were exposed to 2-second samples of low and high frequency noises as well as one-third octave bands of pink noise (centre frequencies of 63, 125, 250, 500, 1000, 2000, 4000, and 8000 Hz) and were asked to rate how annoying they perceived each noise to be. All noises were 90 dB SPL. Results indicated a strong relationship between high-frequency noises and high annoyance ratings for both men and women.
Landström, Löfstedt, Åkerlund, Kjellberg, and Wide (1990) investigated how well different frequency weightings of noise correlated with annoyance reactions in work settings. They were particularly interested in this topic because they believed that A-weighted methods did not adequately reflect subjective noise annoyances, as had been demonstrated in other work (e.g., Kjellberg & Goldstein, 1985). Noise measurements and analyses were made in several different types of workspaces (kitchens, offices etc. ) and noise levels in dB(A), dB(B), dB(C), dB(D) and dB(lin) were computed from the third-octave-band analysis. The dB(lin) level refers to the total SPL in the frequency range of 2-14000 Hz. Noise spectra were categorised into one of three spectral types: low frequency (LF), middle frequency (MF) and high frequency (HF). Unfortunately, the specific frequency ranges for the three spectral types are not provided. Immediately after recording the noise, participants were asked to rate on a scale of 0 to 100 their noise annoyance, where 0 was the lowest possible and 100 the highest possible. Demographic information was also collected from all the participants.
Results revealed the highest annoyance ratings in the middle-frequency group (77.2 dB(lin)) with a mean noise annoyance rating of 46.7 (SD= 26.5) (Landström et al., 1990). The rating value of 46.7 was just below “rather annoyed” on the rating scale. The other two groups (LF and HF) had mean annoyance ratings of 43.6 (SD= 25.3) and 40.6 (SD= 20.1) respectively. The dB(C) and dB(D) were shown to be better predictors of annoyance than the dB(A). The C- weighting gave the best correlation with annoyance in the total group, as well as for the LF and HF groups. The D- weighting gave the highest correlation with annoyance for the MF group (Landström et al., 1990). Unfortunately, the results were not separated with respect to workplace type, therefore the results for offices in particular are not known. Moreover, it is difficult to know the extent to which the findings generalize to office settings, because the report provided few details about the physical characteristics of the workspaces studied and the
characteristics of the participants tested.
Landström, Åkerlund, Kjellberg and Tesarz (1995) conducted a study investigating the
relationship between noise annoyance and frequency. Four- hundred and thirty-nine participants, while exposed to one of three frequency- characteristic groups (low-frequency, mid-frequency and high frequency), were surveyed and asked to rate, on a scale of 0-100, noise annoyance in their workplace. Participants' workspaces varied from offices to labs to industry. Five-minute physical noise measurements and spectral analyses were made in each work setting. Low-frequency noise was characterized as noise in which the highest sound pressure level was below 200 Hz; mid-frequency as 200- 2000 Hz and high- frequency as SPL above 2000 Hz. Most of the participants were exposed to levels between 50 and 65 dB(A) with total exposure levels ranging from 45 dB(A) to 85 dB(A). The highest noise annoyance ratings were obtained for the high-frequency group and the lowest for the low-frequency group. The authors further concluded that “the results agree with previous studies indicating that the tonal components might increase annoyance levels” (Landström et al., 1995, p. 274).
Veitch et al. (2002) conducted two experiments concerning spectral effects on acoustic
satisfaction (one of which, Experiment 2, was discussed above). In the first experiment, participants rated their satisfaction after 15-min exposures to each of 15 different simulated ventilation sound spectra in combination with simulated telephone conversations (loudness level was controlled). The sound spectra varied around the ASHRAE neutral spectrum, being boosted or cut in the low (16, 31, 63 Hz), mid (125, 250, 500 Hz) and high (1000, 2000, 4000 Hz) frequency bands. The results showed that acoustic
frequency sound). Acoustic satisfaction was also predicted by the relative amount of low- to high-frequency sound, using a new acoustic variable, Lo-Hi(A), which is the difference between the
A-weighted SPL of the low-frequency band and the high-frequency band. Spectra with more low-frequency weighting were more satisfactory. However, they also allowed greater speech intelligibility (of the telephone conversations).
In the second experiment, the 15 sound conditions formed a 3 (spectrum) by 5 (noise level) factorial design. There was a statistically significant interaction in which the main effect of noise
(discussed above) varied for different spectra. Increasing the noise level reduced speech intelligibility, but the effect was greater for spectra that were stronger in high frequencies (frequencies that matched the speech sounds), and less for the spectrum that was boosted in the low- and medium-range frequencies (a poor speech masker). This interaction effect with spectrum, however, did not moderate the effect of noise level on acoustic satisfaction (louder noise improved acoustic satisfaction, but only up to the neutral midpoint on a 5-point scale from unsatisfactory to satisfactory). It seems likely that the louder noise levels (above 45 dB(A)), which were perceived as being “too loud”, attenuated the benefits of reduced speech intelligibility that the louder sound provided.
Taken together, the literature presents a confusing picture. It seems that the too much high-frequency contribution to ambient noise can be unsatisfactory or annoying; however, it is precisely those frequencies that are the best for speech masking, which decreases speech intelligibility. A masking sound spectrum that uses these frequencies can provide better masking at a lower SPL, which should also contribute to improved acoustic satisfaction. The balance point - the optimal SPL for sounds of varying frequencies - remains uncertain.
4.4 Sound Masking Effects
A few investigations have specifically tested the hypothesis that adding sound to mask office noise could improve occupants' satisfaction with the acoustic conditions.
Keighley and Parkin (1979) examined whether the introduction of sound masking (noise through various loudspeakers in the office) would increase acoustic satisfaction in a landscaped office having carpeted floors and absorbent ceiling tiles (specific absorbencies were not mentioned). This study was a follow up of a survey that had been administered 18 months before. The results of the previous survey had indicated a high number of the occupants were unsatisfied with the acoustical environment. The ambient noise levels in the unoccupied office (including ventilation noise) were 34-36 dB(A), excluding any masking sound. In the occupied office, prior to any masking, L10 (levels exceeded 10% of the time) was 56 dB(A), L50 (levels exceeded 50% of the time) was 50 dB(A), and L90 (level exceeded 90% of the time) was 44 dB(A). The sound masking installation consisted of 50 loudspeakers mounted above ceiling grilles spaced 3m apart. Twelve different noise conditions were tested for 3 weeks each. The noise conditions varied in their spectral qualities and content, but never were higher than 46 dB(A). Some were steady at one level, others varied; two were the sound of a stream with a waterfall. Individuals completed 15 questionnaire surveys: One was administered 18 months prior to the experiment, the second was administered just before the experiment, the next 12 corresponded to each sound condition, and a final survey was administered 3 weeks after the experiment ended.
Results indicated only slight improvements with the sound masking, with the percentage of people satisfied with the overall noise climate never exceeding 62%, lower than their target level of 80%. There were significant effects in which louder noise conditions were less acceptable, although they did mask others' conversations. The authors concluded “… The outcome of this study does support the view that artificially increased background noise is not a universally applicable remedy for noise problems in the landscaped office” (Keighley & Parkin, 1979, p. 323). They furthermore concluded that levels above 46 dB(A) would achieve adequate masking, but felt that such levels would be regarded as unacceptable by the majority of office workers.
Loewen and Suedfeld (1992) found that masking noise decreased disturbance, despite the fact that the overall sound level was increased. A total of 45 student participants were exposed to three
different conditions of noise: no extraneous noise (served as the control), unmasked office noise, and masked office noise, to determine their differential effects on arousal, stress and cognitive performance. The unmasked noise consisted of pre-recorded noise from a real office setting and was maintained at an average level of 45 dB(A), with bursts to 60-66 dB(A). The masked noise consisted of the same pre-recorded office noise with the addition of noise from a commercial sound masking system played at 59 dB(A), with a combined effect of 61 dB(A). Participants were required to complete two cognitive tests as well as mood and environmental stressor questionnaires for each of the three noise conditions. Results indicated that masked noise (61 dB(A)) led to the highest levels of arousal, whereas unmasked office noise, which was less loud, resulted in the highest ratings of distraction and stress. One possibility is that the additional sound masking reduced the effect of unpredictable peak sounds in the office noise.
Veitch et al. (2002), in the experiments discussed above, attempted to quantify the relationship between characteristics of masking noise associated with satisfaction based on speech intelligibility indices. Their Experiment 2 found that SII was a good predictor of acoustic satisfaction. As expected, lower SII values were associated with higher acoustic satisfaction and lower speech intelligibility. However, all of the noise conditions that provided low SII occurred at high SPL levels that were
perceived as being too loud. This probably accounts for the result that acoustic satisfaction never reached above the neutral midpoint on the unsatisfactory - satisfactory scale (i.e., was never perceived as being positive). This finding needs to be replicated with other means of manipulating speech:noise ratios, such as limiting sound transmission, that would avoid this confound.
Overall, it appears that sound masking can contribute to acoustic satisfaction in open-plan offices. However, both their level and spectral properties should be selected so that the overall acoustic
environment is neither too loud nor too hissy, while still masking annoying speech sounds.
5.0 Discussion
5.1 Research Limitations
Combining the results from the varied literature cited here is made more difficult by several limitations:
• Poor reporting. Many investigations failed to report crucial details, such as the characteristics of the
individuals who participated, descriptive statistics for acoustic conditions (whether measured or manipulated), and descriptive and inferential statistics for outcome measures (e.g., annoyance ratings, acoustic satisfaction ratings, etc.).
• Inattention to measurement variability and reliability. The lack of agreement concerning the
outcome measures related to acoustic satisfaction reflects in part the absence of developmental work on measurement of this construct and its subdimensions. Without a reliable and valid measurement tool for acoustic satisfaction (using this as a label for the global construct), the validity of research results may be questioned and cross-study comparisons are problematic.
• Incomparable sound measurements. Each research team reports the values that it believes to be
most useful, resulting in a diverse collection of observations and recommendations, some in dB(A), others in dB(B), some reporting spot measurements and others integrated Leq measurements. This makes it almost impossible to compare results from one investigation to another, except in the rare cases where multiple measurements were reported and some of them are in common. Researchers should report multiple acoustic indicators in order to facilitate such comparisons.
5.2 Future Directions
Future research should be directed towards replicating some of the studies mentioned here, to validate and strengthen the findings. A substantial effort should be made to standardise and validate the measures and assessment tools that are currently being used, to provide a clearer path towards a solution.
Longer-term field studies should also be carried out. The majority of acoustic studies conducted in the past have exposed participants to relatively short durations of sound conditions (just a few hours or
just one day). Studies exposing participants to various sound conditions over longer periods of time would better reflect real world situations.
Given the importance of speech privacy/intelligibility in open-plan offices, there is a most urgent need for more systematic research into the prediction of acoustic satisfaction from composite measures such as SII.
6.0 Conclusions
The aim of this literature review was to quantify the relationship between specific characteristics of sound and acoustic satisfaction in the open-plan office. Firm conclusions as to the most desirable acoustic qualities of open-plan offices are difficult to make because of the limitations in the literature, particularly the lack of agreement about the outcome measure and inadequate reporting of research design and statistical details. However, there is no question that noise is among the most consistently reported problems in open-plan offices (Brill et al., 2001; Sundstrom et al., 1994). Based on this review, we conclude that acceptable acoustic conditions in open-plan offices should have average noise levels around 45-50 dB(A) (see Figure 3).
Speech is a dominant source among those that cause complaints from occupants of open-plan offices. Clearly, the transmission of speech through the space needs to be controlled; however, there is little empirical guidance as to the degree of speech privacy that is needed. Few studies have
systematically examined relationships between composite measures of speech privacy/intelligibility and acoustic satisfaction. Therefore, we may only tentatively conclude that the rule-of-thumb that SII should be 0.20 or lower is reasonable. This needs to be achieved, however, in a careful manner that avoids excessively loud masking sounds, and that has an appropriate balance between frequencies so that the resulting acoustic environment would not be characterized as “hissy”. This poses a challenge to acousticians because the same high frequencies that contribute to hiss are the most effective speech maskers.
Tang & Wong, 1998** Warnock 1973 Kjellberg et al., 1996* Landström et al 1991 Keighley et al. 1979 Veitch et al 2002 Ayr et al 2001
Figure 3. Acoustic conditions in open-plan offices. Grey bars indicate the ranges of sound levels tested or
measured in each study. The black markers indicate the highest sound levels associated with satisfaction. *Approximation based on Figure 1 in Kjellberg et al., 1996. ** Approximation based on Figure 3 in Tang & Wong, 1998. 100 90 80 70 60 50 40 30 dB(A)
A complete catalogue of means to reduce speech transmission in open-plan offices is beyond the scope of this review. Adding an appropriate simulated ventilation noise, at an appropriate level, to mask speech sounds is but one route to this goal, but at a cost in energy consumption as well as installation and maintenance. Other means might limit acoustic problems as well, but without ongoing costs. Source attenuation would reduce overall noise levels. The speech problem could be reduced in severity by implementing behavioural protocols to encourage softer speech; indeed, the limited evidence from Warnock and Chu (2002) suggests that people already speak more softly in open-plan offices than standards assume. Limiting sound transmission through the use of absorptive materials and appropriate layouts will also assist (Wang & Bradley, 2002).
Given the importance of noise to occupants of open-plan offices, it is remarkable how little empirical research exists to support recommendations aimed at maximizing satisfaction with these ubiquitous spaces. The recommendations made here must be considered preliminary, pending better co-operation between acousticians and psychologists, the application of more rigorous research designs, and the development of a body of knowledge based on the sound conditions that prevail in the 21st century.
7.0 References
American National Standards Institute. (1970). American national standard methods for the calculation
of the articulation index (ANSI S3.5-1969). New York: Acoustical Society of America.
American National Standards Institute. (1997). Methods for calculation of the speech intelligibility index (ANSI S3.5-1997). New York: Acoustical Society of America.
Ayr, U., Cirillo, E., & Martellotta, F. (2001). An experimental study on noise indices in air conditioned offices. Applied Acoustics, 62, 633-643.
Beranek, L. L. (1971). Noise and Vibration Control . New York: McGraw Hill.
Beranek, L. L. (1947). The design of speech communication systems. Proceedings of the I.R.E. (pp. 880-890).
Boyce, P. R. (1974). Users' assessments of a landscaped office. Journal of Architectural Research, 3(3), 44-62.
Bradley, J. S., & Wang, C. (2001). Measurements of sound propagation between mock-up workstations. Unpublished manuscript.
Brill, M., Weidemann, S., & BOSTI Associates. (2001). Disproving widespread myths about workplace
design . Jasper, IN: Kimball International.
Brookes, M. J., & Kaplan, A. (1972). The office environment: Space planning and affective behavior.
Human Factors, 14(5), 373-391.
Cohen, S., & Weinstein, N. (1982). Nonauditory effects of noise on behavior and health. In G. W. Evans (Ed.), Environmental Stress (pp. 45-74). New York: Cambridge University Press.
Dornic, S., & Laaksonen, T. (1989). Continuous noise, intermittent noise, and annoyance. Perceptual and
Motor Skills, 68, 11-18.
French, N. R., & Steinberg, J. C. (1947). Factors governing the intelligibility of speech sounds. Journal of
the Acoustical Society of America, 19(1), 90-119.
Glass, D. C., & Singer, J. E. (1972). Urban stress: Experiments on noise and social stressors. New York: Academic Press.
Glass, D. C., Reim, B., & Singer, J. E. (1971). Behavioral consequences of adaptation to controllable and uncontrollable noise. Journal of Experimental Social Psychology, 7, 244-257.
Graeven, D. B. (1975). Necessity, control, and predictability of noise as determinants of noise annoyance.
Journal of Social Psychology, 95, 85-90.
Hay, B., & Kemp, M. F. (1972). Measurements of noise in air-conditioned, landscaped offices. Journal of
Sound and Vibration, 23(3), 363-373.
Hedge, A. (1982). The open-plan office: A systematic investigation of employee reactions to their work environment. Environment and Behavior, 14(5), 519-542.
Hellman, R. P. (1982). Loudness, annoyance, and noisiness produced by single-tone-noise complexes.
Journal of the Acoustical Society of America, 72(1), 62-73.
Hundert, A. T., & Greenfield, N. (1969). Physical space and organizational behavior: A study of an office landscape. Proceedings of the 77th Annual Convention of the American Psychological
Association (APA) (pp. 601-602). Washington, D.C.: APA.
International Organization for Standardization (ISO). (1987). Acoustics -- Normal equal-loudness level
contours (ISO 226:1987). Geneva, Switzerland: ISO.
Keighley, E. C. (1966). The determination of acceptability criteria for office noise. Journal of Sound and
Vibration, 4(1), 73-87.
Keighley, E. C. (1970). Acceptability criteria for noise in large offices. Journal of Sound and Vibration,
11 (1), 83-93.
Keighley, E. C., & Parkin, P. H. (1979). Subjective response to sound conditioning in a landscaped office.
Journal of Sound and Vibration, 64(3), 313-323.
Key, K. F., & Payne Jr., M. C. (1981). Effects of noise frequency on performance and annoyance for women and men. Perceptual and Motor Skills, 52, 435-441.
Kjellberg, A., & Goldstein, M. (1985). Loudness assessment of band noise of varying bandwidth and spectral shape: An evaluation of various frequency weighting networks. Journal of Low
Frequency Noise and Vibration, 64, 12-26.
Kjellberg, A., Landström, U., Tesarz, M., Söderberg, L., & Åkerlund, E. (1996). The effects of
nonphysical noise characteristics, ongoing task and noise sensitivity on annoyance and distraction due to noise at work. Journal of Environmental Psychology, 16, 123-136.
Kjellberg, A., & Landström, U. (1994). Noise in the office: Part II - The scientific basis (knowledge base) for the guide. International Journal of Industrial Ergonomics, 14, 93-118.
Kryter, K. D. (1985). The effects of noise on man. Orlando, FL: Academic Press.
Laird, D. A., & Coyle, K. (1929). Psychological measurements of annoyance as related to pitch and loudness. Journal of Acoustical Society of America, 1, 158-163.
Landström, U., Åkerlund, E., Kjellberg, A., & Tesarz, M. (1995). Exposure levels, tonal components, and noise annoyance in working environments. Environment International, 21(3), 265-275.
Landström, U., Kjellberg, A., & Soderberg, L. (1998). Noise annoyance at different times of the working day. Journal of Low Frequency Noise, Vibration and Active Control, 17(1), 35-41.
Landström, U., Löfstedt, P., Åkerlund, E., Kjellberg, A., & Wide, E. (1990). Noise and annoyance in working environments. Environment International, 16, 555-559.
Landström, U., Kjellberg, A., & Söderberg, L. (1991). Spectral character, exposure levels and adverse effects of ventilation noise in offices. Journal of Low Frequency Noise and Vibration, 10, 83-91. Loewen, L. J., & Suedfeld, P. (1992). Cognitive and arousal effects of masking office noise. Environment
and Behavior, 24(3), 381-395.
Moreland, J. B. (1988). Ambient noise measurements in open-plan offices. The Journal of the Acoustical
Society of America, 83(4), 1683-1685.
Nemecek, J., & Grandjean, E. (1973). Noise in landscaped offices. Applied Ergonomics, 4(1), 19-22. Oborne, D. J. (1987). Ergonomics at work. New York: John Wiley & Sons.
Oldham, G. R., & Brass, D. J. (1979). Employee reactions to an open-plan office: A naturally-occurring quasi-experiment. Administrative Science Quarterly, 24, 267-284.
Pirn, R. (1971). Acoustical variables in open planning. Journal of the Acoustical Society of America,
49(5), 1339-1345.
Reim, B., Glass, D. C., & Singer, J. E. (1971). Behavioral consequences of exposure to uncontrollable and unpredictable noise. Journal of Applied Social Psychology, 1(1), 44-56.
Sailer, U., & Hassenzahl, M. (2000). Assessing noise annoyance: An improvement-oriented approach.
Ergonomics, 43(11), 1920-1938.
Sundstrom, E. (1986). Workplaces: The psychology of the physical environment in offices and factories. Cambridge, UK: Cambridge University Press.