The Application of Information Technologies to Public
Transportation
by
Chi Fun Jimmy Lam
B.ASc., Department of Civil Engineering, University of
Toronto (1992)
Submitted to the Department of Civil and Environmental
Engineering in partial fulfillment of the requirements for
the degree of
Master of Science in Transportation
at the
MASSACHUSETTS INSTITUTE OF TECHNOLOGY
June 1994
© Massachusetts Institute of Technology, 1994. All Rights Reserved.
A uthor ...
,,
..
... ...
Departient of Civil and Environmental Engineering
June 8, 1994
C ertified by ... , ...,.
...
Nigel H.M. Wilson
Department of Civil and Environmental Engineering
Thesis Supervisor
"F)
Accepted by ...
...
...
... ...
Joseph Sussman
Chairman, Departmental Committee on Graduate Studies
Wffl DPA =vw
The Application of Information Technologies to Public Transportation
by
Chi Fun Jimmy Lam
Submitted to the Department of Civil and Environmental Engineer-ing on June 8, 1994, in partial fulfillment of the requirements for
the degree of Master of Science in Transportation
Abstract
This thesis investigates the potential uses of information technologies for transit applica-tions; specifically to the real-time functions of operations monitoring and control and pas-senger information. To an agency that is currently considering technology to improve performance, this thesis guides the agency through the many issues that should be
addressed.
The research first investigated the information needs of these two functions, the relative value of these types of information and the potential for information technologies to meet these information needs. It was found that for both functions, vehicle location information is essential, and other types of information such as passenger loads, service disruption information and vehicle status might also be useful. Information technologies have the potential to gather and deliver this information quickly and on a system-wide basis. The thesis then investigated the wide range of technologies currently available and identi-fied Automatic Vehicle Location (AVL) systems as the ones which best satisfies these functions' needs. AVL systems consists of vehicle location, communications, hardware and software, and human systems, and there are many issues that need to be resolved when choosing AVL system technology.
Case studies of three agencies currently implementing information technologies revealed several benefits of AVL systems. For AVL systems that have operations monitoring and control functionalities, the real-time benefits included better schedule adherence, increased safety and security, the potential for increased supervisory efficiency and the potential for improved work environments. The real-time benefits of passenger informa-tion systems included limited travel and wait time savings, improved passenger percep-tions and a willingness on the passenger's part to pay a premium for passenger information. The costs for AVL systems can be categorized into development costs, capi-tal costs and ongoing operating costs. Before these systems are implemented, however, agencies have to identify the best use for information technologies and this thesis devel-oped a framework that can help structure the agency's selection of an appropriate informa-tion technology.
Thesis Supervisor: Nigel H. M. Wilson
Acknowledgements
There are many people who I would like acknowledge for their help, support and encouragement during my memorable stay at M.I.T.
First and foremost, I would like to thank my thesis supervisor Nigel Wilson, who is both a scholar and a gentleman. Not only did he help financially, providing much needed funding support through research and teaching assistantships, he was also the "compass" that put me back in the right direction whenever I would wander off.
I would also like to thank the many people who took time out of their busy schedules to assisted in my research. Special mentions go out to Joel Koffman and Peter Van der Kloot at OC Transpo, Rein Alasi, Ted Harris, Dave Taylor and Eugene Catney at the TTC and all of the inspectors, controllers and system support personnel at both agencies. Both agencies run top-notch operations, and with people like these, I can see why.
There are many friends and colleagues here at MIT who have provided many special memories and enjoyable moments of friendship. Many thanks to Dawn, C.J. Geoff, Mimi, Tilly, Prodyutt and many of my collegues in the department. Special thanks go to my mother and father in Toronto. All I do here and in the future, I do for you.
Lastly, I would like to acknowledge Eric Miller from the University of Toronto, who initially peaked my interest in Transportation studies and made my sojourn here a possibil-ity. It has been quite an experience.
Table of Contents
1 Introduction... 9
1.1 System Performance ... ... 10
1.1.1 Operations Monitoring and Control... 11
1.1.2 Passenger Information Systems ... ... 13
1.1.3 Service Planning Function ... ... 14
1.2 Information Technologies... 16
1.3 Literature Review ... 19
1.4 Organization of the Thesis ... ... 24
2 Potential for Application of Information Technologies... ... 25
2.1 Introduction ... 25
2.2 Causes of Unreliability ... 26
2.3 Operations Monitoring and Control... ... 28
2.3.1 Control Strategies ... 29
2.3.2 Information Needs and Uses ... ... 35
2.4 Passenger Information ... 37
2.4.1 Information Needs and Uses ... ... 39
3 Information Technologies ... 42
3.1 Introduction ... 42
3.2 History and Literature Review... 44
3.2.1 H istory ... ... 44 3.2.2 Literature Review ... 48 3.3 Location Technologies ... 51 3.3.1 O dom eter ... 51 3.3.2 Dead Reckoning... 53 3.3.3 Signposts ... 53
3.3.4 Global Positioning Systems (GPS) ... ... 55
3.3.5 LORAN-C... 56 3.3.6 Map Matching... 57 3.3.7 Com binations ... 57 3.3.8 Comparative Analysis... 58 3.4 Communications Systems ... 60 3.4.1 C able/W ire ... . 62 3.4.2 Conventional Radio ... 63 3.4.3 M icrow ave ... . 64 3.4.4 C ellular.. ... 65
3.4.5 Spread Spectrum Systems... ... 66
3.4.6 H ybrids... 67
3.4.7 Comparative Evaluation ... ... 68
3.5.1 Collection and Processing of Data... ... 71
3.5.2 User Interfaces ... 73
3.5.3 Storage and Output ... 75
3.5.4 System Control ... 76
3.6 Human Factors ... 76
3.6.1 Operators... 78
3.6.2 Inspectors ... 81
3.6.3 Controllers ... 82
3.6.4 System Programmers and Supporters ... .... 83
3.6.5 Analysts and Decision-makers... 84
3.6.6 Passengers ... 85
4 C ase Studies... 86
4.1 Introduction ... 86
4.2 Toronto Transit Commission (TTC) ... ... 87
4.2.1 Introduction... 87
4.2.2 Prior Service Control Methods ... ... 88
4.2.3 History of CIS ... 88
4.2.4 Location Technology ... ... 90
4.2.5 Communications technology ... ... 90
4.2.6 Computer Hardware and Software ... ... 92
4.2.7 H um an Factors ... ... 97
4.2.8 Off-line Functions ... 98
4.2.9 Development and Installation of CIS and Training of Users... 100
4.2.10 Costs... 102
4.2.11 Benefits and Effectiveness of CIS ... 105
4.2.12 Opinions about CIS... ... 111
4.2.13 Overall Evaluation ... 116
4.3 OC Transpo... 118
4.3.1 Introduction.. ... 118
4.3.2 Prior Methods ... 121
4.3.3 APC System... 121
4.3.4 Passenger Information Systems ... 124
4.3.5 Operations Monitoring and Control... 126
4.3.6 C osts... 132
4.3.7 Development, Installation And Training ... ... 134
4.3.8 Overall Effectiveness and Comparative Assessment... 135
4.4 London Transport ... 139
4.4.1 Introduction.. ... 139
4.4.2 Institutional Arrangements in London ... 140
4.4.3 Prior Systems and History ... 142
4.4.4 Location Technology ... 145
4.4.5 Communications Technology ... 146
4.4.6 Hardware and Software Technology ... 146
4.4.8 Costs... 149
4.4.9 Countdown Effectiveness ... 151
4.4.10 Technology Implementation In a Deregulated or Privatized Context. 155 4.4.11 Overall Countdown Assessment ... 159
4.5 Others ... 160
4.5.1 Operations Monitoring and Control Systems ... 161
4.5.2 Passenger Information Systems ... 165
5 A Framework for Selecting Technology Applications ... 170
5.1 Introduction ... 170
5.2 Appropriate Uses for Information Technology ... ... 171
5.2.1 Service Quality ... 173
5.2.2 Operations Costs ... 175
5.2.3 Public Perceptions... 176
5.2.4 Security ... 177
5.2.5 Combinations ... 178
5.3 AVL General Design Issues ... 181
5.3.1 Centralized vs. Decentralized Systems ... 182
5.3.2 Hardware -Software -Labor Substitutions ... 184
5.3.3 Cost vs. Accuracy ... 190
5.3.4 Discrete vs. Quasi-Continuous Location ... ... 192
5.4 Operations Monitoring and Control Benefits ... 194
5.5 Passenger Information Systems Benefits... 197
5 .6 C osts... 199
5.6.1 Development Costs ... 200
5.6.2 Capital Costs ... 201
5.6.3 Operating Costs ... 202
5.6.4 Example Cost Breakdowns ... 202
5.6.5 Costs for Incremental Functionality ... 204
6 Summary and Conclusions ... 207
6.1 Potential for Information Technologies in Real-Time Operations ... . 207
6.2 Information Technologies ... 208
6.3 C ase Studies ... 2 10 6.4 Framework for Agency Decision-Making ... 214
6.5 Areas for Future Study ... 217
List of Tables
Table 1.1: Real-time Situations Affecting Service ... 12
Table 1.2: Early North American Computer and Communication Systems... 17
Table 2.1: Information in Transit Operations Management ... 26
Table 2.2: Route-Related Factors Influencing Reliability ... . 27
Table 2.3: Bus Control Strategies ... 30
Table 2.4: Service Restoration Actions ... ... 31
Table 2.5: Responsibilities for Control Decisions on the Green Line ... 34
Table 2.6: Types of Information for Operations Monitoring and Control... 37
Table 2.7: Passenger Information Types ... ... 40
Table 3.1: Broad Analysis of AVL Systems for Urban Applications ... 60
Table 4.1: Original Projected and Estimated Total Costs of CIS Phase VI... 103
Table 4.2: Schedule Adherence: Jane Bus Route ... 108
Table 4.3: Surface Supervisory Staff ... 110
Table 4.4: Cost Estimate for Nag's Head Scheme... 150
Table 4.5: Component Reliability and System Availability of Countdown ... 152
Table 4.6: Countdown Forecast Accuracy ... 152
Table 4.7: Roles and Responsibilities of Parties Associated with PIBS ... 158
Table 5.1: Relative Hardware, Software and Labor Costs for Different Sized Systems... 189
Table 5.2: Relative Costs of Quasi-Continuous vs. Discrete Systems ... 193
Table 5.3: North American AVL Systems ... 199
Table 5.4: Allocation of Costs for TTC's CIS Phase VI ... 203
Table 5.5: Allocation of Costs for London Transport's Nag's Head Scheme... 203
Table 5.6: Incremental Cost Estimate of Full OMC ... 205
List of Figures
General Components of an AVL System... ... 43
Alternative Location Technologies ... ... 52
Alternative Communications Technologies ... 62
Hardware and Software Components of an AVL System... 72
Human Roles in an AVL System ... ... 78
Schematic of CIS ... 93
Percent Deviation From Mean Headways... 109
OC Transpo's AVL/C ... 120
Labor Inputs Into AVL/C ... 133
Schematic Diagram of AVL & PIBS System ... 147
Example Countdown Display ... 148
Decision Tree for Application of Information Technologies ... 172
Cost vs. Accuracy of AVL Technologies... 190
Figure 3.1: Figure 3.2: Figure 3.3: Figure 3.4: Figure 3.5: Figure 4.1: Figure 4.2: Figure 4.3: Figure 4.4: Figure 4.5: Figure 4.6: Figure 5.1: Figure 5.2:
Chapter 1
Introduction
The improvement of system performance is prime goal that every transit operator strives to achieve either by improving quality of service without substantially increasing costs, or by reducing costs without substantially degrading service. With continuing improvements in the cost/performance of computer and communications technologies, many agencies are looking to these technologies to help them optimize system perfor-mance. A subset of these emerging technologies is being used for three particular func-tions: operations monitoring and control, passenger information, and functions related to service planning.
The objective of this thesis is to take a closer look at the three critical service-related functions (with primary attention focused on the real-time functions of operations monitoring and control and passenger information), and the alternative technologies that can be used to improve their performance. This thesis also develops an approach for selecting an appropriate information technology and assesses the benefits of these systems to these real-time functions. Specifically, this thesis intends to answer the following ques-tions:
* What are the needs of these service-related real-time functions and how might com-puter and communications systems improve system efficiency and effectiveness? * What type of computer and communications technologies are available to be applied to
these real-time functions and how can they be used?
* What are the best uses for information technology and how effective are these technol-ogies in improving these functions?
With the information provided in this thesis, agencies interested in acquiring new sys-tems for the purposes of operations monitoring and control, passenger information, or other functions to improve system performance will have a better understanding of the implications of their choice on overall performance. They will thus be in a better position to choose a technology appropriate to their needs and then apply the technology effec-tively.
1.1 System Performance
Every transit operator must be concerned about system performance. Passengers who use the system have high expectations about service quality, desiring service to be fre-quent, regular and structured to take them places they wish to go.
Agencies respond to the service challenge by first developing a comprehensive service plan in which the routes and levels of service are determined by considering passenger needs and trading them off against the cost of service provision. To develop an effective service plan, data needs to be collected on travel patterns and system usage. This data col-lection function and associated service planning functions, which primarily operate in an off-line manner, are described later in this section.
After service plans are developed, agencies must make sure that operations occur con-sistently and reliably on a day-to-day basis according to the plan. Any functions that sup-port operations must occur on a real-time basis. Two of the major functions used to aid in service operations are operations monitoring and control and passenger information, both of which are described below.
1.1.1 Operations Monitoring and Control
As with any service industry, transit service must be "consumed" as it is "produced", which places great importance on the reliability and quality of service delivery and stresses real-time oversight. The operations monitoring and control (OMC) function of a transit agency serves to ensure that vehicles are closely adhering to the operating plan and to identify and ameliorate significant deviations from the plan. Operations monitoring and control is also used to detect and deal with emergencies. The monitoring element detects vehicles that are not serving their route, not on time or evenly spaced, while the control element implements strategies to re-optimize service given the current system state. While both elements are important, the ability to intervene effectively is critical to the OMC sys-tem actually improving performance -simply detecting a problem may be of little value.
Making sure that vehicles run at constant headways can be quite challenging, depend-ing on the technology and the operatdepend-ing situation. If the operatdepend-ing conditions are generally clear of problems such as congestion or frequent vehicle breakdowns or if guideway tech-nology gives vehicles an exclusive right of way, then it is generally easier to maintain con-stant headways. Under other conditions, many situations can occur which can cause irregularities in service. The type of situations that can occur largely depends upon the vehicle and its operating environment. Vehicles that operate on exclusive rights-of-way on fixed guideways (e.g. rail vehicles) can encounter somewhat different situations than vehi-cles that operate on a shared right-of-way in mixed traffic (e.g. buses). Example situations and their effects on service are shown in Table 1.1.
The role of operations monitoring and control is to identify and respond to these situa-tions as they occur in order to mitigate their effects on service quality and operasitua-tions costs. Several strategies have been developed in theory and some are used in the field.
Theoreti-cally, each strategy can be effective in specific circumstances, but these strategies may not be as effective in practice. One of the reasons for this is that most transit operators have had to rely on labour intensive techniques to perform operations monitoring and control, and these techniques may not collect the information needed to make effective control
decisions. Current trends, however, are to rely more on computer and communications
systems to help perform this function by gathering the needed information. Advanced technologies also can improve field operating conditions, for example, signal preemption systems can selectively regulate vehicle running times by adjusting the traffic lights along a vehicle's route.
Situation Rail System Effect Bus System Effect
Emergency occurs on vehicle Train is forced to stay at station. All passengers on All passengers on bus must wait until situation is train must wait. Trailing trains may be forced to wait resolved. Bunching may occur locally but since buses until situation is resolved. can overtake each other, the effect on other buses is
minimal.
Emergency right-of-way closure. Train service is cut off for a portion of a route. Clo- Buses are forced to go off-route, affecting running sure usually affects entire route since trains have no times, headways and schedules, but service on the alternative routes. parts of the route not closed can still be maintained,
although at a degraded level.
Heavy passenger loading Train is forced to stay at station, affecting local head- Bus is forced to stay at stop longer than usual, affect-ways and schedules. Train bunching may occur, but ing headways and schedule. Bus bunching may occur dwell times are not too sensitive to passenger loads since dwell times are very sensitive to passenger
loads.
Vehicle breaks down Train is forced off route and passengers must unload. All scheduled pickups for bus on remaining stops are Until train goes off route, all trailing trains nearby compromised. Bus must unload passengers as they must slow or stop, drastically affecting service at a are forced to wait for the next bus.
local level.
Operator is not available to run Replacement operator needs to be found; if one not Replacement operator needs to be found; if one not vehicle found, then train will not run, which will leave a ser- found, then train will not run, which will leave a
ser-vice gap. vice gap.
Table 1.1: Real-time Situations Affecting Service
An aim of this research is to examine the strategies available to monitor and control vehicles and the ways in which these strategies are currently being implemented. This research will then look into the effectiveness of these strategies and how computer and
communications systems might be used to improve the effectiveness of control. The
improving this function. Although signal preemption is a potentially beneficial application for information technologies, it will not be investigated in this thesis.
1.1.2 Passenger Information Systems
Passenger information has always been an important element of any transit service since people who may want to use the system need to know what services that are being offered. The requisite passenger information can be provided in many forms, typically including maps and schedules of routes, telephone systems that provide transit tion, and signs and structures identifying boarding locations. This type of static informa-tion on the operating plan may also include advertisements telling passengers of changes in service or fares and policies, or even passenger points of contact such as passenger agents who answer passenger enquiries.
All of these components are used to give passengers needed information about the sys-tem so that they can make informed travel decisions. This information changes infre-quently, however, and only pertains to regularly operated service. When service is disrupted, these components cannot give the passenger any information about current per-formance. It is possible, however, for current information to be made available in real-time to solve this problem. Systems that are capable of doing this will be called dynamic, or real-time passenger information systems (PIS). Currently, some operators attempt to pro-vide real-time information by doing such things as sending out inspectors to particular places to tell passengers about situations, sending voice messages through speaker-phones, or displaying information visually on screens in terminals.
These strategies may not be very effective, however because these manual systems are slow and by the time the information gets through to the public, it may already be too late for passengers to act as they would have preferred. Transit operators are searching for
bet-ter ways to communicate real-time information such as service disruptions to affected pas-sengers by making use of computer and communications systems.
This thesis will examine the role of passenger information and its effect on overall ser-vice performance. The thesis will investigate how advanced technologies can be applied to the passenger information function to improve overall efficiency and effectiveness, and the extent to which these improvements are likely to result. A comparative analysis will also be done between the passenger information and OMC functions.
Information technologies have not only affected the operations monitoring and control and passenger information functions of transit. These technologies have found their ways into almost every facet of transit operations and planning including management (auto-mated collection and analysis of performance statistics), planning (auto(auto-mated route sched-uling software and automatic passenger counters), finance (automated cost accounting), dispatching (automated dispatch control) and vehicle technology (automatic vehicle con-trol, automatic vehicle maintenance) just to name a few [Davies 28]. Some of these tech-nologies operate in real-time (e.g. dispatching and vehicle control), but most of them are used in off-line applications. Although all of these technologies are having a profound impact in the industry, this thesis's prime focus is on the technology associated with the automatic location of vehicles and the real-time uses of that information.
1.1.3 Service Planning Function
A critical function which supports the service planning process is data collection and analysis. While the type of data that is gathered varies between agencies, it typically includes passenger counts, revenue, and vehicle trip information, [40] all of which is used in evaluating and refining service and operating plans. Historically, data collection has been labour intensive and costly, often meaning that data is collected on only a very small
sample basis, resulting in a weak base for decision-making by planners. Recognizing this, agencies have begun replacing their manual data collection systems with automated or semi-automated computer and communications systems. These new technologies promise benefits and efficiencies that cannot be achieved by previous systems.
These information systems can potentially both improve the quality of the data and reduce the marginal cost of data collection, thus enabling more data to be collected on a continuing basis. This in turn would give decision makers better information on which to base their service plans. While accumulating better data does not guarantee a better ser-vice plan, it does remove a major obstacle to good planning.
This is well illustrated by the Ottawa Carleton Regional Transportation Commission (OC Transpo), which has been using an Automated Passenger Counting (APC) system for many years which has allowed them to collect detailed data on a more frequent basis than the previous manual collection system. The result has been a clearer picture of the service that OC Transpo provides and as a result, the agency has been able to tailor their services better to meet passenger needs. At the same time, the agency has been able to reduce costs, both by replacing the manual data collection system with a less expensive automated one and by identifying and correcting inefficiencies in the service plan detected from the anal-ysis of the data collected by their APC. OC Transpo's APC systems clearly shows that the utilization of advanced technologies for data collection to support service planning can be cost-effective. OC Transpo's APC system is investigated in more detail in the case studies chapter of the thesis.
Another example of advanced technology which can support the service planning function is the electronic farebox, which can automatically count revenue and boarding passengers. Electronic fareboxes also record running totals and can count passengers by different fare categories.
1.2 Information Technologies
The transit industry's current interest in the computerization and automation of its sys-tems has gathered significant momentum of late. In 1994 there are 28 agencies in North America using or intending to use an Automatic Vehicle Location (AVL) technology ver-sus only 6 agencies 15 years ago [57, 34]. In many places in Europe (e.g. London, Dublin, and Germany) and Japan (e.g. Tokyo and Osaka), systems based on advanced technolo-gies have been in place for quite some time [34]. For the most part, full scale implementa-tion efforts in Europe and Japan has preceded similar efforts in North America.
Transit operators have been contemplating the potential benefits of computer and com-munication systems for many years. Example applications such as signpost-odometer sys-tems and passenger counting syssys-tems were developed by a few transit agencies as early as the 1970's (see Table 1.2). The main obstacles to their widespread use in the past, how-ever, were that the technologies were extremely expensive, crude and inaccurate, and did not satisfy the data needs of these agencies.
Over the last 10 to 15 years, however, computer systems have become more powerful and less expensive, and the advance of satellite, microwave and cellular technologies have made it possible to provide inexpensive and reliable communication networks. As a result, it has become much more feasible to apply these technologies cost-effectively to public transportation than it was previously, and the range of technologies have increased sub-stantially.
For the purposes of performance monitoring, many transit operators have similar information needs: vehicle location and (perhaps) number of passengers. There is one sub-set of technologies that seems to address these basic information needs: Automatic
Vehi-City Year Initiated Intent Status as of 1979
Chicago 1969 AVM Demo Completed:
Emer-gency vehicle location done
Toronto 1974 AVM Demo Pilot/Evaluation
Cincinnati 1975 TIS Demo Active/Expanding
Mississauga 1977 AVL & Info System Active/Expanding
New York City 1979 Full AVM Being Developed
Los Angeles 1979 AVM Demo Being Developed
AVL = Automatic Vehicle Location, AVM = Automatic Vehicle Monitoring, TIS = Transit Information System
Table 1.2: Early North American Computer and Communication Systemsa
a. Source: Hamilton and Polhemus [34]
cle Location (AVL) systems and subsystems. An AVL technology is defined as one that has the capability of providing real-time vehicle location information with subsystems to process this data to provide information to the transit operator in a useful form. AVL sub-systems include communications, hardware, software and user interface components.
Some AVL technologies are sometimes referred to as Automatic Vehicle Monitoring (AVM) or Automatic Vehicle Identification (AVI) technologies. AVM technologies are similar to AVL technologies but they may also include all of the subsystems necessary to provide monitoring whereas AVI technologies locate and identify vehicles on a more dis-crete basis than AVL technologies which provide more or less continuous information. In many cases, however, these terms are used interchangeably.
When a computer and communications system is designed for transit applications, the following issues must be considered:
Centralization versus Decentralization
A system can be designed to have most of the equipment, processing and
controlled vehicles "dumb" followers. Alternatively, equipment, processing and decision-making can be partially decentralized by putting more processing, equipment and deci-sion-making capabilities onto the vehicles. Each approach to system design has specific advantages and disadvantages.
Hardware-Software-Labor Substitutability
How much hardware and software is needed, and how does the system interact with the users? Both hardware and software are needed to make a system work, and in some cases software can be used as a partial substitute for hardware. In some cases, both hard-ware and softhard-ware can replace functions normally done by humans. The issue thus becomes one of substitutability between hardware, software and labor, and the roles each should have in a new system.
Cost and Accuracy
In order for AVL systems to be effective, accurate vehicle locations are essential. Locations that are estimated inaccurately can lead to errors in control decisions or in the real-time information given to passengers. Accuracy requires more investment, however, and there is a direct relationship between the two. The challenge thus becomes one of determining the accuracy that is both achievable at reasonable expense and adequate for real-time needs.
Discrete Versus Ouasi-Continuous Updating
Depending upon the technology, it is possible to receive information about vehicles either on a quasi-continuous or discrete basis. Both types of systems gather information about vehicles, but discrete systems provide location information only periodically while quasi-continuous systems provide information more frequently. Continuous systems may provide more accurate and useful information, but may also be more costly.
This thesis examines a variety of computer and communication systems that are cur-rently being used or have potential use for transit applications. When the thesis investi-gates the types of computer and communications technologies available, most of the focus will be on AVL systems and their subsystems since these technologies address a substan-tial portion of to agency's information needs. The thesis also investigates the general issues in AVL design defined above.
Appropriate uses for these technologies will be examined to see how they can be applied to improve system performance, with a particular focus on the operations monitor-ing and control and passenger information functions. Several agencies that are currently using AVL systems and subsystems will be investigated to see how these systems are applied in practice.
1.3 Literature Review
This is not the first investigation of the potential of applying information technologies to transit functions. Several previous articles have provided either a listing of available technologies and their traits or presented a working evaluation framework.
Morlok[45, 46] focuses on the benefits and economic feasibility of Automatic Vehicle Monitoring and Control (AVM/C) systems. The Morlok study was organized in five parts. The first part of the study classified the elements of an AVM/C system as a basic real-time system, a basic transit management information system and optional elements. The basic real-time elements include an Automatic Vehicle Location (AVL) component, a communi-cations system permitting two-way communication between operators and dispatchers, a central computer, software to process incoming data, and an operator interface system. Dispatchers complement the system by analyzing AVL information and making control
decisions which are then relayed to the operators. The transit management information system normally consists of a computer to store and process data, links to compile data from multiple sources, and analysts to draw conclusions from the data. Optional elements such as passenger counters, vehicle maintenance systems and passenger information sys-tems enhance the system and provide additional benefits. Although the optional elements listed by the study are not comprehensive, they illustrate the types of options that are available.
In the second part of the study, Morlok identified several general benefits of AVM/C systems, categorizing these benefits as both real-time and those due to better management of transit information. Some of the real-time benefits noted by the study were improved system performance, increased passenger satisfaction leading to increased ridership, and improved safety along the route provided by continuous monitoring and emergency alarms. Some of the benefits resulting from analysing post-processed data were the ability to resize the fleet, to determine routes and frequencies which better match demand, and (perhaps) decreasing costs. Many benefits were listed, but only a few of them were sup-ported with solid evidence on the magnitude of their impacts. For instance, the study states that better control leads to increased rider satisfaction, leading to increased ridership, but little evidence was presented to show the extent of this impact.
In the next section, Morlok described the experiences with AVM/C system prototypes in three agencies; the SCRTD (Los Angeles), Cincinnati and the TTC (Toronto). For all three agencies, their AVM/C systems were described, the agency's experiences with these systems described, and each agency's own evaluation of system benefits and costs pre-sented. In all these case studies, the agencies believed that their AVM/C systems had proven to be beneficial. In general, it was found that if these AVM/C technologies were implemented system-wide, they would reduce operating costs and increase benefits.
Mor-lok stressed, however, that although many of these agencies have had successful applica-tions of these technologies, problems inevitably occur during the development phase. Morlok suggested that development and input that is principally at the local level tends to create a better system that exhibits fewer problems.
The study's evaluation of the benefits of these three agencies however, focussed prin-cipally on off-line use of the AVM/C data. Real-time benefits, although suggested in this study, were not investigated or evaluated in detail.
The next section of the study presented a framework that could be used to evaluate the cost-effectiveness of real-time AVM/C systems. A comprehensive evaluation using a multi-objective evaluation methodology considering both non-quantified and quantified impacts was proposed. The report suggested that design features of proposed systems should be catalogued and that all impacts, both quantitative and qualitative should be iden-tified. Morlok does not provide any detail on how these impacts should be measured, how-ever.
The study presents a framework for determining the costs of an AVM/C system using a a simple 3 element cost model to determine cost changes from the base system:
ATC = A (ARevenue-hours) + B (ARevenue-miles) + C (AFleet-size)
where AVM/C systems are assumed to reduce revenue hours, revenue-miles and fleet size. The cost of implementing an AVM/C system is given by:
Al = (Total-investment) (Cost-Recovery-Factor) + (AVM/COperations+Maintenance_Costs)
While this model is widely accepted, it is simplified and may not be precise enough to effectively calculate costs and benefits. Specifically, the total cost function only takes into account benefits derived from off-line analysis and does not take into account any
real-time benefits such as improved schedule adherence. The annual investment function clas-sifies costs as capital or operating costs, but does not go any further with this breakdown. For these types of systems, there may be different types of capital and operating costs and a categorization of these types may produce a more accurate cost model.
A second relevant publication is a "handbook" for evaluating AVL systems [19, 20]. The first part of this handbook provides a comprehensive definition of AVL systems and lists their potential uses. A generic evaluation process is proposed which will be applied to 4 cities that are implementing AVL system operational tests: Denver, Milwaukee, Dallas and Baltimore. All of these cities are using or are planning to use similar technologies (Global Positioning Systems or GPS) to determine locations and all have similarly sized systems (about 1000 buses). The advantage of comparing similar sized cities is that it becomes easier to differentiate benefits due to the technology, and benefits due to the method of implementation. These operational tests can only help determine how well GPS technologies will work, however and will not evaluate alternative location technologies.
The study proposed several criteria for evaluation including: * Financial impacts
* AVL Functional Characteristics * Utility/User Acceptance
* Overall Transit System Performance: efficiency * Overall Transit System Performance: effectiveness
The study then suggests measures appropriate for each criteria.
A third report [Davies 27] describes and qualitatively assesses a wide variety of advanced technologies for transit including AVL systems, passenger information systems and operations monitoring and control systems.
In assessing several passenger information technologies, Davies created a matrix in which each technology was assessed in terms of several benefit areas: time savings, fuel savings, environmental considerations, traffic safety, comfort and convenience, safety and security, efficiency and productivity, reliability and consistency and incentives. In one assessment example, automated telephone information systems were judged to produce time savings benefits by reducing waiting and booking times. The report conducted a sim-ilar exercise with fleet management and control systems including transit operations soft-ware and AVL systems. The assessment concluded that there are many potential benefits of information technologies to both the passenger information and operations monitoring and control functions. While this report provides a preliminary investigation of these tech-nologies, it does not provide a detailed assessment nor does it provide a framework for assessment.
Each of these reports leads to a greater understanding of the likely benefits of informa-tion technology for these two funcinforma-tions but none of them justifies or estimates the size of these benefits in a comprehensive manner. In addition, each report evaluates the benefits of these technologies to these functions without looking at the information needs of each function. When an agency selects a technology, it needs to be sure that the information provided by the technology will be effective in carrying out its function. Also, all of these reports start their assessment given a particular use for information technology, but none actually goes back and looks at the best uses for these technologies. All of these issues will be addressed in this thesis.
1.4 Organization of the Thesis
The next chapter explores the real-time functions central to this thesis in operations monitoring and control and passenger information. The chapter first discusses the impor-tance of these functions in improving performance by investigating the causes of service problems. The chapter then describes these functions, their information needs, and the
ways by which advanced computer and communications systems could satisfy these infor-mation needs.
Chapter Three examines computer and communication technologies, with a focus on AVL systems. The chapter describes the alternative AVL technologies with their advan-tages and disadvanadvan-tages.
Chapter Four examines the experiences of transit agencies that use AVL and related systems to help perform these functions. Three agencies (Toronto, Ottawa and London) are examined in detail and other agencies and systems will be referred to briefly to supple-ment these case studies.
Chapter Five synthesizes the knowledge gained in the previous chapters to present a framework for selecting technology application, presents and evaluates key issues that occur in general AVL system and design, and then assesses the potential benefits and costs arising from these real-time applications.
Chapter Six summarizes the results of the thesis and makes recommendations for fur-ther research.
Chapter 2
Potential for Application of Information Technologies
2.1 Introduction
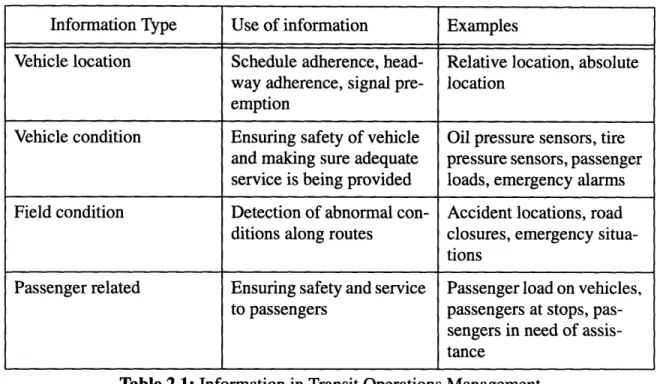
There are many types of information that can be useful in operations management. Pri-mary information needs can be summarized as vehicle locations, vehicle conditions, field conditions and passenger-related information. Vehicle location information is useful for determining how well vehicles are adhering to schedules and/or headways, and for
possi-bly giving priority to transit vehicles at traffic signals. Vehicle condition information is
useful for ensuring that vehicles are safe, operating correctly and are well utilized by pas-sengers. Field condition information is useful to detect any circumstances along routes such as congestion, accidents or road closures that may affect service. Passenger-related information is useful to detect vehicles that have heavy loads, overloading of passengers at stations, or passengers requiring assistance. Table 2.1 summarizes these information types. There are two possible uses for this information in real-time: relaying it to human (or automated) "decision-makers" who make real-time decisions on the operation of the sys-tem (the operations monitoring and control function), or relaying it to passengers who then use this information to help make their own travel decisions (the passenger information function). The use of this information is to help remediate problems that occur in service. This chapter focuses on the causes of unreliability that occur during service operations, the specific information needs of the two functions to help remediate these problems and the extent to which information technologies can help satisfy these information needs.
Information Type Use of information Examples
Vehicle location Schedule adherence, head- Relative location, absolute way adherence, signal pre- location
emption
Vehicle condition Ensuring safety of vehicle Oil pressure sensors, tire and making sure adequate pressure sensors, passenger service is being provided loads, emergency alarms Field condition Detection of abnormal con- Accident locations, road
ditions along routes closures, emergency situa-tions
Passenger related Ensuring safety and service Passenger load on vehicles, to passengers passengers at stops,
pas-sengers in need of assis-tance
Table 2.1: Information in Transit Operations Management
2.2 Causes of Unreliability
In an idealized environment, all trips that were supposed to be run would be run on schedule, 100% schedule adherence would occur, and there would be no accidents or dis-ruptions that would compromise the reliability of service. In reality, most operating envi-ronments are far from ideal. There are many events that can occur to disrupt service, and knowledge of these causes is an important first step towards dealing with the problem.
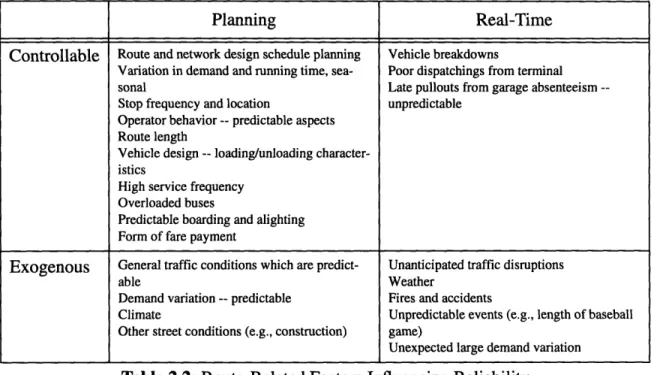
In August, 1982, a Transit Reliability Workshop[1] was held with experts from various disciplines discussing transit reliability. Although all aspects of reliability were discussed, the participants' comments on unreliability caused by route conditions are of most rele-vance here. The workshop came up with many route-related causes of unreliability and categorized them into four different types: planning and priority/controllable, real-time/ controllable, planning and priority/exogenous and real-time exogenous. One reason behind this classification was that more effective planning could be used to remedy causes which are systematic and predictable, while for unpredictable causes, real-time
interven-tion may be needed. Some of these causes can be controlled or mitigated by the transit agency while others are exogenous and largely beyond the agency's control. Table 2.2 summarizes some of the different causes of unreliability that were identified in the work-shop.
Planning Real-Time
Controllable Route and network design schedule planning Vehicle breakdowns
Variation in demand and running time, sea- Poor dispatchings from terminal
sonal Late pullouts from garage absenteeism
--Stop frequency and location unpredictable Operator behavior -- predictable aspects
Route length
Vehicle design -- loading/unloading character-istics
High service frequency Overloaded buses
Predictable boarding and alighting Form of fare payment
Exogenous General traffic conditions which are predict- Unanticipated traffic disruptions
able Weather
Demand variation -- predictable Fires and accidents
Climate Unpredictable events (e.g., length of baseball Other street conditions (e.g., construction) game)
Unexpected large demand variation
Table 2.2: Route-Related Factors Influencing Reliability
This table suggests that many of the causes of unreliability are systematic and can be accounted for and controlled with good planning. Chapter 1 has already shown how advanced technologies such as OC Transpo's APC system can gather the information needed for good planning to deal with some sources of unreliability. What is of primary interest here are the causes that require real-time detection and subsequent action.
What can be immediately observed from the list of real-time sources of unreliability is that many of the impacts can be mitigated if the time and location of the triggering event are known quickly. For instance, when a vehicle breaks down, if the time and location of the breakdown is known, repair crews or an extra vehicle can be sent out to remedy the problem. Also, if an operator drives constantly behind or ahead of schedule, the more
quickly this behavior is detected, the more quickly it can be remedied. Alternatively, infor-mation can be relayed directly to passengers who, when notified of the problem, might change their travel decisions to benefit them. Generally, the more quickly the incident is detected and responded to, the less the negative impact to both the service and passenger effect.
2.3 Operations Monitoring and Control
One function that responds to problems of unreliability is operations monitoring and control. The function's first requirement is to detect any situation possibly requiring inter-vention, which requires extensive information about the general conditions of the transit network. In the past, much of this information was gathered and relayed manually to deci-sion- makers, but information technologies have the potential to gather more information and then to relay this information faster.
When supervisors detect a particular disruption on the transit network, they need to select a control strategy, based on gathered information, that is likely to remedy the prob-lem quickly. Traditionally, this has been a completely manual process, relying heavily on the experience of the decision-makers. While this can be effective, the approach suffers from typical limitations of human systems such as slow detection times, slow response times, inadequate information for decision-making and inconsistent decisions. Informa-tion technologies have the potential to assist in the decision-making process both in the data gathering process and in suggesting control procedures or in the extreme, automati-cally enacting control procedures. Some of these control strategies are described next.
2.3.1 Control Strategies
The Transit Reliability Workshop proposed various approaches to improving reliabil-ity, many predicated on better planning, but some based on real-time intervention. In par-ticular, holding strategies (where individual vehicles are delayed at points along their route if they are ahead of schedule in order to maintain schedules) were viewed as having con-siderable potential to improve reliability. For this strategy to be most successful, however, information on vehicle locations is needed.
To deal with exogenous real-time events such as road emergencies or road closures, the participants felt that there needed to be good communications between the operators and the control supervisors. Many times this would mean a high quality radio network sys-tem that allows operators to notify supervisors on the occurrence of exogenous events so that supervisors can quickly assess the situation and make remedial changes.
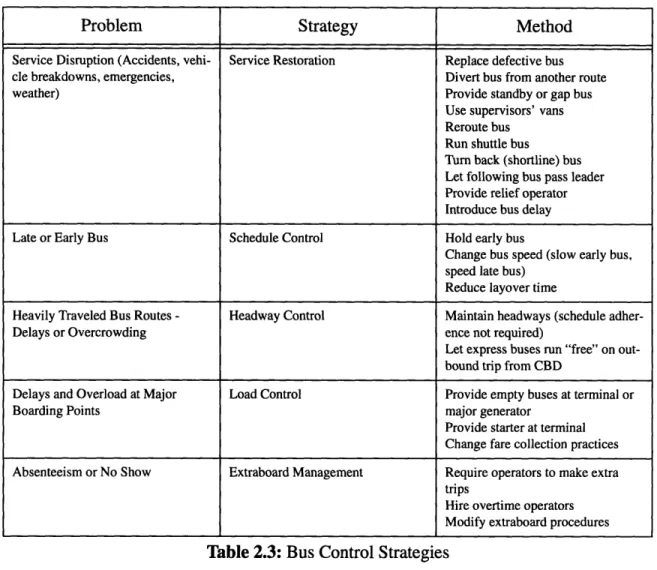
Levinson [40] also identified several strategies that could be used to restore operations to schedule (see Table 2.4) and the Chicago Transit Authority (CTA) has identified many current and potential strategies for improving bus operations reliability (see Table 2. ).
One of the more complete efforts that links the evaluation of control strategies with information needs and the uses of improved technologies is contained in a series of Mas-ter's theses conducted at the Massachusetts Institute of Technology. Fellows [32], Deckoff [29], Macchi [41] and Soeldner [61] all evaluated different control options for the Boston MBTA Green Line (a light rail line with multiple branches) and the potential for the newly installed Automatic Vehicle Identification (AVI) system had to improve performance. Fel-lows's [32] work provides the most useful information for this thesis and, for this reason, is the principal thesis to be cited.
Problem Strategy Method
Service Disruption (Accidents, vehi- Service Restoration Replace defective bus cle breakdowns, emergencies, Divert bus from another route
weather) Provide standby or gap bus
Use supervisors' vans Reroute bus
Run shuttle bus
Turn back (shortline) bus Let following bus pass leader Provide relief operator Introduce bus delay Late or Early Bus Schedule Control Hold early bus
Change bus speed (slow early bus, speed late bus)
Reduce layover time
Heavily Traveled Bus Routes - Headway Control Maintain headways (schedule
adher-Delays or Overcrowding ence not required)
Let express buses run "free" on out-bound trip from CBD
Delays and Overload at Major Load Control Provide empty buses at terminal or
Boarding Points major generator
Provide starter at terminal Change fare collection practices Absenteeism or No Show Extraboard Management Require operators to make extra
trips
Hire overtime operators Modify extraboard procedures
Table 2.3: Bus Control Strategies
Fellows, citing previous research, listed the different control options available or pro-posed for the Green Line and the information needs of each. A description of these control strategies and the information needs specific to the Green Line are summarized below:
Short Turning
In a short turn maneuver, a train is turned back in the opposite direction before it reaches its scheduled terminus in order to even out the effective spacing between them if bunching is occurring. In addition to evening out headways, short turning can also be used to move a train closer to schedule if it is presently behind schedule. This is done at the cost of forcing passengers destined to downstream points off the train to wait for the next one.
On fixed rail lines, short turning can only be conducted at points where the track structure allows this.
Service RestorationService Restoration Domain
Current Status at CTA Actions
Preempt traffic signals Single bus Not in use -no traffic signal preemption
capability
Limited stops with passengers Single bus Not current in use, but formerly an
oper-ating strategy on "boulevard" routes
Express down a different street Single bus Currently in use, using expressways and
Lake Shore Drive
Drop off passengers only Single bus Current used rarely, if at all
Express to a later point in trip Single bus Not currently in use
Turn before terminal Single bus Currently in use
Pick up run beyond start point Single bus Currently in use for late garage pull-outs Operator continues past relief point Single bus Currently in use when one operator fails
to relieve another
Hold back leader Single bus Currently in use
Relief operator relieves other than sched- Single route Currently in use uled operator
Operator exchange Single route Currently in use
Follower picks up passengers Single route Currently in use whenever a service
problem results in passengers being dis-commoded
Spread the terminal Single route Currently in use
Spread the interval Single route Currently in use
Pass another bus Single route Currently in use
Reschedule the street Single route Currently in use, primarily for inclement
weather conditions
Emergency reroute Single route Currently in use, for fires, emergency
road repairs, etc.
Fill with pull-in Single route Currently in use
Pull-out instead of relieve Single route Currently in use, where the relief to be
made by the operator will not be there due to a service problem
Jump buses Single route Currently in use in case of a defective
bus at a terminal
Bus change brought out by Maintenance Single route Currently in use in case of a defective bus on the street
Table 2.4: Service Restoration Actionsa
Analyzing a week's worth of records at one Green Line station, Deckoff [29] proposed a set of decision rules that can be used by inspectors to determine which vehicles to short turn. He identified the minimum information needs for the short turn procedure to be the preceding two headways on each branch line. Other information such as real-time passen-ger accumulation rates and scheduled destinations, following headways, train lengths and running times between locations would also help inspectors make the short turn decision.
Expressing and Running Light
When a train is expressed, it makes no passenger stops for a certain portion of a trip. The running light strategy is similar to the express strategy except that no passengers are on board the train while it is expressed. In both cases, trains are speeded up in order to even out headways if bunching is occurring upstream of the expressed train and/or to bring them back to schedule if they are behind. This comes at the cost of a set of passen-gers being forced off the train to wait for the next one, thus the best points to express trains are usually at points where both the passenger load is light and there would be benefits to many downstream passengers. Macchi [41] developed mathematical models to help deter-mine when these strategies would be effective. He then proposed decision rules that required information needs of preceding and following branch headways, estimated time savings due to expressing, passenger loading.
Holding Trains
Sometimes it is necessary to "hold" a train at its current location for a time because it is ahead of schedule or the preceding headway is very short. This is the least disruptive control action since it does not require any passengers to be forced off the train. Fellows identified the most important information needs for this strategy to be preceding and fol-lowing branch-line headways (to determine whether holding would generate more even headways) and following any-line headways (to determine the maximum holding time
without blocking a following train). Since holding could be done at many more points along the line than the other strategies (theoretically limited only to the number of inspec-tors collecting headway information), Fellows identified this strategy as the one that would benefit a great deal from system-wide headway and schedule information.
Adding Trains
On the Green Line, a small number of trains called "Run as Directed" (RAD) trains are kept on side tracks and used to fill in service gaps caused by incidents. This benefits pas-sengers who arrive in the service gap who would otherwise have had to wait a long time for service. In order to know when to add a train into service, Fellows suggested that sys-tem-wide location information for all trains, the locations of RAD trains and the nature and location of the incident are needed.
Managing Service Disruptions
Many of the above control strategies only deal with minor incidents. Sometimes inci-dents of a more disruptive nature occur, such as a vehicle breaking down in the middle of its run, and the staff are required to detect and respond to these major service disruptions as quickly as possible. Fellows argued that a "whole-system" view, implying centralized monitoring and control would be able to detect and respond to major service disruptions faster than a system where decentralized control is in place. Fellows also suggested that the ability for control staff to focus in on specific areas of the system would improve the monitoring and control of service disruptions.
Fellows then investigated the control environment that is currently in place on the Green Line. Currently, monitoring and control is being conducted in a highly decentral-ized manner with inspectors, dispatchers and stationmasters all having some limited con-trol responsibilities. Decisions on different concon-trol strategies are made by different individuals, often at different locations. For example, decisions on short turning vehicles
are made by an inspector at one station, while decisions on expressing vehicles are made by an inspector located one station inbound. The decision is often made given only infor-mation local to the decision-maker.
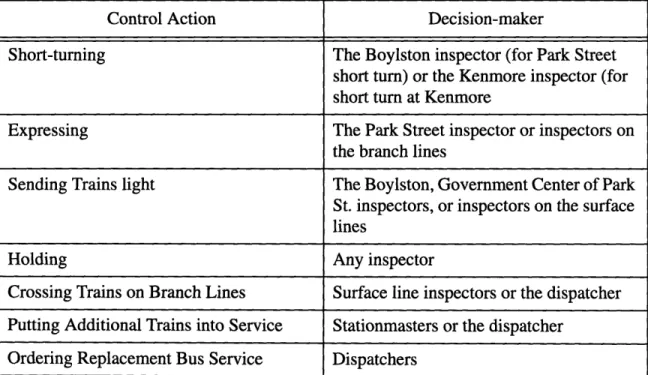
Sometimes, decision-makers have information about other parts of the Green Line through limited communications with operators and other inspectors but they do not always consult with other inspectors or operators before making their decisions. The dis-patcher at central control can also make control decisions based upon limited information provided via telephone, radio and electronically, but the dispatcher lacks the local infor-mation available to inspectors and operators. Generally, it is the inspector, not the dis-patcher who makes most control decisions as illustrated in Table 2.7.
With this control structure, some, but not all of the information needs for these strate-gies are being met. For the short turning, expressing and holding control options, inspec-tors have knowledge of preceding headways, but lack knowledge on following headways
Control Action Decision-maker
Short-turning The Boylston inspector (for Park Street short turn) or the Kenmore inspector (for short turn at Kenmore
Expressing The Park Street inspector or inspectors on
the branch lines
Sending Trains light The Boylston, Government Center of Park St. inspectors, or inspectors on the surface lines
Holding Any inspector
Crossing Trains on Branch Lines Surface line inspectors or the dispatcher Putting Additional Trains into Service Stationmasters or the dispatcher
Ordering Replacement Bus Service Dispatchers
and passenger accumulation rates. For the strategies that respond to major situations (e.g. adding trains and managing service disruptions), some level of centralization does aid the decision-maker, but the system is limited and slow, sometimes resulting in bad decisions. Advanced computer and communications systems like the Green Line AVI have the abil-ity to provide the information needed to make these strategies successful.
For the short turn strategy, Deckoff estimated that additional information such as fol-lowing headways would cause the strategy to be utilized more and with better success, resulting in more passenger-minutes saved. For the express strategy, Macchi suggested that additional information about neighboring headways and predicted time savings could greatly improve the success of this strategy. Macchi also noted that if passengers were notified of these controls sooner, their annoyance would be minimized [73]. As will be shown in Chapter 4, these types of systems have the potential to provide this type of infor-mation on a more system-wide level.
For all of the strategies listed in this section, location information is seen as crucial to support the control decision. It seems that other types of information that would be useful would be passenger-related and incident-related. The uses and value of these information types for various operations functions are described next.
2.3.2 Information Needs and Uses
When a decision-maker needs to make a decision involving intervention in operations, he or she would like to have as much relevant information as possible. In a perfect world, the decision-maker would be able to obtain all relevant information, but information can be expensive, and some information is more important than others. When an agency is deciding which types of information is most important, several issues arise. They must decide upon the type and amount of information, the level of precision, and the means by
which information is to be collected. All of these decisions will govern the cost of infor-mation collection. There is also the critical issue of what to do with the inforinfor-mation once it is collected.
Some types of information are more useful than others. For instance, knowledge of schedule adherence may be useful for determining whether a particular type of service control is needed, but real-time information about the operational status of a vehicle (e.g. engine status, tire pressure, oil pressure) may not be as useful for routine decision- making because of the low frequency of mechanical problems during operations.
The level of precision of information is another important issue. Some information types like location, schedule adherence and headway adherence would require a greater level of precision than other information types such as passenger loads. In each case, the level of precision should be based on the cost of a given level of precision versus the risks and impacts of bad decisions. A more detailed discussion of precision issues is presented in Chapter 5.
The means of information collection may be just as important as the information being collected. Information technologies have given agencies the opportunity to gather certain types of information automatically and in the future, these technologies may also provide the option of making decisions automatically. Each agency must decide upon the approach to take in order to minimize costs and maximize effectiveness.
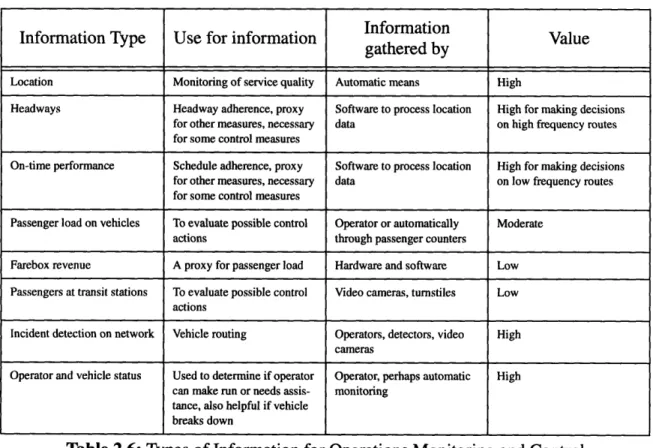
Table 2.6 summarizes the types of information that can be useful for operations moni-toring and control, the uses of the information, the means by which this information can be gathered and the how valuable the information is in helping make good decisions. In this table, it is assumed that all information types are gathered on a system-wide level rather than local level and that the information is gathered to an acceptable level of precision.
Of all of these information types, real-time location information is by far the most
important, since without it, neither monitoring nor control is possible. Thus, any opera-tions monitoring and control system must have at its heart the ability to gather location information; all the other information types might be viewed as add-ons. The secondary information types are always used in conjunction with location information (e.g. passen-ger loads at a location, or on-time performance at a location, etc.).
Table 2.6: Types of Information for Operations Monitoring and Control
2.4 Passenger Information
Another function that responds to problems of unreliability is passenger information. Unlike private transportation services, in which the user has control over trip start times, transit passengers have no control over service in the short term. They must wait for
vehi-Information
Information Type Use for information Information Value gathered by
Location Monitoring of service quality Automatic means High
Headways Headway adherence, proxy Software to process location High for making decisions
for other measures, necessary data on high frequency routes
for some control measures
On-time performance Schedule adherence, proxy Software to process location High for making decisions
for other measures, necessary data on low frequency routes
for some control measures
Passenger load on vehicles To evaluate possible control Operator or automatically Moderate
actions through passenger counters
Farebox revenue A proxy for passenger load Hardware and software Low Passengers at transit stations To evaluate possible control Video cameras, turnstiles Low
actions
Incident detection on network Vehicle routing Operators, detectors, video High cameras
Operator and vehicle status Used to determine if operator Operator, perhaps automatic High can make run or needs assis- monitoring
tance, also helpful if vehicle breaks down