Publisher’s version / Version de l'éditeur:
Vous avez des questions? Nous pouvons vous aider. Pour communiquer directement avec un auteur, consultez la première page de la revue dans laquelle son article a été publié afin de trouver ses coordonnées. Si vous n’arrivez pas à les repérer, communiquez avec nous à [email protected].
Questions? Contact the NRC Publications Archive team at
[email protected]. If you wish to email the authors directly, please see the first page of the publication for their contact information.
https://publications-cnrc.canada.ca/fra/droits
L’accès à ce site Web et l’utilisation de son contenu sont assujettis aux conditions présentées dans le site LISEZ CES CONDITIONS ATTENTIVEMENT AVANT D’UTILISER CE SITE WEB.
Proceedings of The 21rst British Computer Society (BCS) HCI Annual
Conference, 2007
READ THESE TERMS AND CONDITIONS CAREFULLY BEFORE USING THIS WEBSITE. https://nrc-publications.canada.ca/eng/copyright
NRC Publications Archive Record / Notice des Archives des publications du CNRC :
https://nrc-publications.canada.ca/eng/view/object/?id=6deb17a9-e15e-4836-b19b-871978af4ef8
https://publications-cnrc.canada.ca/fra/voir/objet/?id=6deb17a9-e15e-4836-b19b-871978af4ef8
Archives des publications du CNRC
This publication could be one of several versions: author’s original, accepted manuscript or the publisher’s version. / La version de cette publication peut être l’une des suivantes : la version prépublication de l’auteur, la version acceptée du manuscrit ou la version de l’éditeur.
Access and use of this website and the material on it are subject to the Terms and Conditions set forth at
A technique for incorporating dynamic paths in lab-based mobile
evaluations
A Technique for Incorporating Dynamic
Paths in Lab-Based Mobile Evaluations *
Crease, M., Lumsden, J., and Longworth, B.
2007
* Proceedings of BCS British HCI. September 3, 2007. NRC 49366.
Copyright 2007 by
National Research Council of Canada
Permission is granted to quote short excerpts and to reproduce figures and tables from this report, provided that the source of such material is fully acknowledged.
A Technique for Incorporating Dynamic Paths in
Lab-Based Mobile Evaluations
Murray Crease
National Research Council –
Institute for Information Technology
46 Dineen Drive
Fredericton, NB, Canada E3B 9W4
+1 506 444 0496
[email protected]
Jo Lumsden
National Research Council –
Institute for Information Technology
46 Dineen Drive
Fredericton, NB, Canada E3B 9W4
+1 506 444 0382
[email protected]
Bob Longworth
Faculty of Computer Science,
University of New Brunswick
540 Windsor Street
Fredericton, NB, Canada E3B 5A3
[email protected]
ABSTRACT
Increasingly, lab evaluations of mobile applications are incorporating mobility. The inclusion of mobility alone, however, is insufficient to generate a realistic evaluation context since real-life users will typically be required to monitor their environment while moving through it. While field evaluations represent a more realistic evaluation context, such evaluations pose difficulties including data capture and environmental control which mean that a lab-based evaluation is often a more practical choice.
This paper describes a novel evaluation technique that mimics a realistic mobile usage context in a lab setting. The technique requires that participants monitor their environment and change the route they are walking to avoid dynamically changing hazards (much as real-life users would be required to do). Two studies that employed this technique are described, and the results (which indicate the technique is useful) are discussed.
Categories and Subject Descriptors
H.5.2 [Information Interfaces And Presentation]: User Interfaces - evaluation/methodology; Input devices and strategies.
General Terms
Performance, Experimentation, Human Factors.
Keywords
Mobile technology, lab-based evaluation technique.
1. INTRODUCTION
For mobile applications, the benefits of lab evaluations over field evaluations are subject to much debate. While lab evaluations make data collection and controlling the environment easier, field evaluations increase the likelihood of a realistic evaluation context (although this may not always be the case [8]). This paper introduces a technique designed to enable lab evaluations to incorporate an environment that mimics a common usage scenario of mobile applications. In the real world, users of mobile applications are
simultaneously required to monitor and navigate through their environment while avoiding potential hazards. In contrast, most lab evaluations that utilise participant mobility do not require the participants to monitor their environment or to navigate a
truly dynamic path. This reduces the effect of mobility to the impact of the motion (e.g., a slight jerking at each step), while
ignoring other factors such as the demands on the cognitive and visual resources of the participants.
In this paper we describe a technique we have developed that allows us to simulate a common usage scenario – namely, walking in a dynamically changing environment such as a street – within the lab. We describe how this technique – which demands that experimental participants monitor their environment and accordingly adjust the path they are navigating – was developed, and how it can be applied. We also describe two studies that employed this technique and discuss its impact on the results.
The following section of this paper briefly outlines pertinent research in the field of mobile evaluation design. We then introduce our new evaluation technique before discussing some preliminary results of its use. The paper concludes with a discussion and recommendations for future work.
2. RELATED WORK
There have been many attempts at introducing mobility as part of a realistic evaluation context. Pirhonen et al compared two different techniques when evaluating gestural input for a mobile device [17]. The first of these techniques required participants to navigate a slalom style path in a public corridor while interacting with the device. Instructions regarding the experimental tasks were displayed on a flip chart. The participants performed one task per lap, and were exposed to the occasional random interruption from passers-by. An alternative evaluation was undertaken where participants were required to “walk” on a stationary step machine while interacting with the device. Since the participants were stationary it was possible to record their interactions with the device, which enabled a more objective analysis of their interaction than was possible in the first evaluation. Lumsden and Gammell used a similar approach to the first method described above when investigating eyes-free text entry on a mobile device [12]. In this case, however, two projectors (one at either end of the lab) were used to display input instructions and feedback to participants regarding their interaction with the device.
Kjeldskov and Stage [8] compared the effect of five lab-based techniques – sitting at a table, walking on a treadmill at a constant speed, walking on a treadmill at a variable speed, walking at a constant speed on a course that is constantly changing, and walking at a variable speed on a course that is
PLEASE LEAVE THIS BOX BLANK – IT WILL
BE USED FOR COPYRIGHT INFORMATION.
constantly changing – with the effect of walking on a pedestrian street on user interaction with mobile technologies. The five lab-based techniques were designed to cover the five possible combinations of motion (none, constant, and variable) and attention required for navigation (yes or no).
The different techniques were compared in terms of the number of usability problems found, as well as the task performance and subjective workload experienced by participants. Participants were best able to find usability problems when sitting at a table. Kjeldskov and Stage suggest that this was because, when sitting at a table, participants were able to devote the most attention to the means by which problems were reported – that is, thinking aloud. They found that mobility had no significant impact on participants’ task performance; it did, however, have an impact on the workload experienced by the participants. Specifically, they found that walking on a treadmill at a constant speed did not significantly increase the workload experienced by participants; it was only when an additional cognitive load (via variable walking speed, variable course, a combination of the two, or being in a real-world situation such as a street) was introduced that an increase in workload was reported. They had anticipated, for the variable course, witnessing a significant increase in reported mental demand as a result of the extra cognitive demand associated with following a varying path. They did not, however, find this to be the case. They hypothesised that this was due to the way the variable course was implemented: participants were required to follow an experimenter who followed a variable path. This enabled participants to merely follow the experimenter without expending any real effort on navigation: the evaluation design – which was intended to simulate the need for attention when navigating – did not, therefore, meet its goal.
Duh et al also undertook a comparison of field and lab-based evaluations [3]. Two groups of participants undertook an evaluation of a mobile phone-based application in one of two settings: seated in a lab with the usage scenario textually described; or in the field in the actual usage scenario. In both cases, the think aloud technique was used and participants’ interaction with the application was recorded. In contrast to Kjeldskov et al, significantly more critical errors were found by the participants in the field than by those in the lab. Although no definitive reason is given, the lab-based participants were seated during the evaluation so no attempt was made to mimic the real-life context of use. Similarly, Brewster [1] found that the amount of data entered using button presses was significantly less for mobile, outdoor users compared to seated, indoor users but no comparison was made with mobile, indoor users.
Duh et al, however, observed that because the study took place in a public location, some participants expressed a nervousness and discomfort about thinking aloud. While this did not seem to detrimentally affect the results here, this may not always be the case. Goodman et al [4] report that a further problem with field studies is the difficulty in controlling confounding variables. While this problem may be minimised by removing data where it varies too greatly from appropriate control levels, this can be both an expensive and time consuming task.
Kjeldskov et al [7] went as far as to suggest that the added effort required to undertake a mobile usability evaluation in the field is not justified in terms of the results such an evaluation produces. They investigated the effectiveness of two evaluations of a mobile Electronic Patient Record (EPR) system: one undertaken in a lab-based simulation of a hospital
ward and the other in a real hospital ward. Surprisingly, significantly more problems (both serious and cosmetic) were discovered as a result of the lab-based evaluation than the field-based evaluation. They found that running the experiment in the field posed considerable challenges with respect to the collection of data: participants in the lab, for example, were prepared to use a note taking facility to document identified problems, whereas nurses operating in a real life context (perhaps unsurprisingly) did not. The particular context of this study – a hospital ward where patient safety is the most critical factor – may have negatively impacted the extent of findings returned by the field-based evaluation. Furthermore, the nature of the results – which were focussed on the number of problems found with the application – mean that they cannot easily be generalised. That said, the results suggest that if the real-world context is taken into account in the design of a lab-based protocol, a lab evaluation may be at least as good as a field evaluation. Kondratova et al. [9] describe a lab study that mimiced key environmental considerations during an evaluation of a mobile application for construction workers. Their experimental design introduced mobility, visual distractions, and noise to reflect a specific real-world use context in the lab. They were able to observe the effect of mobile interaction on participants’ ability to be cognizant of their surroundings – an important ability in many mobile scenarios.
3. MIMICING A REAL-WORLD
CONTEXT IN THE LAB
In this section we describe the evolution of the technique we have developed to support the inclusion of realistic mobile-contexts in a lab environment.
We felt that there were two main requirements that our new technique would have to place on experimental participants for it to adequately mimic a real-life context:
1. Participants would need to monitor their environment just as they would in a real-world context. This monitoring could manifest as hazard avoidance or navigation tasks.
2. Participants would need to follow a dynamically changing route. This, again, mimics a real-world scenario where users are required to navigate around hazards.
Ethically, we were faced with a third requirement: the hazards used could not pose more than minimal risk (in ethical terms) to experimental participants. We were also faced with the practical requirements that the experimental cost remains reasonable, and that any generated context had to be easily and consistently repeatable. A final consideration was that the technique must be easy to set up and reuse by different people.
3.1 The Basic Idea
The basic idea behind our technique is to utilise markings on the floor as a basis for dynamically changing paths that participants must follow. The dynamic paths are created by specifying different floor markings as hazards at different points along a timeline – the intention being, that participants are not to step on the hazardous markings while walking between two points in the lab space. By constantly changing which of the markings are hazards, we create a dynamic path between two physical points in the lab that cannot simply be memorized; this fulfils the second requirement above. The
information regarding which – if any – of the floor markings are specified hazards at any point in time is projected onto the walls facing the participants. This forces the participants to monitor these walls while walking; fulfilling the first requirement. We did consider making participants stand on, rather than avoid, specified markings but ultimately felt this would encourage participants to walk in an unnatural way as in a real-world context users will typically navigate to avoid hazards as opposed to navigating to step on safe (e.g. dry) areas.
3.2 Initial Design
Once we had established the principle of the technique, we were able to work on a concrete implementation for our lab which is, in essence, a large, empty room (approximately 17.3m x 8.65m) with plain white walls. We also have 6 ceiling mounted projectors that can be moved to project onto any (part) of the wall surfaces. Although the format of our lab guided our design, we have attempted to make the technique as generic as possible.
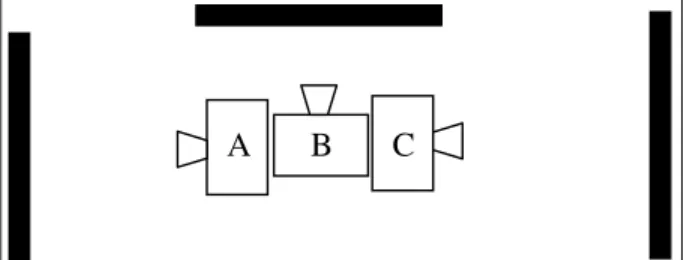
A B C
Figure 1 – The physical layout at each end of the lab. Three ceiling mounted projectors (A, B, & C) project onto the
walls in the locations indicated by the black bars. This layout is mirrored at either end of the lab with only the projectors at the end the participant is currently walking
towards active.
The design has two main components: the floor layout/markings and the hazard instructions. We decided to use colourful, interlocking foam mats (typically found in a children’s playroom) for the floor markings because: (a) they present no danger to participants; (b) they are easy to store and
to set up in many different layouts; and (c) they are relatively low cost. Each of our mats is 2’ x 2’ and is one of 4 colours (red, green, yellow, and blue). We laid out the mats in a regularly repeating pattern in which no two mats of the same colour were ever directly adjacent. The layout covered an area of 40’ x 8’ with the participants required to walk repeated lengths of the layout: potential hazards were any one of the different colours of the mats.
Instructions regarding the hazards were projected onto the walls facing the participants. As the design called for participants to walk lengths of the lab, 3 projectors were used at either end of the lab to provide this information – see Figure 1. Each projection consisted of a single solid block of one of the 4 floor mat colours, with the three active projections all displaying different colours. At any point in time, at most one of the projected blocks of colour contained the word “Avoid” (in black text), and the participants were required to avoid stepping onto that colour on the floor as they moved through the lab. Unlike Kjeldskov and Stage’s design [8], this set-up created a dynamically changing path that truly demanded participants’ cognitive attention.
The third component to our design was capturing participants’ paths through the lab, with respect to the dynamically changing hazards. We developed a simple application that runs on a PocketPC PDA to allow an evaluator to record, in real time, the colour of each of the mats participants step on as they walk. When a participant reaches the end of a lap of the lab (indicated by the participant stepping off the end of the grid) the evaluator presses a button on the PDA application interface, which both times the individual lap, and indicates to the system that the participant will now be walking in the opposite direction. The ideal solution would have been to utilise pressure pads to definitively record where the participants were standing, but the cost of this was prohibitive. An alternative solution would have been to use the indoor positioning facility we have available in our lab but, while this would give an indication of the participants’ location within the lab space, it would not accurately indicate what colour of mat the participants were standing on.
Potential hazard projections. In this case, the central projection (red) is a hazard (“Avoid” is projected) while
the left (blue) and right (green) projections are not.
Close up of the projection showing “Avoid” in black text on a red background. In this instance, red mats are treated as “hazards”.
Figure 2 – Final design of the lab layout showing the foam mat floor surface to be walked across by the participants and the coloured projections indicating the current hazard.
3.3 Final Design
We conducted some initial pilot tests with this set-up which highlighted several flaws: (1) the mats were too small to allow the evaluator to judge the colour stepped on (too frequently, participants’ feet would be straddling more than one colour of mat); (2) there was an element of ambiguity caused when the word “Avoid” was suddenly projected on the colour matching the mat a participant was in the process of stepping on; and (3) the step recording process was error-prone due to the high cognitive load of recording every step into all four colours. It was straightforward to create larger mats by combining them into 4’ x 4’ squares. It was also straightforward to give the participants an indication of an impending hazard by projecting the word “Avoid” in white for 2 seconds before changing the text colour to black to indicate the hazard was now in place. Figure 2 shows the final layout of the lab with a 2 x 10 grid of 4’ x 4’ coloured squares giving an overall layout of 8’ x 40’. The three walls facing the participant show three colours, with red the currently specified hazard.
The hardest problem to solve was accurately recording the participants’ steps. Even with the larger (4’ x 4’) areas it was still an error-prone process to record the steps accurately due to the number of steps to be recorded and the need for the evaluator to correctly select the appropriate button from a choice of four on the PDA interface. After several iterations, we decided to limit hazards to only one of two colours at any one time. An evaluator is therefore only required to record steps into those two colours as opposed to recording every step. (i.e., rather than record every step, the evaluator is only required to record steps that correspond to the two potential hazard colours).
The layout of mats was carefully considered, in combination with the pairings of projected hazard colours, to maximise the ease of recording steps. The mats are arranged in rows of colour that alternate between blue/yellow and red/green, with the order of the colours on each row alternating (see Figure 2). The pairings of colours used as potential hazards match the colours used on the rows of mats (i.e., blue/yellow or red/green); this means that when recording steps, the evaluator is only required to monitor every second row of mats (as opposed to every row of mats), greatly reducing the cognitive load on the evaluator and therefore increasing accuracy.
To ensure that the participants do not recognise that only two colours could be potential hazards, the pair of colours used can change when a participant reaches the end of a lap. Equally, the potential hazard colours may not change at every change of direction – again to reduce the likelihood of participants recognising a pattern. These changes in hazard colours – as with the changes in the projections – are driven by pre-defined sequence files which can be replayed for multiple participants ensuring consistent, repeatable experimental conditions. Although these changes to the hazard colours mean the evaluator’s interface also changes dynamically, the confusion caused by this change is minimal because the change is triggered by the evaluator pressing the button to indicate the end of a lap. Furthermore, the benefits to the evaluator, in terms of the size and number of buttons, outweigh the potential disadvantages.
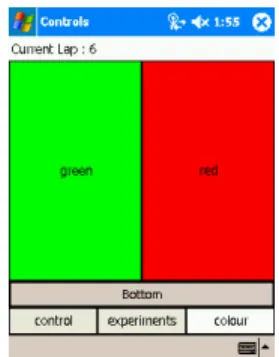
The resulting evaluator’s application interface is shown in Figure 3. It is dominated by two large coloured buttons – the appropriate button being pressed when a participant steps on
that colour. The button across the bottom of the interface (labelled “Bottom” in Figure 3) allows the evaluator to indicate that a participant has reached the end of the path, and will be turning around. When this occurs, the projectors used to indicate hazards switch to those at the opposite end of the room (ensuring that projections are always facing the participant). The evaluator application generates events that are sent to the server that generates the projected images, enabling the steps to be correlated with the projections. In this way, it is possible to calculate the number of times a “hazard” is stepped on and the time taken to complete individual laps.
Figure 3 - The evaluator interface used to record steps (hazard colours have been set to green and red in this case).
3.4 Discussion
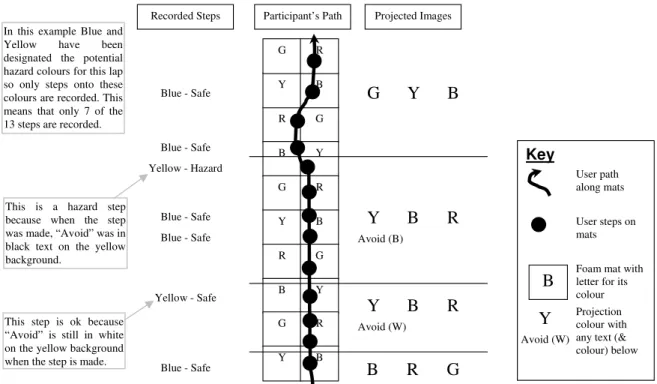
Figure 4 diagrammatically represents an example lap. For this lap, blue and yellow have been designated the potential hazard colours; the buttons on the evaluation interface would reflect this, and only steps onto these colours would be recorded. When the participant starts the lap, the projectors are showing blue, red, and green with no text. Just before the participant’s second step the projections change to yellow, blue, and red respectively with the text “Avoid” displayed in white on the yellow block. The participant’s fourth step is onto a yellow mat so the evaluator records this by tapping the yellow button on his interface. This is recorded as a safe step because the text is still in white. The participant’s 9th step, however, is calculated to be a hazard step because the text is now in black on the yellow background.
This example demonstrates how the design fulfils the two main requirements specified earlier: the participants are required to monitor their environment – to monitor the projections; and the participants follow a dynamic path – to avoid changing “hazard” colours. It also demonstrates how the design has attempted to minimise the load on the evaluator when recording the participants’ steps. Given the infeasibility – due to the expense – of recording steps automatically, we have instead concentrated on making the data recording as easy as possible, with only two choices to record at any given time. In this example, for instance, only 7 of the 13 steps are recorded. Furthermore, only on two occasions are two consecutive steps recorded. If desired, the participants’ movement could be video recorded to enable the initial data capture to be verified. This still leaves the occasional ambiguity when a participant steps on the join between two colours on the same row. Our approach in this situation is to record the participant’s intention. If, for example, the participant is clearly intending to step on a red mat but accidentally steps on the join between the red and green mats then red would be recorded for that step. It should
also be noted that while we found it straightforward to record a participant’s steps using the evaluator interface, it was not possible to also monitor the projections. While not intentional,
this ensures that an evaluator does not subconsciously favour “hazard” colours (or vice-versa) while entering the data.
R G B Y G R Y B R G B Y G R Y B Y B G R
Participant’s Path Projected Images Recorded Steps
B R G
Y B R
Avoid (W)Y B R
Avoid (B)G Y B
Blue - Safe Yellow - Safe Blue - Safe Blue - Safe Yellow - Hazard Blue - Safe Blue - SafeKey
User path along mats User steps on matsFoam mat with letter for its colour Projection colour with any text (& colour) below
B
Y
Avoid (W)
Figure 4 – An example of a participant’s route across the mats (moving up the page). The letters on the right of the figure indicate what colours were being projected when the participant was at any give point of the path (Red, Yellow, Green or Blue). Any text that was being projected is shown under the colour on top of which it was displayed. The text colour is indicated in brackets - black (B) or white (W). The black circles indicate where the participant stepped, while the text on the
left indicates what was recorded. The evaluator recorded the colour stepped on, while the system automatically calculated whether it was a safe or hazard step.
3.5 Practical Considerations
When designing the technique two practical requirements were considered: the cost should be reasonable and the setup/management time should be low. The cost of the set-up is largely dependent on the cost of projectors. In our lab we have 6 dedicated, ceiling-mounted projectors but there is no reason why fewer projectors (perhaps as few as two) could not used in a more temporary set up. The other major component of the cost is the foam mats used to form the physical layout. These mats are widely available and are not expensive although this cost does mount when considering the number of mats required. Cheaper alternatives could be used such as printed paper markings taped to the floor although these would not prove as durable or as re-usable.
A second cost that might be considered is the effort required to manage the projectors. To minimise this cost an experimental server was developed. This server encapsulates the projectors (as well as other resources available in our lab) and allows researchers to easily incorporate code specific to their evaluations. The server provides both a UI and an API that allows individual projectors to be managed. Figure 5 shows how the projectors are presented by the server. The three projectors at the right-hand end of the lab are currently active with the central projector projecting “Avoid” on a red background.
It is straightforward to implement a component that can both send messages to and monitor the status of the projectors. An
example of such a component is the evaluator interface (Figure 3) that monitored the status of the projectors. A second component was built that updated the projector displays according to sequence files generated for the experiment. This component could track the participants’ direction (using information provided by the evaluator interface) meaning that the correct projectors were used at all times. The use of sequences ensured that the experimental context was consistent for all participants.
Figure 5 –Screen shot of the experimental server. Here, the six projectors available in the lab can be seen. Projector 5 –
In this example Blue and Yellow have been designated the potential hazard colours for this lap so only steps onto these colours are recorded. This means that only 7 of the 13 steps are recorded.
This step is ok because “Avoid” is still in white on the yellow background when the step is made. This is a hazard step because when the step was made, “Avoid” was in black text on the yellow background.
at the end of the lab – is projecting “Avoid” on a red background while Projectors 4 and 6 – on either side of 5 –
are projecting blue and green respectively.
4. EVALUATION
Two studies have been run using the technique described in this paper. The first evaluated participants’ ability to enter text using different input techniques under different mobility conditions. The second evaluated the effectiveness of different microphones for speech input under different noise conditions for mobile users. The following sections briefly describe these studies and the impact of the technique on the results.
4.1 Study 1 – Text Entry
With over a trillion text messages sent worldwide in 2005 [5], text messaging is an ever increasing phenomenon; as such, it is important to evaluate the effectiveness of text entry techniques. There is a growing desire (and in some cases pressure) for users of mobile devices to remain in constant communication, both professionally and socially. Some companies, for example, require their staff to always carry their Blackberry – even at weekends and on vacation – and to always reply to their boss’ messages within 15 minutes [19]. In the context of leisure, text messages are widely used for personal communication regarding, for example, social or sporting events [15]. This rapidly evolving social norm implies that it is not reasonable to assume that users of mobile communication devices will be stationary when entering text. Instead, they may be mobile and consequently required to navigate through dynamically changing environments, avoid hazards, cope with distractions, and handle changing visual and audio conditions while entering text.
4.1.1
Experimental Design and Procedure
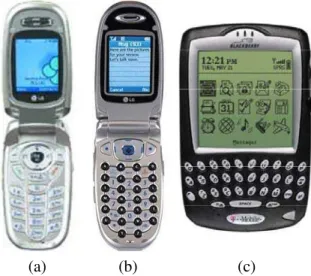
Three different text-entry devices were evaluated: an LG 200 mobile phone with T9 predictive text entry (Figure 6(a)) [10]; an LG 6190 mobile phone with Fastap keypad (Figure 6(b)) [11]; and a Research In Motion (RIM) Blackberry 6710 with QWERTY keyboard (Figure 6(c))1. The LG 200 mobile phone was selected because of its similarity to the LG 6190 mobile phone in terms of weight, size, and functionality.
(a)
(b)
(c)
Figure 6 - The devices used for text entry. (a) – the LG200 mobile phone with standard keypad; (b) – the LG 6190
1
http://www.blackberry.com/
mobile phone with Fastap keypad; and (c) a Blackberry 6710 with small QWERTY keypad.
The evaluation required the participants to perform a text-entry task under three different conditions of use: seated – representing a common use-case scenario whereby a user is seated while entering text; mobile (hereafter referred to as the
walking condition) – replicating a typical evaluation scenario
whereby a user is required to walk a well defined path while using a mobile device; and mobile while avoiding hazards (hereafter, the hazard condition) – designed to mimic the real-life usage scenario where a user is entering text while avoiding hazards (perhaps, for example, navigating a pedestrian street). In all three experimental conditions participants were required to complete the same task: to enter 6 phrases using the mobile device they were given. The phrases were selected from MacKenzie & Soukoreff’s [14] set of phrases for evaluating text entry techniques. The specific sets of phrases we used were carefully balanced to ensure that they all had an equal number of characters (156) and had an approximately similar correlation with English (between 80.33%-83.95% in all cases). The correlation with English is based on the ratio of letters used in the phrases compared to their expected ratio in written English, and was calculated using the algorithm described by MacKenzie and Soukoreff [14]. The value for the correlation was relatively low due to the small number of characters in each sequence of phrases.
A between-groups counterbalanced design was used: each participant used only one of the three devices across each of the three mobility conditions (the order of exposure to each condition was counterbalanced to mitigate against learning effects). 18 participants were recruited with 6 participants randomly allocated to each of the 3 device groups. The participants were a mixture of 9 students (aged 18-24) and 9 staff (aged 25-40) all from the University of New Brunswick. The only exclusion criteria we applied to recruitment was that participants could not be colour blind (if colour blind, they would have been unable to distinguish the differently coloured mats and projections). Of the 18 participants only 3 reported regularly entering text on a mobile device and of those three, only 1 (a Blackberry user), regularly used the device they were randomly allocated in the experiment. The two other participants who reported previous experience of mobile text entry (standard and T9 mobile phones) were allocated different devices from those that they were used to (Fastap and Blackberry respectively).
At the start of each evaluation session (subsequently referred to as stage one), participants were asked to walk 10 laps of the course at the speed at which they felt most comfortable. They were then asked to repeat this task while avoiding hazards. This allowed us to record their preferred walking speed under normal conditions (PWS), and while avoiding hazards (PWSH). Participants were then shown the device they were going to use during stage two of the experiment, and the entry of three example phrases was demonstrated. This allowed the participants to learn the idiosyncrasies of text entry using their particular allocated device. The participants then had the opportunity to practice entering three more phrases under the supervision of the evaluator. Prior to each experimental condition, the participants were required to complete a training task of 3 phrases under the upcoming experimental condition. Following the completion of the text entry tasks for each condition, participants were required to complete NASA TLX workload ratings [6] to capture the their subjective experience of workload.
4.1.2
Results
Comparing the walking speeds of the participants in the first stage of the evaluation gives an indication of the effect of avoiding hazards. A paired t-test showed that the average lap time when avoiding hazards (PWSH - 13.22 seconds) was significantly higher than when simply walking laps (PWS - 11.49 seconds, T17=2.68, p=0.006). Interestingly, despite the relatively straightforward nature of the task, on average participants stepped on a hazard colour for 13.98% of hazards projected. The number of hazards displayed to each participant depended on how quickly they completed the course, but on average 20.67 hazards were displayed of which 2.89 were stepped on. When comparing the walking speed of the participants when entering text, avoiding hazards again had a significant effect on average lap time. On average, the participants walked about 25 laps per text entry condition with the average lap time increasing significantly from 15.48 seconds when performing the task without hazards to 18.66 seconds when avoiding hazards (T17=2.11, p=0.02). When avoiding hazards, the participants stood on the hazard colour for 21.83% of the hazards projected (on average participants stepped on 14.27 of 65.39 projected hazard colours).
Comparing the walking without hazards condition in stage one to the walking without hazards condition in the actual evaluation, we found that the text entry task significantly increased the average lap time from 11.48 seconds to 15.48 seconds (T17=5.03, p<0.001). Similarly, the task significantly increased the average lap time when avoiding hazards from 13.23 seconds to 18.66 seconds (T17=3.8, p<0.001).
A series of two factor ANOVAs were run on the data to compare the impact of the different devices and mobility conditions. It was found that device had a significant affect on task duration (F2,45=53.04, p<0.001) and overall workload
(F2,45=6.11, p=0.004). Device did not, however, significantly
affect text accuracy. Post Hoc Tukey HSD tests showed that, in almost all senses, the Blackberry was the best device for entering text. Average task completion time was significantly less when using the Blackberry (141.3 secs) compared to both the Fastap (341.1 secs, p<0.001) and the T9 (385.9 secs, p<0.001) mobile phones. Similarly, the average overall workload experienced by participants was significantly less when using the Blackberry (6.39) compared to both the Fastap (9.03, p=0.0081) and the T9 (8.83, p=0.0158) mobile phones. There were no significant differences in any of these measures between the Fastap and T9 mobile phones.
Mobility condition significantly effected task duration (F2,45=45.61, p<0.001), accuracy (measured as the minimum
string distance between the desired and actual phrases entered [18], F2,45=4.2, p=0.021) and overall workload (F2,45=47.75,
p<0.001). Post Hoc Tukey tests showed that avoiding hazards had the greatest effect on the results. Hazard avoidance significantly increased average task duration (428.2 secs) compared to both the walking without hazards (avg.=232 secs, p<0.001) and seated (avg.=208.1 secs, p<0.001) task completion times. Average minimum string distance between the presented and entered phrases increased significantly in the hazard condition (2.67) compared with the seated condition (0.39, p=0.0289), although the difference with the walking condition (0.67) was not significant (p=0.0617). Average overall workload was significantly higher in the hazard condition (12.52) than in the walking (7.33, p<0.001) and seated (4.40, p<0.001) conditions. The differences between the walking (without hazards) and seated conditions were not as pronounced, with no significant differences found in task time.
Average overall workload was significantly increased in the walking condition (7.33 for walking vs. 4.40, p=0.0031 for seated).
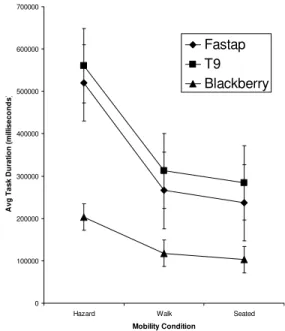
Having considered the effect of device type and the effect of mobility on the results as a whole, consider now the effect of mobility (or evaluation technique), in their own right, on each of the three device types. The effect of the different mobility conditions varied for each device. The overall task time for participants using the Blackberry did differ between the three mobility conditions (hazards – 203.2 seconds, walking – 117.7 seconds and seated – 102.9 seconds) but none of these differences were significant. The overall workload experienced by participants who used the Blackberry was significantly higher in the hazard condition (10.52) than in the walking (5.11, p=0.015) and seated (3.53, p<0.001) conditions. Figure 7 summarises the effect of mobility on the average task times for the different devices. There was no significant difference in overall workload between the walking and seated conditions or in accuracy in any condition.
0 100000 200000 300000 400000 500000 600000 700000
Hazard Walk Seated
Mobility Condition A v g T a s k D ur a ti o n ( m il li s e c on ds ) Fastap T9 Blackberry
Figure 7 – The average task duration for the three devices in each of the three conditions. The effect of walking (versus being seated) can be seen to be minimal. The affect
of avoiding hazards, however, has a far greater impact, especially on the two mobile phones.
The effect of the different conditions on the T9 mobile phone was more pronounced. Task duration was significantly higher in the hazard condition (560.96 seconds) when compared to the walking condition (312.2 seconds, p<0.001) and the seated condition (284.53 seconds, p<0.001). The average overall workload experienced by the participants was significantly higher in the hazard condition (12.67) than in the seated condition (5.58, p<0.001), although no significant difference was found compared to the walking condition (8.22, p=0.083). There were no significant differences in workload between the walking and seated conditions. Accuracy did not vary significantly between any of the conditions.
The results for the Fastap mobile phone were similar to those of the T9 mobile phone. Task duration was significantly higher in the hazard condition (520.29 seconds) when compared to the walking condition (266.07 seconds, p<0.001) and the seated
condition (236.79 seconds, p<0.001). The average overall workload experienced by the participants was significantly higher in the hazard condition (14.36) than in the walking (8.67, p=0.009) and seated (4.08, p<0.001) conditions. There were no significant differences in these results between the walking and seated conditions. Accuracy did not vary significantly between any of the conditions.
4.1.3
Discussion
Overall, the Blackberry was found to be the most effective device for text input. This is not a surprising result as the Blackberry’s design is more focussed on text entry as opposed to the other devices whose central purpose is voice communication. Even when the results of the participant who had familiarity with the Blackberry were discounted the overall results for the Blackberry were not significantly impacted. What is slightly surprising is that there was very little difference in the effectiveness of the Fastap and T9 mobile phones. This is contrary to the findings of Cockburn and Siresena [2] who found that novice participants, in particular, were better able to enter text using a Fastap keypad compared to the T9 keypad. Unlike us, Cockburn and Siresena gave their participants no training before the first condition; they did, however, find that even after training, participants were better able to enter text with the Fastap keypad. This difference in research findings is likely due to: (a) differences in the text entered; and (b) differences in participant mobility. Cockburn and Siresena required their participants to enter a mixture of traditional text, numerical data, and abbreviated text (or text speak); in our evaluation, participants were required to enter only traditional text (which the T9 cell phone is better able to handle compared to numerical and abbreviated text). Cockburn and Siresena make no mention of the participants’ mobility when undertaking the experimental task, implying that the participants were seated; in our evaluation, participants’ mobility ranged from seated to walking a fixed path to walking a variable path while avoiding hazards.
Not surprisingly, avoiding hazards had a significant effect on the participants’ performance. Walking speed (both when simply walking and when entering text); average task time; accuracy; and overall workload were all significantly higher in the hazard condition. What is perhaps more surprising is that task time, accuracy, and overall workload did not significantly differ between the walking and seated conditions. This would indicate the value in using more than just mobility in a mobile evaluation.
What is also interesting is that the effect of avoiding hazards varied for the three devices with the Blackberry least affected. Only the overall workload experienced by the participants increased significantly when using the Blackberry. For the participants who used either of the mobile phones, the overall workload and task time increased significantly. This implies that the participants who used the Blackberry had to work harder but were able to maintain the same level of performance whereas the participants using the phones were unable to maintain the level of performance despite working harder. The average percentage of hazards stepped on in the hazard condition showed no significant difference between the three devices (Blackberry – 24.14%, Fastap – 21.7%, T9 – 19.64%, F2,15=0.33, p=0.721). A significant increase in the number of
hazards stepped on was, however, found when participants were required to enter text (21.83%) as opposed to just walk (13.98%, T17=2.83, p=0.008).). These percentages, however, are somewhat surprising: if a participant was asked to walk through a course that required them to avoid physical obstacles,
then in all likelihood they would walk into none of them. It is also unlikely that they would bump into 1 in every 5 physical obstacles when entering text. The key factor here is to view these figures as an experimental metric as opposed to the likelihood of an event occurring in the real-world. In the lab, participants have no real incentive – other than pride – to avoid the hazards. In the real-world, however, there are very real incentives such as avoiding injury. Petrie et al suggest that when evaluating a mobile system, it is necessary to evaluate the participants’ performance both with the mobile system and in any real world task the participant may be performing [16]. Hazard avoidance and walking speed provide two metrics with which to measure participant performance in the simulated real-world task of walking in a street.
4.2 Study 2 – Mobile Speech Input
On the basis of the ease of incorporating, and apparent effectiveness of, the hazard avoidance system (as identified in Study 1) we included it in the experimental design for a subsequent study. This study, which was designed to investigate the efficacy of different microphones for facilitating speech-based mobile data entry, required participants to enter data items into a tablet PC using speech while mobile and avoiding hazards – akin to typical usage scenarios of mobile technology. In this case, unlike Study 1, all data entry tasks were completed under hazard avoidance conditions; our focus was not on the effect of the hazards per se and so we make no attempt to draw conclusions about hazard v. non-hazard avoidance during data entry. Instead, this section will briefly outline our observations relating to the importance of incorporating the hazards using our technique in terms of establishing a meaningful or representative mobile evaluation environment.
Prior to participants beginning their experimental sessions, we timed them each walking, at a pace that was comfortable, 10 laps/lengths of the grid of mats while carrying, but not using, the mobile technology. We asked them to do this twice: once without hazards, and once while avoiding hazards. We used these measurements to calculate a baseline preferred walking speed (PWS) and preferred walking speed while avoiding hazards (PWSH). On average, according to these two measures, the process of avoiding hazards alone (i.e., without the introduction of data input tasks) caused participants to significantly (F1,46=11.54, p=0.001) reduce their preferred
walking speed by an average of 11%. That is, being required to avoid hazards while walking as opposed to walking without concern for hazards has a substantial impact on user activity in its own right and should not be ignored in an experimental setting.
As participants completed their data entry tasks, we recorded the number of laps they walked as well as the total task duration and used this to calculate their average walking speed while inputting data. We combined this with their PWSH measure to obtain a measure of the percentage of their preferred walking speeds at which participants were able to walk when entering data. Participants walked at 93% of their PWSH when entering data. Thus, the impact of the data input tasks themselves (approx. 7% drop in walking speed) was in itself less substantial than the previously noted impact of hazard avoidance. Combined, the avoidance of hazards and task activities reduced participants to an average of 83% of their preferred walking speed (PWS).
In essence, what these measures show is the significant impact of hazard avoidance on participants’ ability to maintain a preferential walking speed during mobile data entry. It endorses
the real need to include realistic mobile, dynamic hazard avoidance within experiments designed to evaluate aspects of mobile technology.
5. DISCUSSION
We feel that we have developed a technique that enables us to create a realistic mobile context in a lab environment. At the very least, the technique approaches a real-life context because it requires participants to monitor their surroundings and avoid (virtual) hazards as they navigate through the environment. While it is true that the hazards, and their associated projections, are very generic, we see little benefit in providing more specific hazards such as physical obstacles to be navigated or more realistic projections of, for example, a street scene. Such “enhancements” would merely serve to increase the effort required to stage an evaluation with no real benefit in terms of the cognitive effort required by the participant. The results of the two studies presented in the paper both showed that avoiding hazards had a significant impact on the participants’ preferred walking speeds. This alone would indicate that avoiding hazards should be considered for inclusion in an evaluation of mobile technology. Study 1 also investigated the affect of avoiding hazards on the experimental task. No significant differences were found in task performance between the seated and walking conditions. Only when the hazards are considered are significant differences found. This, again, indicates the value of incorporating hazards.
A further indication of the benefits of our approach was that the effectiveness of the different devices under the different conditions varied. The Blackberry, for example, did not show a significant difference in task time across the three conditions while the mobile phones did. This is understandable as the Blackberry has been designed more specifically for text input and so should be able to operate efficiently across a variety of conditions.
One weakness of our approach is the use of colour for our hazards meaning that participants who are colour blind may not be able to distinguish between different mats and projections. This would only become a significant factor, however, in a situation where there was a limited pool of participants. Future work is required to develop the technique beyond visual distractions and/or hazards. The second study in this paper made a start in this area by utilising recorded city street sounds to simulate a typical city street but these sounds were used to test the efficacy of the microphones in these conditions with the participants not required to respond to the sounds in any way. A full description of this study can be found in a companion paper in these proceedings [13].
In the future we hope to run a study comparing the results achieved using our technique with a field study in an equivalent setting. Kjeldskov and Stage showed, however, that it can even be problematic creating a realistic environment in the field as they found that passers-by instinctively avoided the participants and the research “entourage” following them [8]. A further advantage of our technique, over a field study, is the ability to vary the context according to our needs. By changing the rate at which hazards are projected it is possible to vary the “busyness” of the context. While field studies will remain an invaluable tool (especially when considering application specific context) we believe that the technique presented in this paper provides the basis for many future evaluations of mobile applications in a lab context.
6. CONCLUSIONS AND FUTURE WORK
In this paper we have introduced a novel evaluation technique that enables a real-life usage scenario to be incorporated in a lab evaluation. While field-based evaluations will always be important – in particular when evaluating systems that operate in an application-specific context – we believe that this technique is an appropriate alternative, especially for the evaluation of low-level interaction techniques.
The technique uses coloured mats on the lab floor, combined with colours projected onto the walls facing a participant, to create the need for a participant to dynamically change his path. Participants are required to monitor their environment and to change their path, much as a user would when walking down a busy street or hallway. Two studies that employed the technique indicated that it is an effective means to create an appropriate context in which to evaluate mobile systems in a lab. In both cases, the participants’ preferred walking speed was reduced when avoiding hazards. One study also investigated the effect of mobility and avoiding hazards on task performance. In this case, there were no significant differences in the results when comparing the walking and seated conditions implying that mobility alone is insufficient when evaluating mobile applications. The introduction of hazards, however, did highlight significant differences in the results, with one device – the Blackberry – less susceptible to a variation in performance. This would indicate that the introduction of hazards to an evaluation may indicate techniques or devices that are more appropriate for use in a real-world mobile context.
Future work is required to compare the results of a field study with those of a lab evaluation using our technique. If successful, this would confirm that our approach is an effective way to introduce a real-world context into a lab evaluation.
7. ACKNOWLEDGMENTS
We would like to thank the experimental participants without whom this work would not have been possible. This work was performed under NRC REB ethics approval numbers 2006-25 and 2007-22.
8. REFERENCES
[1] Brewster, S. Overcoming the Lack of Screen Space on Mobile Computers Personal and Ubiquitous Computing, 6 (3), 2002, 188-205.
[2] Cockburn, A. and Siresena, A. Evaluating Mobile Text Entry With The Fastap Keypad in People and Computers
XVII: British Computer Society Conference on Human Computer Interaction, (Bath, UK), Springer, 2003, 181-196.
[3] Duh, H.B.-L., Tan, G.C.B. and Chen, V.H.-h. Usability evaluation for mobile device: a comparison of laboratory and field tests in Proceedings of the 8th conference
on Human-computer interaction with mobile devices and services (Mobile HCI 2006), (Helsinki, Finland), ACM Press,
2006, 181-186.
[4] Goodman, J., Brewster, S.A. and Gray, P.D. Using Field Experiments to Evaluate Mobile Guides in Proceedings of
HCI in Mobile Guides (workshop at MobileHCI 2004),
(Glasgow, Scotland), 2004.
[5] GSM_Association. Operators sign up to new structure for easier delivery of text messages across all global networks 8th February, 2006
[6] Hart, S. and Staveland, L. Development of NASA_TLX (Task Load Index): Results of Empirical and Theoretical Research in Human Mental Workload, (Amsterdam, Holland), 1988, 139-183.
[7] Kjeldskov, J., Skov, M.B., Als, B.S. and Høegh, R.T. Is It Worth the Hassle? Exploring the Added Value of Evaluating the Usability of Context-Aware Mobile Systems in the Field in Mobile Human-Computer Interaction - Mobile HCI
2004, (Glasgow, Scotland), Springer-Verlag, 2004, 71-73.
[8] Kjeldskov, J. and Stage, J. New Techniques for Usability Evaluation of Mobile Systems International Journal
of Human Computer Studies (IJHCS), 60, 2004, 599-620.
[9] Kondratova, I., Lumsden, J. and Langton, N. Multimodal Field Data Entry: Performance and Usability Issues in Proceedings of the Joint International Conference on
Computing and Decision Making in Civil and Building Engineering, (Montreal, Canada), 2006.
[10] Kushler, C. AAC Using a Reduced Keyboard in
Proceedings of Technology and Persons with Disabilities Conference 1998, (Los Angeles, CA), 1998.
[11] Levy, D. The Fastap Keypad and Pervasive Computing in Proceedings of the First International
Conference on Pervasive Computing, (London, UK),
Springer-Verlag, 2002, 58 - 68.
[12] Lumsden, J. and Gammell, A. Mobile Note Taking: Investigating the Efficacy of Mobile Text Entry in Mobile HCI
2004, (Glasgow, Scotland), Spring-Verlag, Berlin, 2004,
156-167.
[13] Lumsden, J., Kondratova, I. and Durling, S. Investigating Microphone Efficacy for Facilitation of Mobile Speech-Based Data Entry in Proceedings of Human-Computer
Interaction 2007 (HCI 2007), (Lancaster, UK), ACM Press,
2007.
[14] MacKenzie, I.S. and Soukoreff, R.W. Phrase Sets for Evaluating Text Entry Techniques in CHI '03 extended
abstracts on Human factors in computing systems, (Fort
Lauderdale, FL), ACM Press, 2003, 754-755.
[15] Marriott, K. UK Text Messaging Love Affair Surges Ahead Mobile Data Association, 26th June, 2006
[16] Petrie, H., Furner, S. and Strothotte, T. Design Lifecycles and Wearable Computers for Users with Disabilities in Proceedings of the First Workshop on Human Computer
Interaction with Mobile Devices, (Glasgow, Scotland), 1998,
30-33.
[17] Pirhonen, A., Brewster, S.A. and Holguin, C. Gestural and Audio Metaphors as a Means of Control for Mobile Devices in Proceedings of ACM CHI 2002, (Minneapolis, MN), ACM Press Addison-Wesley, 2002, 291-298.
[18] Soukoreff, R.W. and MacKenzie, I.S. Measuring errors in text entry tasks: an application of the Levenshtein string distance statistic in CHI '01 extended abstracts on
Human factors in computing systems, (Seattle, Washington),
ACM Press, 2001, 319-320.
[19] Wente, M. I dare you to try this: disconnect in Globe