HAL Id: hal-01894058
https://hal-upec-upem.archives-ouvertes.fr/hal-01894058
Submitted on 12 Oct 2018
HAL is a multi-disciplinary open access
archive for the deposit and dissemination of
sci-entific research documents, whether they are
pub-lished or not. The documents may come from
teaching and research institutions in France or
abroad, or from public or private research centers.
L’archive ouverte pluridisciplinaire HAL, est
destinée au dépôt et à la diffusion de documents
scientifiques de niveau recherche, publiés ou non,
émanant des établissements d’enseignement et de
recherche français ou étrangers, des laboratoires
publics ou privés.
A Study of Electric-Field Measurement Disturbances
Brought by Probe Supports
Ludivine Le Bars, Jean-François Rosnarho, Jérôme Sol, Philippe Besnier,
Francois Sarrazin, Elodie Richalot
To cite this version:
Ludivine Le Bars, Jean-François Rosnarho, Jérôme Sol, Philippe Besnier, Francois Sarrazin, et al..
A Study of Electric-Field Measurement Disturbances Brought by Probe Supports. 2018
Interna-tional Symposium on Electromagnetic Compatibility - EMC EUROPE, Aug 2018, Amsterdam, France.
�10.1109/EMCEurope.2018.8484993�. �hal-01894058�
978-1-4673-9698-1/18/$31.00©2018 IEEE
A study of electric-field measurement disturbances
brought by probe supports
Ludivine Le Bars, Jean-François Rosnarho Jérôme Sol, Philippe Besnier François Sarrazin, Elodie Richalot
SIEPEL : Société Industrielle d’Etudes et Protections Electroniques : Impasse de la Manille, 56470 La Trinité-sur-Mer, France
INSA Rennes, CNRS, IETR – UMR 6164, F-35000, Rennes, France
Université Paris-Est, ESYCOM (EA2552), UPEMLV, ESIEE-Paris, CNAM, F-77454
Marne-la-Vallée, France Abstract—This paper deals with interferences induced by some
supports/masts on electric field measurements performed by an electric field probe. These interferences may be due to the geometry of the support or the intrinsic material it is made of. In a reverberation chamber, a mast may lower the chamber Q-factor if it absorbs a fraction of energy. This is a well-known fact. However, a non-dissipative support may also locally (at the probe location) disturb the field due to its scattering properties. This paper discusses the choice of an appropriate mast for an isotropic probe in the context of reverberation chamber measurements. These absorption / scattering features are evaluated and tentatively correlated with disturbances of electric field measurements observed through a specific measurement set-up in an anechoic chamber.
Keywords—Electric-field probe, anechoic chamber, reverberation chamber
I. INTRODUCTION
Reverberation chambers (RCs) are now widely used as a measurement tool to perform either electromagnetic compatibility (EMC) tests or antenna measurements [1] [2]. According to standards [3] [4], the RC calibration requires the use of an isotropic field probe to measure the E-field components at the eight corners of the usable volume. A single electric-field probe and its support are therefore moved in the chamber to collect the data.
It is commonly assumed that the presence of the mast (and its probe) does not disturb the established field inside the cavity. Although it might be neglected, there is no work treated in depth this topic to the authors’ knowledges. As the probe itself is needed for the measurement, we focus in this paper on the impact of the mast on the performed measurement.
A set of preliminary experiments in an RC was carried out using three different masts: a carbon mast of diameter 3.3 cm and height 200 cm, a solid polyester mast and a randomly drilled polyester mast of height 125 cm and diameter 3 cm. It appeared that variations of electric-field measurements were recorded though all precautions were taken to ensure identical probe location and stirrer position.
To make sure that the cause of these discrepancies is the mast itself, the impact of the mast on measurements is investigated through different experimental sets. We aim at studying the RC behavior in the 150 MHz to 1 GHz frequency range.
The first measurement campaign aims at quantifying the absorption properties of the different supports when placed in the working volume of a mode-stirred RC.
The second measurement campaign aims at verifying the influence of the proximity of the mast to the probe itself in well-controlled illumination condition by a linearly polarized field within an anechoic chamber.
This communication is organized as follows. Section II deals with the preliminary results obtained in an RC that justify deeper studies of the impact on measurements of the chosen probe mast. Sections III and IV are respectively devoted to the analysis of the masts absorption within an RC and of their scattering properties in an anechoic chamber. We then conclude in Section V.
II. PRELIMINARY MEASUREMENTS IN REVERBERATION CHAMBER
Choosing a mast to move the probe in an RC to perform a calibration should not be an issue. However, some masts are not recommended in RC such as those in exotic wood that may lower the quality factor of the RC. This leaves the choice to many other possibilities. The analysis of some calibration results led us to check if the chosen mast has no influence on the electric-field probe readings.
Tests are thus performed to understand if significant differences of electric-field may be observed due to a change of mast.
We place the probe with its support, the solid polyester mast, at a random position inside the RC. Two consecutive measurements are done without changing any parameter. We see that the maximum difference between the mean field amplitudes over a stirrer rotation in the two experiments is 0.11 V/m (relative error equal to 0.75 %) in the frequency range 150-180 MHz for 60 stirrer steps with a frequency step of 50 points per decade in logarithmic scale.
To evaluate the influence of the masts on the field read by the probe, the solid polyester mast is placed inside the RC at 33.5 cm from the probe and field measurements are performed in identical conditions over a stirrer rotation. Then, the carbon mast is substituted for the polyester mast. A careful attention is paid to locate the mast and, above all, the probe at the same position. The electric field recorded by the probe is measured once for the identical set of stirrer positions.
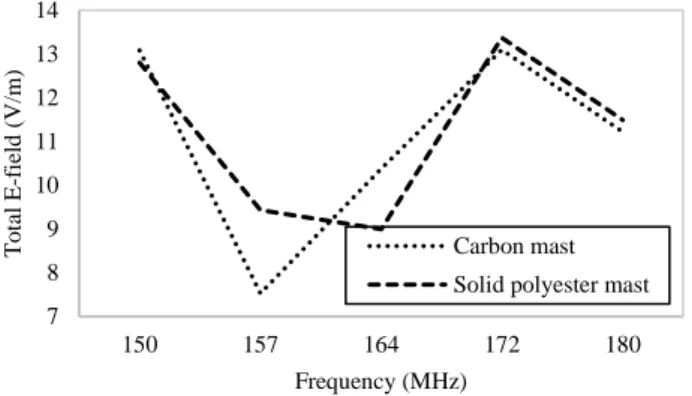
We observe in Fig. 1 two different curves: the dotted and dashed lines correspond to the average total E-field measured with the carbon mast and the solid polyester mast respectively. The difference between the two results widely exceeds the uncertainty observed previously for two consecutive identical measurements. Indeed, it appears that this difference is between 0.27 and 1.9 V/m (relative differences of 2 and 22 %).
Sections III and IV will therefore investigate a possible cause for this discrepancy.
III. ENERGY ABSORPTION BY THE MASTS IN AN RC A. Hardware configuration and measurement parameters
Two log-periodic antennas are located within the IETR’s RC whose dimensions are 8.7 m x 2.9 m x 3.7 m (Fig. 2).
The three masts are placed together on a polystyrene block within the working volume.
Measurements are restricted to 200 MHz, the lower bound of antennas bandwidth for this test set-up. Q-factor estimation is performed between 200 MHz and 2 GHz with a 100 kHz
frequency step. It is then averaged over consecutive 20 MHz frequency bands.
We collect the 𝑆 parameters thanks to a vector network analyzer in the frequency range 210-1910 MHz.
Measurements are performed over a stirrer rotation with a 12° step (30 stirrer positions).
We use (1) from [5] to calculate the quality factors of two configurations: 1) the empty chamber with the polystyrene block 2) the chamber loaded with the three masts:
𝑄 = < |𝑆21|2− |< 𝑆21>|2>
>∗ 𝑍0𝜔𝜀𝑉
(𝜆2/8𝜋) (1 − |< 𝑆11>|2)(1 − |< 𝑆22>|2)𝜂1𝜂2
(1) where 𝑆𝑖𝑗 are the scattering parameters and 𝑍0 is the free space impedance. The factor 𝜆2/8𝜋 corresponds to the effective area of a linearly polarized transmit antenna in a diffusive field. 𝜂1 is the radiation efficiency of antenna 1 and 𝜂2 is the radiation efficiency of antenna 2, 𝑉 corresponds to the volume of the chamber. In this expression, < > corresponds to an average over the states of the chamber during the mechanical stirring process.
B. Results
Quality factors of the empty chamber and with the three masts are compared in the frequency range 210-1910 MHz in Fig. 3.
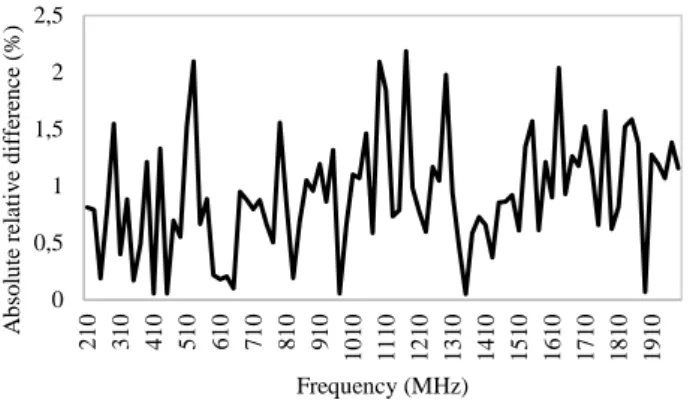
There is no significant difference between the quality factors of the empty chamber and with three masts in the enclosure. The relative difference between the two quality factors is presented in Fig. 4. We can see that this relative difference is below 2.2 % for all frequencies.
We can conclude that the masts, all together, absorb very little electromagnetic energy in an RC, which means that the absorption of every single mast is probably negligible.
Since the absorption can be discarded as an explanation of the observed measurement discrepancy, the scattering effects of the masts are studied in a SIEPEL’s anechoic chamber.
0 5000 10000 15000 20000 25000 30000 35000 2 1 0 3 1 0 4 1 0 5 1 0 6 1 0 7 1 0 8 1 0 9 1 0 1 0 1 0 1 1 1 0 1 2 1 0 1 3 1 0 1 4 1 0 1 5 1 0 1 6 1 0 1 7 1 0 1 8 1 0 1 9 1 0 Q u al it y f ac to r Frequency (MHz) Empty chamber 3 Masts
Fig. 3. Quality factor of the empty chamber and the loaded one (containing the three masts) versus frequency.
7 8 9 10 11 12 13 14 150 157 164 172 180 T o ta l E -f ie ld ( V /m) Frequency (MHz) Carbon mast Solid polyester mast
Fig. 1. Total E-field for the carbon and the solid polyester masts in a reverberation chamber.
Fig. 2. IETR’s reverberation chamber with the two log-periodic antennas and the three masts.
IV. FIELD MEASUREMENT DISTURBANCE FOR VARIOUS PROBE
-SUPPORT DISTANCES
As absorption does not explain the observed disturbances (Section III), the scattering effects of the masts and their possible impact on probe measurements are then investigated. We have carried out a set of experiments using the three different masts when varying their positions in regard to the probe location in an anechoic chamber (Fig. 5).
A. Configuration of the test bench
The hardware configuration is shown in Fig. 6.
A log-periodic emission antenna is placed horizontally in the center of the anechoic chamber and an isotropic field probe is facing the antenna at 112 cm above the pedestrian. The antenna and the probe, at the same height, are spaced by a distance D =
160 cm. Both antenna and probe stay in the same position throughout the measurement campaign.
A generator and a power amplifier are used to generate a signal over a frequency band from 150 MHz to 1 GHz in increments of 50 points per decade in logarithmic scale, so that the E-field at the probe location is much higher (above 10 V/m) than its sensitivity (0.8 V/m).
A first series of measurements is launched in the empty chamber (without mast). Then, we introduce the different masts at our disposal individually. We store the field values for several distances 𝑑 between the mast and the probe {150, 100, 50, 40, 30, 20, 10 cm}.
B. Uncertainty of measurements and confidence interval The reproducibility of the measurements is evaluated using five consecutive measurements in the empty chamber. The observed parameter is the average total electric field. The resulting uncertainty is quantified from the estimation of the standard deviation of the total E-field measurements.
The averaged value of the total field over the five measures in the empty cavity is firstly evaluated using (2).
< 𝐸𝑡𝑜𝑡 𝑒𝑚𝑝𝑡𝑦 𝑠𝑒𝑟𝑖𝑒>
= ∑ 𝐸𝑖 𝑡𝑜𝑡 𝑠𝑒𝑟𝑖𝑒 𝑖
𝑁𝑢𝑚𝑏𝑒𝑟 𝑜𝑓 𝑠𝑒𝑟𝑖𝑒𝑠 𝑖𝑛 𝑡ℎ𝑒 𝑒𝑚𝑝𝑡𝑦 𝑐ℎ𝑎𝑚𝑏𝑒𝑟
(2)
where 𝑖 represents the number of the considered measure. Then, we compute the standard deviation 𝜎 of the successive field data in the same configuration relative to the average total field in the empty chamber as follows:
𝜎 = √∑ (𝐸𝑖 𝑡𝑜𝑡 𝑠𝑒𝑟𝑖𝑒 𝑖−< 𝐸𝑡𝑜𝑡 𝑒𝑚𝑝𝑡𝑦 𝑠𝑒𝑟𝑖𝑒>)2
𝑁𝑢𝑚𝑏𝑒𝑟 𝑜𝑓 𝑠𝑒𝑟𝑖𝑒𝑠 − 1 (3)
Finally, the 95% Confidence Interval (CI) is defined assuming a Gaussian distribution of the uncertainty.
𝐶𝐼+= 20 ∗ log (< 𝐸𝑡𝑜𝑡 𝑒𝑚𝑝𝑡𝑦 𝑠𝑒𝑟𝑖𝑒> +2 ∗ 𝜎) (4) 𝐶𝐼−= 20 ∗ log (< 𝐸𝑡𝑜𝑡 𝑒𝑚𝑝𝑡𝑦 𝑠𝑒𝑟𝑖𝑒> −2 ∗ 𝜎) (5) We obtain the graphic of Fig. 7. The width of the CI remains below 0.44 dB, that is very low compared to the mean field
0 0,5 1 1,5 2 2,5 2 1 0 3 1 0 4 1 0 5 1 0 6 1 0 7 1 0 8 1 0 9 1 0 1 0 1 0 1 1 1 0 1 2 1 0 1 3 1 0 1 4 1 0 1 5 1 0 1 6 1 0 1 7 1 0 1 8 1 0 1 9 1 0 A b so lu te r el at iv e d if fe re n ce ( %) Frequency (MHz)
Fig. 4. Absolute relative difference between the RC quality factors with and without the masts versus frequency.
Fig. 5. Electric field probe in SIEPEL’s anechoic chamber.
D = 160 cm
d Probe
Mast
Fig. 6. Hardware configuration of the test bench – Top view (left) and front view (right) – h corresponds to the height of the masts: 125 cm for the polyester masts
and 200 cm for the carbon mast. d Probe Mast Pedestrian Ground 112 cm h 20 22 24 26 28 30 32 34 1 5 0 1 6 4 1 8 0 1 9 8 2 1 7 2 3 8 2 6 1 2 8 6 3 1 3 3 4 4 3 7 7 4 1 3 4 5 3 4 9 7 5 4 5 5 9 7 6 5 5 7 1 8 7 8 7 8 6 3 9 4 6 1 0 0 0 C o n fi d en ce i n te rv al ( d B ) Frequency (MHz) CI+
amplitude of 30 dB. It means that in relative value the CI is below ± 1.46 %. The average values over these five consecutive measurements are considered in the following as the reference data in the empty (no mast included) anechoic chamber. C. Influence of masts on the evaluation of the average total
field
We compare the total E-field collected in the empty chamber and in presence of the mast. As an example, we present the figure for the carbon mast located at d = 10 cm from the probe (Fig. 8).
The total field values read by this probe in the presence of this mast are very different compared to the empty chamber values (error up to 13 V/m i.e. 37 % at the frequency 360 MHz). The difference strongly depends on the considered frequency.
We perform these tests for the carbon, the solid polyester and the drilled polyester masts and we examine in detail what happens according to the distance d (Section D) and the type of mast (Section E).
D. Influence of the position of the masts
This part focuses on the influence of the distance between the mast and the probe (distance 𝑑). We compute the standard deviation of the total field for each probe-mast distance relative to the average E-field in the empty chamber and compare the data for each probe-mast distance with the CI of our measurements.
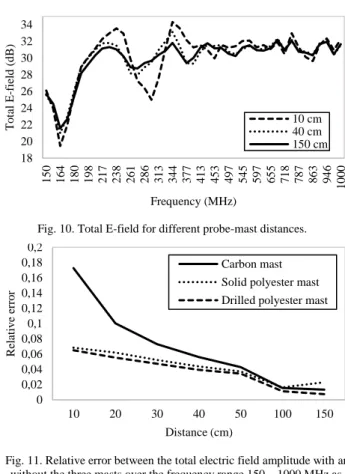
We present the results for the carbon mast support in Fig. 9 (d = 150 cm) and in Fig. 10 (d = {150, 40, 10 cm}). It should be noted that the carbon mast presents the poorest performance according to next Section E.
According to these curves, the mast no longer influences the measurements at d = 150 cm whereas it considerably influences the field values read by the probe at d = 40 cm and this effect increases when we get closer to the field probe.
Similar trends may be observed from the measurement data obtained with the two polyester masts. Results are not shown here for brevity, but the next Section compares their relative performances.
E. Influence of the masts material
In this part, we compare the influence of the different materials of the masts on the field values read by the probe.
We calculate the relative error 𝜀𝑟 over the whole frequency range as: 𝜀𝑟= √∑ (𝐸𝑓 𝑡𝑜𝑡 𝑝𝑜𝑠𝑖𝑡𝑖𝑜𝑛 𝑖− < 𝐸𝑡𝑜𝑡 𝑒𝑚𝑝𝑡𝑦 𝑠𝑒𝑟𝑖𝑒 >)2 𝑁𝑢𝑚𝑏𝑒𝑟 𝑜𝑓 𝑓𝑟𝑒𝑞𝑢𝑒𝑛𝑐𝑖𝑒𝑠 < 𝐸𝑡𝑜𝑡 𝑒𝑚𝑝𝑡𝑦 𝑠𝑒𝑟𝑖𝑒> (6)
Results are presented in Fig. 11 versus the distance between each mast and the fixed field probe. As expected, the error on
0 10 20 30 40 50 60 1 5 0 1 6 4 1 8 0 1 9 8 2 1 7 2 3 8 2 6 1 2 8 6 3 1 3 3 4 4 3 7 7 4 1 3 4 5 3 4 9 7 5 4 5 5 9 7 6 5 5 7 1 8 7 8 7 8 6 3 9 4 6 1 0 0 0 T o ta l E -f ie ld ( V /m) Frequency (MHz) Empty chamber d = 10 cm
Fig. 8. Comparison between the total E-field in the empty chamber and with the carbon mast placed at 10 cm from the probe.
0 0,02 0,04 0,06 0,08 0,1 0,12 0,14 0,16 0,18 0,2 10 20 30 40 50 100 150 R el at iv e er ro r Distance (cm) Carbon mast Solid polyester mast Drilled polyester mast
Fig. 11. Relative error between the total electric field amplitude with and without the three masts over the frequency range 150 – 1000 MHz as a
function of the mast-field probe distance. 20 22 24 26 28 30 32 34 1 5 0 1 6 4 1 8 0 1 9 8 2 1 7 2 3 8 2 6 1 2 8 6 3 1 3 3 4 4 3 7 7 4 1 3 4 5 3 4 9 7 5 4 5 5 9 7 6 5 5 7 1 8 7 8 7 8 6 3 9 4 6 1 0 0 0 T o ta l E -f ie ld ( d B ) Frequency (MHz) 150 cm CI+
CI-Fig. 9. Total E-field for d = 150 cm compared with the confidence interval.
18 20 22 24 26 28 30 32 34 1 5 0 1 6 4 1 8 0 1 9 8 2 1 7 2 3 8 2 6 1 2 8 6 3 1 3 3 4 4 3 7 7 4 1 3 4 5 3 4 9 7 5 4 5 5 9 7 6 5 5 7 1 8 7 8 7 8 6 3 9 4 6 1 0 0 0 T o ta l E -f ie ld ( d B ) Frequency (MHz) 10 cm 40 cm 150 cm
the values read by the field probe increases when bringing the mast closer to the probe. Besides, we observe that the polyester masts have less influence on the measurement results with respect to the carbon one.
V. CONCLUSION
The observation of a mast impact on the field values measured by a probe in an RC led us to study more precisely the impact of the mast material and its distance from the probe.
Our study shows that their impact is not related to a phenomenon of absorption as the RC quality factor is almost the same with and without the mast. However, some diffraction by the mast has been demonstrated using measurement performed in an anechoic chamber, and this effect decreases with the distance between mast and probe. We also show that the effect depends on the properties of the chosen mast; thus, the carbon mast has a stronger impact than the polyester masts. Still, the
polyester masts have a noticeable impact on the E-field probe reading if very close to the probe and should be taken into account when evaluating the measurement uncertainties.
REFERENCES
[1] J-F. Rosnarho, S. Le Berre, Reverberation Chambers Handbook, SIEPEL, version 4 – 2018.
[2] P. Besnier, B. Démoulin, Electromagnetic Reverberation Chambers, ISTE/Wiley, Paris, 2011.
[3] AFNOR. “Electromagnetic Compatibility (EMC) Part 4-21: Testing and measurement techniques – Reverberation chamber test methods”, NF EN 61000-4-21, October 2011.
[4] AFNOR. “Environmental Conditions and Test Procedures for Airborne Equipment”, RTCA DO-160G, December 2010.
[5] P. Besnier, C. Lemoine, J. Sol, “Various estimations of composite Q-factor with antennas in a reverberation chamber”, Proc. IEEE International Symposium on Electromagnetic Compatibility (EMC), 2015, pp. 1123-1227.