Publisher’s version / Version de l'éditeur:
Vous avez des questions? Nous pouvons vous aider. Pour communiquer directement avec un auteur, consultez la première page de la revue dans laquelle son article a été publié afin de trouver ses coordonnées. Si vous n’arrivez pas à les repérer, communiquez avec nous à PublicationsArchive-ArchivesPublications@nrc-cnrc.gc.ca.
Questions? Contact the NRC Publications Archive team at
PublicationsArchive-ArchivesPublications@nrc-cnrc.gc.ca. If you wish to email the authors directly, please see the first page of the publication for their contact information.
https://publications-cnrc.canada.ca/fra/droits
L’accès à ce site Web et l’utilisation de son contenu sont assujettis aux conditions présentées dans le site LISEZ CES CONDITIONS ATTENTIVEMENT AVANT D’UTILISER CE SITE WEB.
Research Report (National Research Council of Canada. Institute for Research in
Construction), 2003-04-01
READ THESE TERMS AND CONDITIONS CAREFULLY BEFORE USING THIS WEBSITE.
https://nrc-publications.canada.ca/eng/copyright
NRC Publications Archive Record / Notice des Archives des publications du CNRC :
https://nrc-publications.canada.ca/eng/view/object/?id=e16141b8-51ff-448e-a760-05452309433c https://publications-cnrc.canada.ca/fra/voir/objet/?id=e16141b8-51ff-448e-a760-05452309433c
NRC Publications Archive
Archives des publications du CNRC
For the publisher’s version, please access the DOI link below./ Pour consulter la version de l’éditeur, utilisez le lien DOI ci-dessous.
https://doi.org/10.4224/20378519
Access and use of this website and the material on it are subject to the Terms and Conditions set forth at
Kemano Fire Studies - Part 1: Response of Residential Smoke
Detectors
KEMANO FIRE STUDIES –
Part 1: Response of
Residential Smoke Alarms
Research Report 108
Date of Issue: April 2003
Authors: Joseph Z. Su
George P. Crampton, Don W. Carpenter
Cameron McCartney, Patrice Leroux
Published by
Institute for Research in Construction National Research Council Canada Ottawa, Canada
KEMANO FIRE STUDIES – Part 1: Response of Residential Smoke Alarms
By
Joseph Z. Su, George P. Crampton, Don W. Carpenter, Cameron McCartney, Patrice Leroux Fire Risk Management Program
Institute for Research in Construction National Research Council of Canada
ABSTRACT
NRC’s Fire Risk Management Program has completed an experimental study of smoke-alarm response in residential dwellings, using the unique opportunity of the Kemano Public Safety Initiative. Working with the Underwriters’ Laboratories of Canada, NRC conducted a series of full-scale fire detection experiments in Kemano, a deserted town in northern British Columbia. This study has produced experimental data that can be used to analyze the impacts of type, number and location of smoke-alarms on fire detection time, to improve relevant
codes/standards, and ultimately to make better use of current smoke-alarm technology to safeguard Canadians and their homes against fires.
TABLE OF CONTENTS
1.0 INTRODUCTION...1
2.0 FIRE EXPERIMENTS...1
2.1 Experimental Houses...1
2.2 Fuels and Fire Scenarios ...2
2.3 Smoke-Alarms Used...2
2.4 Measurement Devices ...3
2.5 Experiments in House BB-513 ...3
2.5.1 Experimental Set-up in House BB-513 ...4
2.5.2 Results of Experiments in House BB-513...6
2.6 Experiments in House K1-106 ...13
2.6.1 Experimental Set-up in House K1-106 ...14
2.6.2 Results of Experiments in House K1-106 ...15
3.0 DISCUSSION...19
3.1 Optical Density at Smoke-Alarm Activation ...19
3.2 Effect of An Intervening Door ...20
3.3 Effect of Smoke-Alarm Type ...20
3.4 Effect of “Dead Air Space”...21
3.5 Carbon Monoxide Alarm Threshold for Fire Detection ...22
4.0 CONCLUSIONS ...22
5.0 ACKNOWLEDGEMENTS...24
6.0 REFERENCES...24
LIST OF TABLES
Table 1 Matrix of Experiments
Table 2 Location of Detector, Measurement Device and Data Storage for Tests 1-9 in House BB-513
Table 3 Results of Experiments in Test House BB-513
Table 4 Optical Density at Activation of Detectors 6–8, 14–16 and 26–28 in Test House BB-513
Table 5 Location of Detector, Measurement Device and Data Storage for Tests 10-13 in House K1-106
Table 6 Results of Experiments in Test House K1-106
Table 7 Optical Density at Activation of Detectors 4–6, 7–9 and 10–12 in Test House K1-106
LIST OF FIGURES
Figure 1 Family dwelling BB-513 for Tests 1-9 Figure 2 Family dwelling K1-106 for Tests 10-13
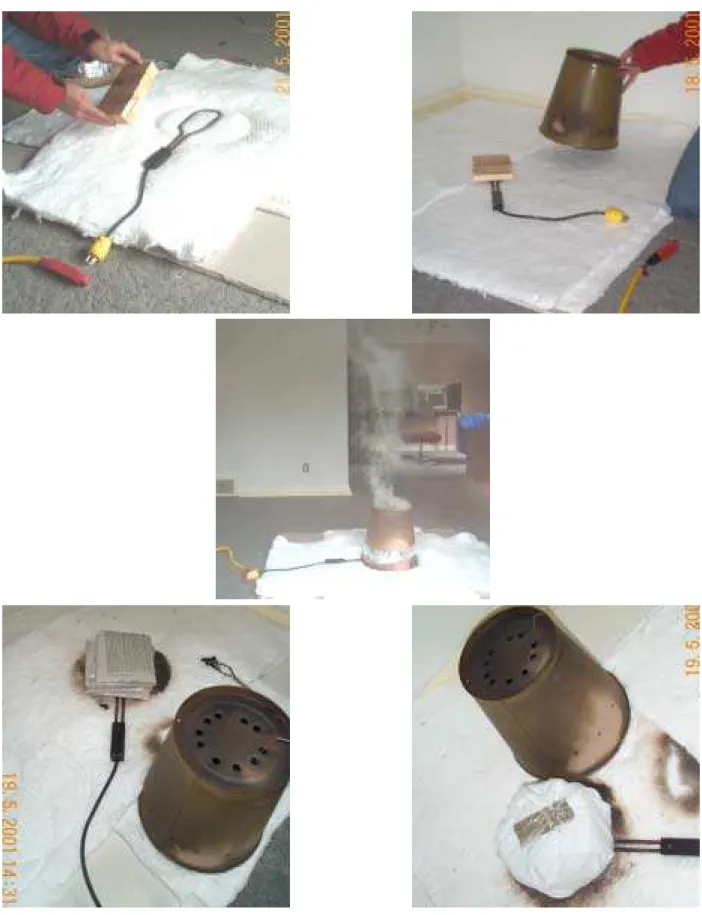
Figure 3 Wood, paper, polyurethane foam wrapped with cotton flannel on an electric igniter, covered by a perforated metal bucket
Figure 4 Section of upholstered chair and an electric igniter Figure 5 Cooking oil and an electric igniter
Figure 6 Circuit used to detect smoke detector activation Figure 7 Typical activation signals from smoke detectors Figure 8a, 8b Ground floor plan of House BB-513
Figure 9 Snapshots of the experiment set-up in House BB-513 Figure 10 Illustration of so-called “dead air space”
Figure 11 Temperatures at fire source and on TC trees in bedroom, corridor and living room during Test 1
Figure 12 Profiles of CO, optical density and detector response during Test 1
Figure 13 Temperatures at fire source and on TC trees in bedroom, corridor and living room during Test 2
Figure 14 Profiles of CO, optical density and detector response during Test 2
Figure 15 Temperatures at fire source and on TC trees in bedroom, corridor and living room during Test 3
Figure 16 Profiles of CO, optical density and detector response during Test 3
Figure 17 Temperatures at fire source and on TC trees in bedroom, corridor and living room during Test 4
Figure 18 Profiles of CO, optical density and detector response during Test 4
Figure 19 Temperatures at fire source and on TC trees in bedroom, corridor and living room during Test 5
Figure 20 Profiles of CO, optical density and detector response during Test 5
Figure 21 Temperatures at fire source and on TC trees in bedroom, corridor and living room during Test 6
Figure 22 Profiles of CO, optical density and detector response during Test 6
Figure 23 Temperatures at fire source and on TC trees in bedroom, corridor and living room during Test 7
Figure 24 Profiles of CO, optical density and detector response during Test 7
Figure 25 Temperatures at fire source and on TC trees in bedroom, corridor and living room during Test 8
Figure 26 Profiles of CO, optical density and detector response during Test 8
Figure 27 Temperatures at fire source and on TC trees in bedroom, corridor and living room during Test 9
Figure 28 Profiles of CO, optical density and detector response during Test 9 Figure 29 Ground floor plan of House K1-106
Figure 30 Upstairs floor plan of House K1-106
Figure 32 Temperatures at fire source and on TC trees in living room, staircase and 2nd floor corridor during Test 10
Figure 33 Profiles of CO, optical density and detector response during Test 10
Figure 34 Temperatures at fire source and on TC trees in living room, staircase and 2nd floor corridor during Test 11
Figure 35 Profiles of CO, optical density and detector response during Test 11
Figure 36 Temperatures at fire source and on TC trees in living room, staircase and 2nd floor corridor during Test 12
Figure 37 Profiles of CO, optical density and detector response during Test 12
Figure 38 Temperatures at fire source and on TC trees in living room, staircase and 2nd floor corridor during Test 13
Figure 39 Profiles of CO, optical density and detector response during Test 13 Figure 40 Relative activation times of smoke detectors in Tests 1-9
Figure 41 Relative activation times of smoke detectors in Tests 10-11
Figure 42 Relative difference in response time between the photoelectric detector and the ionization detector at each given location (Tests 1-9)
Figure 43 Relative difference in response time between the photoelectric detector and the ionization detector at each given location (Tests 10-13)
Figure 44 Difference in response time between photoelectric and ionization detectors in 1-storey house and in 2-storey house
Figure 45 Imaginary response of smoke detectors inside and outside a “dead air space" and below recommended heights
Figure 46 Relative activation times of smoke detectors inside and outside “dead air spaces” and below recommended heights (Test 1)
Figure 47 Relative activation times of smoke detectors inside and outside “dead air spaces” and below recommended heights (Test 2)
Figure 48 Relative activation times of smoke detectors inside and outside “dead air spaces” and below recommended heights (Test 3)
Figure 49 Relative activation times of smoke detectors inside and outside “dead air spaces” and below recommended heights (Test 4)
Figure 50 Relative activation times of smoke detectors inside and outside “dead air spaces” and below recommended heights (Test 5)
Figure 51 Relative activation times of smoke detectors inside and outside “dead air spaces” and below recommended heights (Test 6)
Figure 52 Relative activation times of smoke detectors inside and outside “dead air spaces” and below recommended heights (Test 7)
Figure 53 Relative activation times of smoke detectors inside and outside “dead air spaces” and below recommended heights (Test 8)
Figure 54 Relative activation times of smoke detectors inside and outside “dead air spaces” and below recommended heights (Test 9)
KEMANO FIRE STUDIES – Part 1: Response of Residential Smoke Alarms
by
Joseph Z. Su, George P. Crampton, Don W. Carpenter, Cameron McCartney, Patrice Leroux Fire Risk Management Program
Institute for Research in Construction National Research Council of Canada
1.0 INTRODUCTION
Kemano Village was a company town located in northern British Columbia and owned by Alcan Smelters and Chemicals Ltd. This remote village was recently closed as a result of restructured power operations and was donated to the Government of British Columbia's fire services for training of firefighters, fire investigators and for fire studies. This was known as the Kemano Public Safety Initiative (KPSI).
The KPSI provided a unique opportunity to conduct real-scale fire experiments in
residential dwellings. Under a partnership with the Underwriters' Laboratories of Canada (ULC), the National Research Council of Canada (NRC) completed a series of fire experiments in 2 houses at the Kemano Village to study the response of residential smoke-alarms.
Smoke-alarms are important and cost-effective fire protection devices in residential dwellings, providing fire detection and evacuation warnings for occupants in case of fires. Statistical data from 1985 to 1995 shows that the fire death rate in Canada has declined by more than 40%, mainly attributed to the use of residential smoke-alarms and the enforcement of relevant codes and standards. However, improving these codes and standards is an ongoing task for the fire protection community. How to maximize the benefit of current smoke-alarm technologies to residential fire safety still warrants further studies.
The objective of this project was to evaluate the performance of current smoke-alarms and explore ways to make better use of current smoke-alarm technology to safeguard
Canadians and their homes against fires. The project has produced experimental data that can be used to analyze the impacts of type, number and location of smoke-alarms on occupant warning time. The results of the experiments are documented in this report.
2.0 FIRE EXPERIMENTS
2.1 Experimental Houses
NRC and ULC conducted 13 fire detection experiments in two family dwellings; both employed typical wood-frame construction with common internal materials. Both houses were unheated and the ambient temperature was around 12°C.
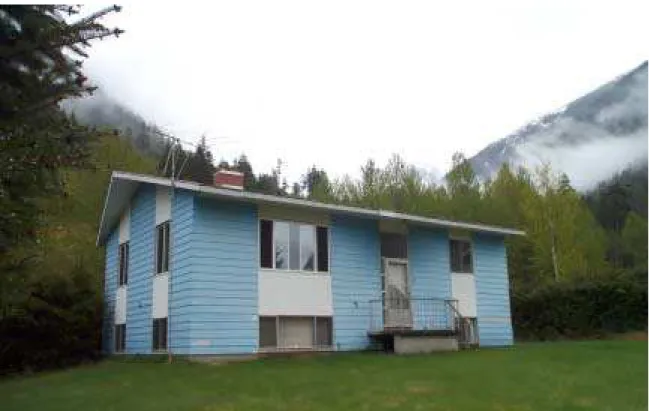
One family dwelling was a 1-storey single house (BB-513), as shown in Figure 1
(Approximate square footage: 90 m2 per floor, 180 m2 total). This bungalow had 2 bedrooms, a bathroom, a kitchen, a living and dining room on the ground floor and 2 bedrooms, a bathroom, a recreation room and a utility room in the basement. The house was completely carpeted.
The other family dwelling was a 2-storey single house (K1-106), as shown in Figure 2 (Approximate square footage: 140 m2 total). The 2-storey dwelling had 3 bedrooms and a bathroom on the second floor, a living room, a dining room and a kitchen on the ground floor and a recreation room and a utility room in the basement. The ground floor was carpeted; the stairs and second floor (including bedrooms) were hardwood flooring.
2.2 Fuels and Fire Scenarios
Fire scenarios included flaming and smouldering fires in the bedroom, living room and kitchen. To provide the greatest challenges to the operation of the smoke-alarms, the fires used in the experiments were small and grew slowly, which represented the worst case scenario as far as fire detection was concerned. Fuel packages were prepared using materials
representative of common household items that are frequently first ignited in fire incidents. These fuel packages consisted of wood, paper, polyurethane foam, cotton flannel, upholstered furniture and cooking oil.
The wood fuel package was 5 or 10 pine sticks (19 mm x 38 mm x 127 mm each). The paper fuel package was 20 sheets of newspaper (0.50 m x 0.68 m per sheet) folded to a size of 0.165 m x 0.23 m. Polyurethane foam (0.10 m thickness) was cut into round pieces (0.20 m diameter) wrapped with cotton flannel (0.53 m x 0.57 m sheet) to simulate mattress or cushion. The cotton flannel package was a sheet of 0.86 m x 0.86 m folded to a size of 0.215 m x
0.215 m.
Figure 3 shows the fuel packages (wood, paper, foam wrapped with cotton flannel) and ignition source used in some experiments. An electric heating element was used as an ignitor. Ceramic film insulation was used to protect the floor. The fuel package was placed on the ignitor. A perforated metal bucket was used to cover the fuel and ignitor. The holes around the metal bucket controlled the amount of air available for combustion. The smoke came out from the holes on the top of the metal bucket. Figure 4 shows a section of upholstered chair with the ignitor inserted between the cushion and arm. Figure 5 shows a kitchen fire scenario with 450 mL of cooking oil as fuel.
NRC staff manually put out the fire by turning off the ignitor and carefully dropping the fuel package into a bucket of water or using a blanket at the end of each experiment.
2.3 Smoke-Alarms Used
ULC listed smoke-alarms, conforming to CAN/ULC-S531-M87 "Standard for
Smoke-Alarms" [1], were installed in the experimental houses. These smoke-alarms included ionization, photoelectric and dual (combination ionization-photoelectric) smoke-alarms powered by batteries. The response times of the smoke-alarms were determined by measuring the current draw through the batteries.
ULC-listed carbon monoxide detectors were also installed in the houses. These CO detectors were designed to continuously monitor for CO and to display the CO level from 0 to 999 ppm. The full alarm will sound (1) in less than 90 minutes at concentrations of 100 ppm, (2) in less than 35 minutes at concentrations of 200 ppm, (3) in less than 15 minutes at concentrations of 400 ppm, (4) immediately at concentrations above 600 ppm.
2.4 Measurement Devices
Various devices were used to measure smoke-alarm response, smoke optical density (smoke obscuration), carbon monoxide concentration and temperature. Experimental data was collected using a data acquisition system.
Figure 6 shows a circuit used to monitor smoke-alarm activation, which was inserted between the positive lead of the battery and the power terminal of the smoke-alarm. The output signal was a current draw through the battery. The current draw should stay at zero when there was no alarm and should change to nonzero when the smoke-alarm actuated, as shown in Figure 7. The response times of all smoke-alarms were recorded.
Six Pulsed 940 Smoke Density Meters, designed and built by NRC, were used to measure the optical density of smoke. Each smoke density meter uses a pulsed, near-infrared light emitting diode (LED) as a light source (940 nanometer) and a pin photodiode and
subsequent electronics as a receiver. The smoke density meter operates by sending a beam of light in a direct path from the transmitter through a known distance to the receiver. The distance from the transmitter to the receiver was fixed at 0.60 m for all experiments. Any smoke coming between the light source and receiver reduces the received signal strength since the smoke absorbs and reflects a fraction of the light. The optical density is proportional to the logarithm of the reciprocal of the output signal. All smoke density meters were calibrated using optical filters with known densities at 940 nanometer.
A nondispersive infrared (NDIR) gas analyzer was used to measure the concentrations of carbon monoxide (CO) and carbon dioxide (CO2). This gas analyzer was designed
specifically to measure CO and CO2 in the frequencies where CO and CO2 absorb infrared light.
Temperatures in the fire rooms and egress routes were measured using Type K thermocouples (0.038 mm diameter, 26 AWG, ±2.2 oC), made of nickel-chromium and nickel-aluminum alloys. Thermocouple (TC) trees consisting of multiple thermocouples were installed in various positions to measure vertical and horizontal temperature distributions in the houses.
Measurement devices also included cameras for audio/video records. Table 1 shows a matrix of fire experiments. A detailed description of experiments in each house is described in the following subsections.
2.5 Experiments in House BB-513
The first round of 9 fire detection experiments was conducted in the bungalow (BB-513) with fires originating in a ground floor bedroom and the living room. A total of 35 smoke-alarms were installed on the ground floor, including 14 photoelectric smoke-alarms, 14 ionization smoke-alarms, 5 dual (combination ionization-photoelectric) smoke-alarms, and 2 carbon monoxide detectors.
2.5.1 Experimental Set-up in House BB-513
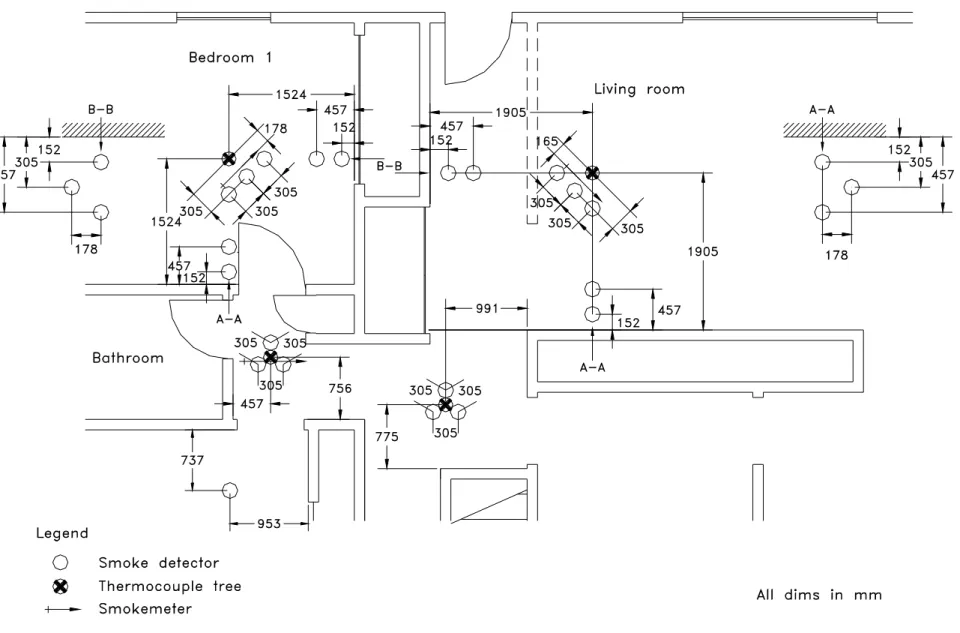
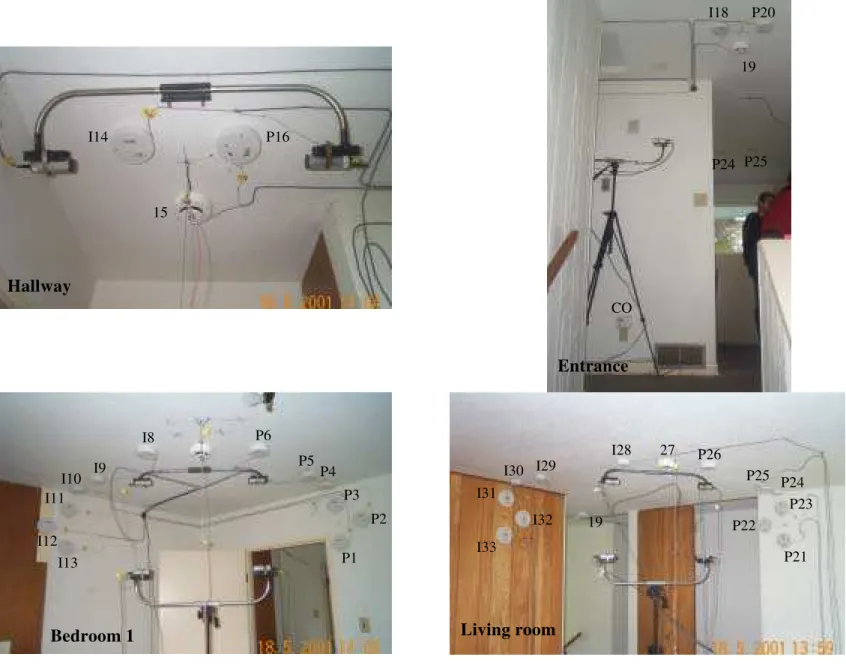
Figure 8 shows a plan view of the ground floor, fire locations, smoke-alarms, CO detectors and measurement devices installed in House BB-513. Figure 9 shows snapshots of the experiment set-up in House BB-513. The ground floor had a 2.44 m high ceiling and a 0.42 m lintel above the bedroom doors.
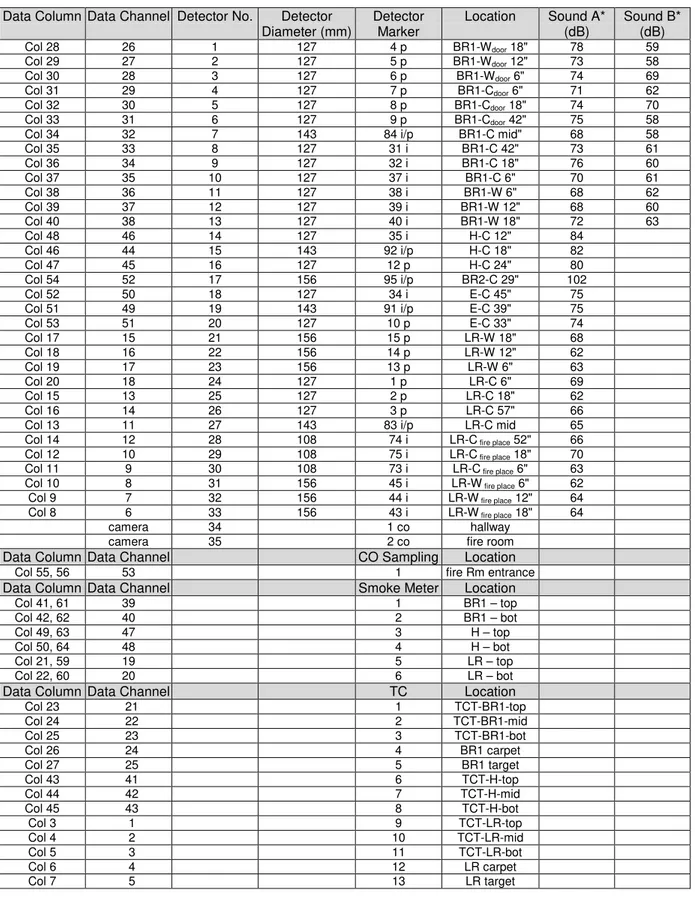
Table 2 shows a cross-reference of all smoke-alarms and measurement devices in House BB-513 and in the data acquisition system. Data Column and Data Channel are the virtual locations of smoke-alarms or devices in the data system. Detector Marker is the shipping label on each smoke-alarm. Detector No. is the smoke-alarm identifier used for all the drawings and figures in this report. In Figure 8, each ionization smoke-alarm is labelled with an "I" in front of its Detector No.; each photoelectric smoke-alarm is labelled with a "P" in front of its Detector No.; each dual smoke-alarm is labelled with its Detector No. only.
2.5.1.1 Smoke-alarm positioning
An ionization smoke-alarm, a photoelectric smoke-alarm and a dual smoke-alarm formed a detector group. Four such groups of smoke-alarms were installed at the ceiling of Bedroom 1 (labelled as P6, 7, I8 in Figure 8), corridor (labelled as I14, 15, P16), foyer (labelled as I18, 19, P20), and the living room (labelled as P26, 27, I28). For each group, the
smoke-alarms were spaced 305 mm from each other (centre to centre). The corridor detector group (Detectors I14, 15, P16) outside the bedrooms was at a code-required location [2]. The four groups would produce comparative data for smoke-alarms in these general locations and also provide comparative data for different smoke-alarm types.
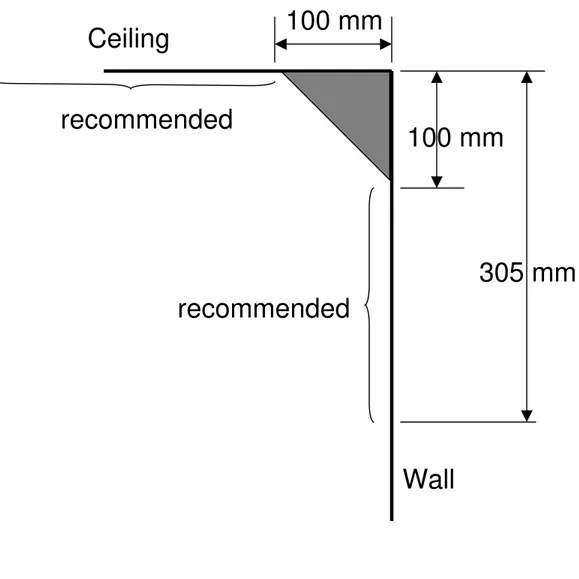
Figure 10 illustrates a so-called “dead air space”, the corner space 100 mm from ceiling and wall joints in each direction where smoke may not reach. Theoretically, smoke-alarms should not work in the dead air spaces, and should not be located in these spaces. According to the installation standard [3], smoke-alarms should be located a minimum of 100 mm away from the ceiling-wall joints; wall-mounted smoke-alarms are also limited to a maximum of 300 mm away from the ceiling-wall joints. However, the “dead air space” and its effect on smoke-alarm response had not been adequately defined and addressed experimentally.
In order to study the “dead air space” and its effect on smoke-alarm response, additional photoelectric smoke-alarms and ionization smoke-alarms were strategically installed inside and outside 4 "dead air spaces" in the living room (Detectors P21-P25 and I29- I33) and Bedroom 1 (Detectors P1-P5 and I9-I13), as shown in Figures 8-9. For each of these 4 "dead-air spaces", 2 smoke-alarms were installed at the ceiling with one inside and the other outside the “dead air space"; 3 smoke-alarms were installed on the wall with the top one inside the “dead air space", the mid one in the acceptable region and the low one below the acceptable height. The
smoke-alarm spacing indicated in Figure 8 is the distance from the centre of the smoke-alarm. In fact, the bedroom smoke-alarms (Detectors P3, P4, I10, I11) inside the "dead air spaces" had their edge 86 mm from the ceiling-wall joints and the smoke-alarms (Detectors P1, I13) below the acceptable height had their top edge 394 mm from the ceiling. The living-room smoke-alarms (Detectors P23, I31) inside the "dead air spaces" had their top edge 72 mm from the ceiling and the smoke-alarms (Detectors P21, I33) below the acceptable height had their top edge 379 mm from the ceiling. The 2 smoke-alarms in the ceiling "dead air spaces" had their edge 86 mm (Detector P24) and 96 mm (Detector I30) from the walls in the living room. Thus,
Bedroom 1 and the living room each had an additional group of 13 smoke-alarms.
A dual smoke-alarm was installed at the ceiling of Bedroom 2 (labelled as 17 in Figure 8). CO detectors were installed on walls above the floor at a 380 mm height in the corridor, 530 mm height in Bedroom 1, and 1090 mm height in the living room.
2.5.1.2 Optical density measurement
Smoke optical density was measured as a function of time using 6 smoke density meters at 3 locations (in Bedroom 1, corridor and the living room), as shown in Figures 8 and 9. Each location had 2 measurement points, one at the ceiling height (150 mm below the ceiling, very close to the grouped smoke-alarms) and the other at eye height (1.68 m above the floor).
2.5.1.2 Carbon monoxide measurement
The CO concentration was measured using the NDIR gas analyzer. The gas sampling port was 1.7 m high either at the door of Bedroom 1 or at the entrance of the living room.
2.5.1.3 Temperature measurement
A thermocouple was placed at the fire source (at the smoke exit holes when the metal bucket was used) to monitor fire development. Another thermocouple was placed underneath the ceramic film insulation that protected the floor.
Temperatures in the living room, corridor and Bedroom 1 were measured using 3 thermocouple trees, as shown in Figures 8 and 9. Each thermocouple tree was installed near the grouped smoke-alarms and the smoke density meters, with thermocouples at heights of 1.22, 1.83 and 2.40 m above the floor (the top one was 40 mm below the ceiling).
2.5.1.4 Experimental procedure
Five experiments were conducted with fire origin in the ground floor bedroom and 4 experiments were conducted with fire origin in the living room. All windows were closed during each experiment. The experiment procedure was as follows:
1. Verification of experiment layout, instrumentation and data acquisition;
2. t = 0 (time zero), starting the electric power to the ignitor, starting the data acquisition system and collecting 2 min baseline data;
3. t = 2 minute, putting the fuel package on the ignitor and covering them with the perforated metal bucket; (except for the upholstered chair fire, see Test 9 section for Steps 2 and 3) 4. Observation of smoke movement and smoke-alarm response;
5. Sending personnel into the house to extinguish the fire and vent the room when all smoke-alarms actuate or at least 20 minute into the experiment; and
2.5.2 Results of Experiments in House BB-513
Sound levels of the smoke-alarms were measured at centre and waist height in
Bedroom 2, with the Bedroom-2 door closed. The results of sound intensity in decibel (dB) are listed in Table 2. Sound A are the values with the Bedroom-1 door open and Sound B are the values with the Bedroom-1 door closed.
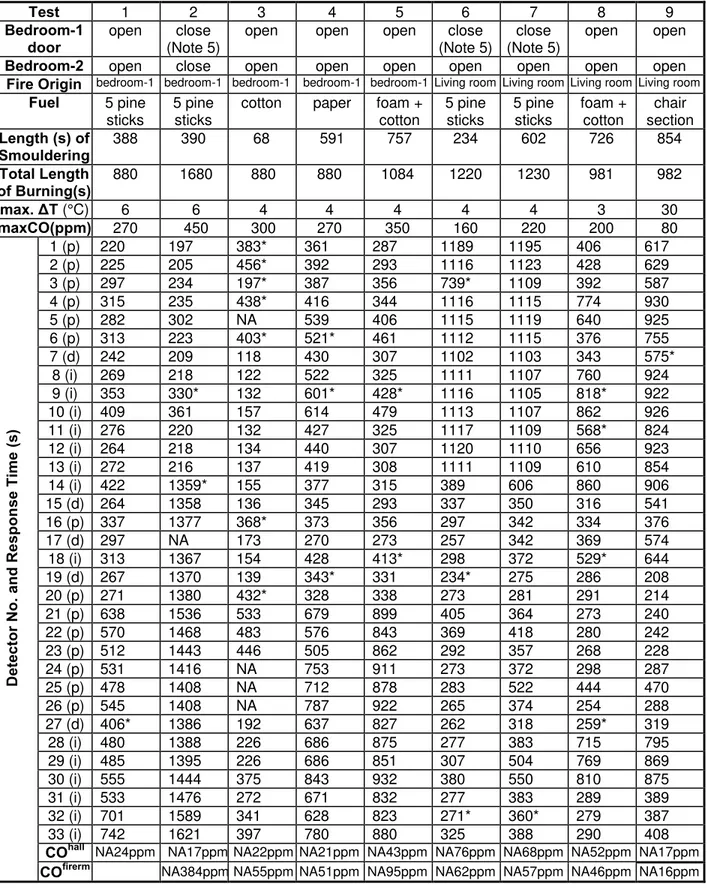
Table 3 shows results of the 9 experiments conducted in House BB-513, including the response of the smoke-alarms at various locations and the maximum change of temperature and CO concentration in the room of fire origin. All test fires started with a smouldering phase and then became a flaming fire. The length of the smouldering stage and the total length of smouldering plus flaming fire are listed in the table for each experiment. The response of the smoke-alarms is presented in the table with the activation time measured from ignition. Although the absolute values for the activation time are given, emphasis should be put on the relative values in order to draw useful conclusions that can be applied to other fire scenarios.
The CO detectors did not produce an alarm in any experiments but they registered the peak CO level that they detected during each experiment. The peak CO levels registered by the CO detectors are shown in the table (for example, NA384ppm; NA means not actuated).
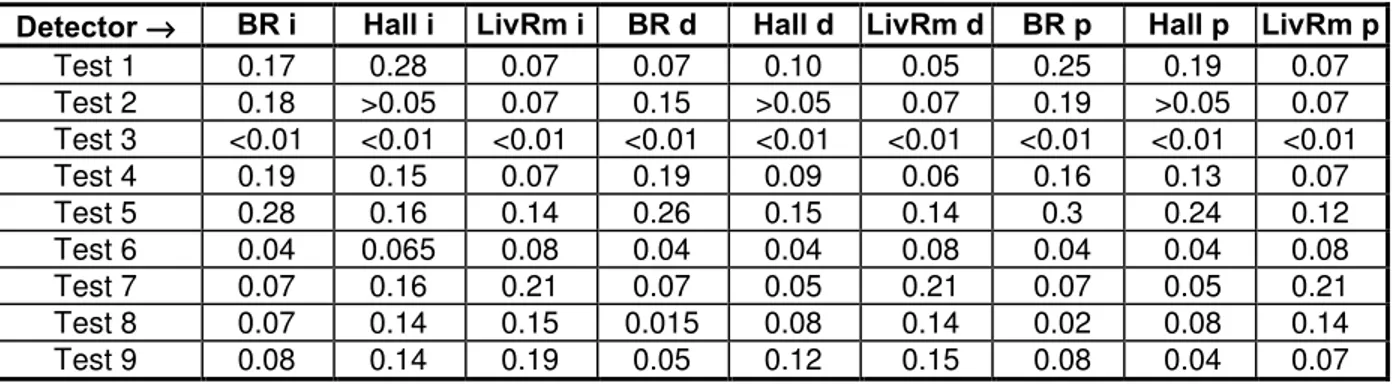
Figures 11-28 show profiles of temperatures at the fire source and on the thermocouple trees, optical densities near Detectors 6–8, 14–16 and 26–28, smoke-alarm response as well as the CO concentration during the fire experiments. Table 4 shows the optical densities of smoke adjacent to Detectors 6–8, 14–16 and 26–28 when these smoke-alarms actuated. Details of the results from each experiment are presented in the following sections.
2.5.2.1 Test 1
All bedroom doors were open throughout this experiment. The test fire was in
Bedroom 1, using the fuel package consisting of 5 pine sticks. After a 2-min baseline, the fuel package was put on the electrically-heated ignitor and covered by the perforated metal bucket with all holes open (this point is referred to as ignition hereafter). The fire started with
smouldering. Smoke came out from the top holes of the bucket approximately 150 s after the ignition and the 2 smoke density meters in the fire room started to detect smoke production. The 2 smoke density meters in the corridor outside the fire room started to detect the smoke approximately 190 s after the ignition. The 2 smoke density meters in the living room started to detect the smoke approximately 270 s after the ignition. The fire changed from smouldering to flaming 388 s after ignition. The total time of smouldering and flaming was 880 s.
During the smouldering period, the change of temperatures in the house was very small (less than 1°C increase even in the room of fire origin). The maximum temperature rise of 6°C occurred at the ceiling of Bedroom 1 during the flaming period.
The CO concentration measured at the door of Bedroom 1 was 270 ppm at maximum, with the concentration above 100 ppm for 10 minutes and above 200 ppm for 4 minutes. These concentration levels were not high enough nor lasted long enough to trigger the CO detector. The CO detector in the corridor only registered a 24-ppm peak CO level.
All smoke-alarms responded to the fire, with 18 smoke-alarms actuated during the smouldering stage and 15 smoke-alarms actuated during the flaming stage.
Except for Detectors I10 and I14, all smoke-alarms in the 2 bedrooms, corridor and foyer responded when the fire was at the smouldering stage. The 3 dual smoke-alarms in the fire room, corridor and foyer responded within 25 s of each other. An interesting observation was that the photoelectric smoke-alarm in the foyer (Detector P20) provided a fire alarm earlier than Detectors P6 (in the fire room) and P16 (in the corridor).
Detectors I10 and I14 and all living room smoke-alarms responded when the fire developed into the flaming stage. Detector I10 was the last actuated smoke-alarm in the fire room (Bedroom 1). It was mounted in the ceiling "dead air space". However, in the same "dead air space", the wall mounted Detector I11 was among the smoke-alarms giving the earliest warning. In the living room, the wall-mounted smoke-alarms (Detectors P23 and I31) in the "dead air space” had a shorter response time than the smoke-alarms (Detectors P22 and I32) on the wall within the acceptable height.
At the activation of those smoke-alarms that were directly adjacent to the
ceiling-mounted smoke density meters, the optical density of adjacent smoke was 0.07-0.28 m-1 for the ionization smoke-alarms, 0.05-0.10 m-1 for the dual smoke-alarms, and 0.07-0.25 m-1 for the photoelectric smoke-alarms. Visibility in the foyer and the living room observed by sight appeared to be sufficient for evacuation purposes throughout the experiment.
2.5.2.2 Test 2
The test fire originated in Bedroom 1, using the fuel package consisting of 5 pine sticks. After a 2-minute baseline, the fuel package was put on the electrically-heated ignitor and
covered by the perforated metal bucket with all holes open. The fire started with smouldering. Smoke came out from the top holes of the bucket approximately 130 s after the ignition and the 2 smoke density meters in the fire room started to detect smoke production. The fire changed from smouldering to flaming 390 s after ignition. The total time of smouldering and flaming was 1680 s.
This fire scenario was similar to the one used in Test 1. However, for Test 2, the door of Bedroom 1 was closed for the first 1353 s and was then opened (measured from ignition). The door of Bedroom 2 was closed throughout this experiment.
The fire did not affect temperatures in the corridor and living room until the door to Bedroom 1 was opened. The maximum temperature rise of 6°C occurred at the ceiling of Bedroom 1 during the flaming period and when the door was closed.
All 13 smoke-alarms in Bedroom 1 provided fire alarms when the fire was still at the smouldering stage. The 6 wall-mounted smoke-alarms (Detectors P1-3 and I11-13) and the ceiling mounted photoelectric smoke-alarm (Detector P4) responded to the smouldering fire at times comparable to the 3 ceiling smoke-alarms (Detectors P6, 7 and I8) at the centre of the room, indicating no effect of the "dead air space". The ceiling Detector I10, however, did have a slower response, an indicator of the "dead air space" effect.
With the door of the room of fire origin closed, the smoke-alarms and the smoke density meters in the corridor and the living room did not detect the smoke and fire. There was no visible smoke in the hallway and living room before opening the bedroom door. After the fire
room door was opened, all smoke-alarms in the corridor and the living room responded to the fire. Smoke was observed in the living room 24 s after the door was opened. The
ceiling-mounted smoke-alarms provided a quicker fire alarm than the wall-mounted
smoke-alarms in the living room. However, there was no obvious evidence of the "dead air space" effect.
At the activation of those smoke-alarms that were directly adjacent to the
ceiling-mounted smoke density meters, the optical density of adjacent smoke was 0.07-0.18 m-1 for the ionization smoke-alarms, 0.07-0.15 m-1 for the dual smoke-alarms, and 0.07-0.19 m-1 for the photoelectric smoke-alarms. The observed visibility in the foyer and the living room
appeared to be sufficient for evacuation purposes throughout the experiment.
The smoke-alarm in Bedroom 2 (Detector 17) did not respond to the fire since the door of Bedroom 2 was closed throughout this experiment. The CO detectors did not produce an alarm. The maximum CO concentration measured at the door of Bedroom 1 was 450 ppm, with the concentration above 100 ppm for 4 minutes, above 200 ppm for 2 minutes, and above 400 ppm for 1 minute. These concentration levels were not high enough nor lasted long enough to trigger the CO detectors. The CO detectors registered a 384-ppm peak CO level in the fire room and a 17-ppm peak CO level in the corridor.
2.5.2.3 Test 3
All bedroom doors were open throughout this experiment. The test fire was in
Bedroom 1, using the fuel package of cotton flannel. After a 2-min baseline, the fuel package was put on the electrically-heated ignitor and covered by the perforated metal bucket with all holes open. The fire started with smouldering but quickly changed to flaming approximately 70 s after ignition. The total time of smouldering and flaming was 880 s. The change of temperatures in the house was very small. The maximum temperature rise of 4°C occurred at the ceiling of Bedroom 1 and in the corridor during the flaming period.
The maximum CO concentration measured at the door of Bedroom 1 was 300 ppm, with the concentration above 100 ppm for 9 minutes and above 200 ppm for 3 minutes. These concentration levels were not high enough nor did they last long enough to trigger the CO detectors. The CO detectors registered a 55-ppm peak CO level in the fire room and a 22-ppm peak CO level in the corridor.
Except for 4 photoelectric smoke-alarms (Detectors P5, P24-26), all 29 smoke-alarms in the 2 bedrooms, corridor, foyer and living room responded to the flaming fire. At the activation of the smoke-alarms that were directly adjacent to the ceiling-mounted smoke density meters, the optical density of adjacent smoke was less than 0.01 m-1. Throughout the experiment, there was hardly any visible smoke by sight in the house. The optical density never exceeded
0.014 m-1 in the house at the 6 measurement points. Although the optical density adjacent to Detectors P5, P24 and P25 was not measured, the low optical density values in the centre of each room explained why Detectors P5 and P24-26 did not actuate (their normal sensitivity was 0.030 + 0.019 m-1 or 2.06 + 1.30 % per foot).
The response of the ionization and dual smoke-alarms were comparable to the flaming fire, with the dual smoke-alarms slightly quicker than the ionization smoke-alarms at the same locations. With the fire room door open, the time difference between the first smoke-alarm activation in the fire room and the living room was 74 s. The photoelectric smoke-alarms, which
did actuate during the experiment, gave a slower response to the flaming fire than did the ionization and dual smoke-alarms.
The wall-mounted photoelectric smoke-alarms provided better response than the
ceiling-mounted photoelectric smoke-alarms in both the living room and Bedroom 1. The 2-wall mounted photoelectric smoke-alarms in the "dead air space" (Detectors P3 and P23) were the first of this type in each room to respond to the fire. The 2-wall mounted ionization
smoke-alarms in the "dead air space" (Detectors I11 and I31) were among the first in each room to respond to the fire.
2.5.2.4 Test 4
All bedroom doors were open throughout this experiment. The test fire was in
Bedroom 1, using the fuel package consisting of newspaper. After a 2-min baseline, the fuel package was put on the electrically-heated ignitor and covered by the perforated metal bucket with all holes open. The fire started with smouldering. Smoke came out from the top holes of the bucket approximately 130 s after the ignition. The fire changed from smouldering to flaming 591 s after ignition. The total time of smouldering and flaming was 880 s.
During the smouldering period, the change of temperatures in the house was very small (less than 1°C increase even in the room of fire origin). The maximum temperature rise of 4°C occurred at the ceiling of Bedroom 1 at the end of the experiment.
The maximum CO concentration measured at the door of Bedroom 1 was 270 ppm, with the concentration above 100 ppm for 8 minutes and above 200 ppm for 4 minutes. These concentration levels were not high enough nor did they last long enough to trigger the CO detectors. The CO detectors registered a 51-ppm peak CO level in the fire room and a 21-ppm peak CO level in the corridor.
All smoke-alarms responded to the fire, with 20 smoke-alarms actuated during the smouldering stage and 13 smoke-alarms actuated during the flaming stage. It was interesting to observe that the smoke-alarm in Bedroom 2 (Detector 17) was the first smoke-alarm to detect the fire that originated in Bedroom 1 and that the smoke-alarms in the corridor and foyer
detected the fire earlier than the smoke-alarms (of the same type) in the room of fire origin. The optical density measurements also showed that the smoke density meters in the corridor
detected the smoke first.
Looking at the activation times of the smoke-alarms in the living room and Bedroom 1, there was no significant delay in response time for the smoke-alarms installed in the "dead air spaces". In fact, Detectors P3, P4 and I11 were among the first in Bedroom 1 and Detectors P23 and I31 were among the first in the living room to detect the fire.
At the activation of those smoke-alarms that were directly adjacent to the
ceiling-mounted smoke density meters, the optical density of adjacent smoke was 0.07-0.19 m-1 for the ionization smoke-alarms, 0.06-0.19 m-1 for the dual smoke-alarms, and 0.07-0.16 m-1 for the photoelectric smoke-alarms. The observed visibility in the corridor, foyer and living room appeared to be sufficient for evacuation purposes throughout the experiment.
2.5.2.5 Test 5
All bedroom doors were open in this experiment. The test fire was in Bedroom 1, using the fuel package consisting of polyurethane foam wrapped with cotton flannel (simulating a mattress and bedding). After a 2-min baseline, the fuel package was put on the electrically heated ignitor and covered by the perforated metal bucket with all holes open. The fire started with smouldering. Smoke came out from the top holes of the bucket and the 2 smoke density meters in the fire room started to detect smoke production approximately 220 s after ignition. The fire changed from smouldering to flaming 757 s after ignition. The total time of smouldering and flaming was 1084 s.
During the smouldering period, the change of temperature in the house was very small (less than 2°C increase even in the room of fire origin). The maximum temperature rise of 4°C occurred at the ceiling of Bedroom 1 during the flaming period.
The maximum CO concentration measured at the door of Bedroom 1 was 350 ppm, with the concentration above 100 ppm for 13 minutes and above 200 ppm for 10 minutes. These concentration levels were not high enough nor did they last long enough to trigger the CO detectors. The CO detectors registered a 95-ppm peak CO level in the fire room and a 43-ppm peak CO level in the corridor.
All smoke-alarms responded to the fire, with 20 smoke-alarms (in the bedrooms, corridor and foyer) actuated during the smouldering stage and 13 smoke-alarms (in the living room) actuated during the flaming stage. Again, it was interesting to observe that the smoke-alarm in Bedroom 2 (Detector 17) was the first to detect the fire that originated in Bedroom 1. The smoke-alarms in the corridor (Detectors P16, 15 and I14) detected the smouldering fire earlier than the central smoke-alarms in the room of fire origin (Detectors P6, 7 and I8, respectively). The differences in activation time between the living room smoke-alarms and Detectors 1-20 were longer in Test 5 than those in Tests 1, 3 and 4.
The optical density measurement also showed that the smoke density meters in the corridor detected smoke first. It also showed that time differences between the smoke density meters detecting the first appearance of smoke in the living room and in Bedroom 1 were longer in Test 5 than those in Tests 1, 3 and 4. At the activation of those smoke-alarms that were directly adjacent to the ceiling-mounted smoke density meters, the optical density of adjacent smoke was 0.14-0.28 m-1 for the ionization smoke-alarms, 0.14-0.26 m-1 for the dual
smoke-alarms, and 0.12-0.30 m-1 for the photoelectric smoke-alarms. The observed visibility in the foyer and the living room appeared to be sufficient for evacuation purposes throughout the experiment.
In both the living room and Bedroom 1, there was no significant delay in response time for the smoke-alarms installed in the "dead air spaces". In fact, Detectors P3, P4 and I11 were among the first in Bedroom 1 to detect the fire and all living room smoke-alarms responded in a similar time frame.
2.5.2.6 Test 6
The test fire was in the living room, using the fuel package consisting of 5 pine sticks. After a 2-minute baseline, the fuel package was put on the electrically-heated ignitor and covered by the perforated metal bucket with all holes open. The fire started with smouldering.
The fire changed from smouldering to flaming 234 s after ignition. The total time of smouldering and flaming was 1220 s. The maximum temperature rise at the ceiling of the living room was 4°C during the flaming period.
The door of Bedroom 1 was closed for the first 1080 s (measured from ignition) and was then opened. The door of Bedroom 2 was open throughout this experiment.
The first smoke-alarm that responded to the fire was the dual smoke-alarm in the foyer (Detector 19) while the fire was still in the smouldering stage. All other smoke-alarms
responded to the fire during the flaming stage. The dual smoke-alarm in Bedroom 2 (Detector 17) was the second actuated smoke-alarm. Except for Detector P3, all smoke-alarms in
Bedroom 1 did not respond to the fire until the door was opened. Detector P3 responded to the fire when the Bedroom 1 door was still closed, with the alarm going on and off a few times.
In the living room and Bedroom 1, the smoke-alarms installed in the "dead air spaces" were among the first in each room to provide a fire alarm, showing no obvious evidence of the "dead air space" effect.
At the activation of those smoke-alarms that were directly adjacent to the
ceiling-mounted smoke density meters, the optical density of adjacent smoke was 0.04-0.08 m-1 for all 3 types of smoke-alarms. The observed visibility in the house appeared to be sufficient for evacuation purposes throughout the experiment.
The CO detectors did not produce an alarm. The maximum CO concentration measured at the entrance of the living room was 160 ppm, with the concentration above 100 ppm for 4 minutes. These concentration levels were not high enough nor did they last long enough to trigger the CO detectors. The CO detectors registered a 62-ppm peak CO level in the fire room and a 76-ppm peak CO level in the corridor.
2.5.2.7 Test 7
The test fire was in the living room, using the fuel package consisting of 5 pine sticks. After a 2-minute baseline, the fuel package was put on the electrically-heated ignitor and covered by the perforated metal bucket. The fire started with smouldering. This experiment used the same fire scenario as the one used in Test 6, except that the holes around the metal bucket were sealed to limit the amount of air and lengthen the smouldering period. Smoke came out from the holes on the top of the metal bucket. The fire changed from smouldering to flaming 602 s after ignition. The total time of smouldering and flaming was 1230 s. The maximum temperature rise at the ceiling of the living room was 4°C during the flaming period.
The door of Bedroom 1 was closed from the beginning for the first 1080 s (measured from ignition) and was then opened. The door of Bedroom 2 was open throughout this experiment.
All smoke-alarms in the living room, foyer, corridor and Bedroom 2 responded to the fire during the smouldering stage. The foyer detector group was the first that responded to the fire (Detectors I18, 19 and P20). All smoke-alarms in Bedroom 1 did not respond to the fire until the door was opened. There was no significant delay in response time for the smoke-alarms
installed in the "dead air spaces". In fact, all smoke-alarms in Bedroom 1 responded to the fire in the same time frame and Detectors P23, P24 and I31 were among the first in the living room
to detect the fire.
At the activation of those smoke-alarms that were directly adjacent to the
ceiling-mounted smoke density meters, the optical density of adjacent smoke was 0.07-0.21 m-1 for the ionization smoke-alarms and 0.05-0.21 m-1 for the dual and photoelectric smoke-alarms. The observed visibility in the house appeared to be sufficient for evacuation throughout the experiment.
The CO detectors did not produce an alarm. The maximum CO concentration measured at the entrance of the living room was 220 ppm, with the concentration above 100 ppm for 9 minutes and above 200 ppm for 2 minutes. The concentration levels were not high enough nor did they last long enough to trigger the CO detectors. The CO detectors registered a 57-ppm peak CO level in the fire room and a 68-ppm peak CO level in the corridor.
2.5.2.8 Test 8
All bedroom doors were open throughout this experiment. The test fire was in the living room, using the fuel package consisting of polyurethane foam wrapped with cotton flannel (simulating upholstered furniture). After a 2-minute baseline, the fuel package was put on the electrically-heated ignitor and covered by the perforated metal bucket. The fire started with smouldering. The fire changed from smouldering to flaming 726 s after ignition. The total time of smouldering and flaming was 981 s. The maximum temperature rise at the ceiling of the living room was 3°C at the end of the experiment.
All smoke-alarms responded to the fire, with 26 smoke-alarms actuated during the smouldering stage and 7 smoke-alarms actuated during the flaming stage. Within each group of smoke-alarms (Detectors 6-8, Detectors 14-16, Detectors 18-20 and Detector 26-28), the dual smoke-alarm and the photoelectric smoke-alarm actuated in a similar time frame. The ionization smoke-alarm at the same position took twice as long to actuate. The difference in activation time of the same type of smoke-alarms in different groups was relatively small
(compared to the difference between the ionization and photoelectric smoke-alarms in the same group). This indicated that the type of smoke-alarms had a larger impact on smoke-alarm response than the number or general location of the smoke-alarms in this experiment.
The smoke-alarms mounted at the top of the walls were among the first to provide a fire alarm in the living room and Bedroom 1. There was no significant delay in response time for the smoke-alarms installed in the ceiling "dead air spaces" and no obvious evidence of the "dead air space" effect.
At the activation of those smoke-alarms that were directly adjacent to the
ceiling-mounted smoke density meters, the optical density of adjacent smoke was 0.07-0.15 m-1 for the ionization smoke-alarms, 0.015-0.14 m-1 for the dual smoke-alarms and 0.02-0.14 m-1 for the photoelectric smoke-alarms. The observed visibility in the house appeared to be sufficient for evacuation purposes throughout the experiment.
The CO detectors did not produce an alarm. The maximum CO concentration measured at the entrance of the living room was 200 ppm, with the concentration above 100 ppm for 6 minutes and at 200 ppm for 2 minutes. The concentration levels were not high enough nor did they last long enough to trigger the CO detectors. The CO detectors registered a 46-ppm peak CO level in the fire room and a 52-ppm peak CO level in the corridor.
2.5.2.9 Test 9
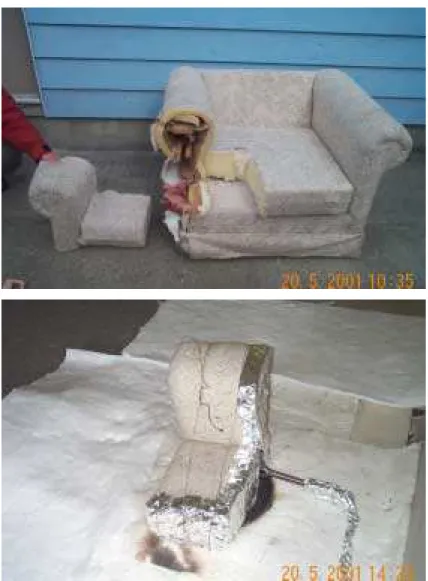
The test fire was in the living room, using a section of an upholstered chair as the fuel (shown in Figure 4). This fuel package had a cushion piece of 0.20 m x 0.30 m x 0.15 m and an arm piece of 0.35 m x 0.30 m x 0.12 m (with a 0.20 m diameter at the armrest). All bedroom doors were open throughout this experiment.
The ignitor was inserted between the cushion and arm at time zero. After a 2-minute baseline, the electrical power to the ignitor was turned on. The fire started with smouldering. In order to control the fire development, the power to the ignitor was turned on and off alternately. The fire was kept in the smouldering mode for 854 s and then changed to flaming. The flame grew to 1.8 m high at one point. The maximum temperature rise at the ceiling of the living room was 30°C. The total time of smouldering and flaming was 982 s.
All smoke-alarms responded to the fire, with 24 smoke-alarms actuated during the smouldering stage and 9 smoke-alarms actuated during the flaming stage. The foyer detector group (Detectors 18-20) produced the quickest response. In each detector group, the ionization smoke-alarm always actuated slower than the dual and photoelectric smoke-alarms at the same position. This indicated that the smoke-alarm type and location had an impact on smoke-alarm response.
In the living room and Bedroom 1, the wall-mounted smoke-alarms always gave quicker response than the ceiling-mounted smoke-alarms (of the same type); the smoke-alarms at the top of the walls (in "dead air spaces") were always among the first (of the same type) to provide a fire alarm. There was no significant delay in response time for the ceiling smoke-alarms installed inside and outside the "dead air spaces" and no obvious evidence of the "dead air space" effect.
At the activation of those smoke-alarms that were directly adjacent to the
ceiling-mounted smoke density meters, the optical density of adjacent smoke was 0.08-0.19 m-1 for the ionization smoke-alarms, 0.05-0.15 m-1 for the dual smoke-alarms and 0.04-0.08 m-1 for the photoelectric smoke-alarms. The observed visibility in the house appeared to be sufficient for evacuation purposes throughout the experiment.
The CO detectors did not produce an alarm. The maximum CO concentration measured at the entrance of the living room was 80 ppm, which was not high enough to trigger the CO detectors. The CO detectors registered a 16-ppm peak CO level in the fire room and a 17-ppm peak CO level in the corridor.
2.6 Experiments in House K1-106
The second round of 4 fire detection experiments was conducted in the 2-storey single family house (K1-106) with fires located in the ground floor living room and kitchen. A total of 20 smoke-alarms were installed on the ground and second floors, including 5 photoelectric smoke-alarms, 8 ionization smoke-alarms, 5 dual (combination ionization-photoelectric) smoke-alarms, and 2 carbon monoxide detectors.
2.6.1 Experimental Set-up in House K1-106
Figures 29-30 show a plan view of floor layout, fire locations, smoke-alarms, CO
detectors and measurement devices installed in House K1-106. Figure 31 is a snapshot of the experiment set-up in House K1-106.
The ground floor had a 2.50 m high ceiling and a 0.53 m lintel in the dining room and kitchen. The second floor had a 2.44 m high ceiling and a 0.48 m lintel above the bedroom doors. The staircase landing area had a 3.04 m high ceiling.
Table 5 shows a cross-reference of all smoke-alarms and measurement devices in House K1-106 and in the data acquisition system. Similarly, Data Column and Data Channel are the virtual locations of smoke-alarms or devices in the data system. Detector Marker is the shipping label on each smoke-alarm. Detector No. is the smoke-alarm identifier used for all the drawings and figures in this report. In Figures 29-31, each ionization smoke-alarm is labelled with an "I" in front of its Detector No.; each photoelectric smoke-alarm is labelled with a "P" in front of its Detector No.; each dual smoke-alarm is labelled with its Detector No. only.
2.6.1.1 Smoke-alarm positioning
Smoke-alarms were installed in various locations (including code-required locations) on both the ground and second floors in order to study the effect of number, type and location of smoke-alarms on their response time.
Five groups of smoke-alarms were installed at the ceiling of the living room (labelled as I1, 2, P3; I4, 5, P6), staircase landing (labelled as I7, 8, P9), and 2nd floor corridor (labelled as I10, 11, P12; I13, 14, P15). Each detector group included an ionization smoke-alarm, a
photoelectric smoke-alarm and a dual smoke-alarm, spaced 305 mm from each other (centre to centre). The five groups produced comparative data for smoke-alarms in these general
locations and also provided comparative data for different smoke-alarm types.
An ionization smoke-alarm was installed at the ceiling of every bedroom (labelled as I16, I17, I18). CO detectors were installed at a 0.53 m height on the ground floor wall adjacent to the staircase and at the ceiling in Bedroom 3.
2.6.1.2 Optical density measurement
Smoke optical density was measured as a function of time using 6 smoke density meters at 3 locations (in the living room, staircase landing, and 2nd floor corridor), as shown in
Figures 29-31. Each location had 2 measurement points, one at the ceiling height (150 mm below the ceiling, very close to the grouped smoke-alarms) and the other at eye height (1.68 m above the floor).
2.6.1.2 Carbon monoxide measurement
The CO concentration was measured using the gas analyzer. The gas sampling port was 1.7 m high at the entrance of the ground floor staircase.
2.6.1.3 Temperature measurement
A thermocouple was placed at the fire source (at the smoke exit holes when the metal bucket was used) to monitor fire development. Another thermocouple was placed underneath ceramic film insulation that protected the floor.
Temperatures in the living room, kitchen, staircase landing and 2nd floor corridor were measured using 6 thermocouple trees, as shown in Figures 29-31. Each thermocouple tree was installed near the grouped smoke-alarms and the smoke density meters. Each of the ground floor TC trees had 3 thermocouples located 1.22, 1.83 and 2.46 m above the floor (the top thermocouple was 40 mm below the ceiling). Each of the landing and 2nd floor TC trees had 2 thermocouples located 40 and 600 mm below the ceiling.
2.6.1.4 Experimental procedure
Three experiments were conducted with the fire in the living room and 1 experiment was conducted with the fire in the kitchen. All windows were closed during each experiment. The experiment procedure was as follows:
1. Verification of experiment layout, instrumentation and data acquisition;
2. t = 0 (time zero), starting the electric power to the ignitor, starting the data acquisition system and collecting 2 min baseline data;
3. t = 2 minute, putting the fuel package on the ignitor and covering them with the perforated metal bucket; (except for the cooking oil fire, see Test 12 section for Steps 2 and 3) 4. Observation of smoke movement and smoke-alarm response;
5. Sending personnel into the house to extinguish the fire and vent the room when all smoke-alarms actuate or at least 35 minutes into the experiment; and
6. Ending the experiment.
2.6.2 Results of Experiments in House K1-106
Sound levels of the smoke-alarms were measured at the centre of Bedroom 1 and waist height, with Bedroom-1 door closed and all other room doors open. The results are listed in Table 5.
All bedroom doors were open during the 4 fire experiments in House K1-106. Table 6 shows results of the 4 experiments conducted in House K1-106, including the response of the smoke-alarms at various locations and the maximum change of temperature and CO
concentration in the room of fire origin. All test fires started with smouldering and then became flaming. The length of the smouldering stage and the total length of smouldering plus flaming are listed in the table for each experiment. The response of the smoke-alarms is presented in the table with the activation time from ignition. Although the absolute values for the activation time are given, emphasis should be put on the relative values in order to draw useful
conclusions that can be applied to other fire scenarios.
The CO detectors did not produce an alarm in any experiments but they registered the peak CO level that they detected during each experiment. The peak CO levels registered by the CO detectors are shown in the table (for example, NA77 ppm; NA means not actuated).
Figures 32-39 show profiles of temperatures at the fire source and the thermocouple trees, optical densities near Detectors 4–6, 7–9 and 10–12, smoke-alarm response as well as the CO concentration during the fire experiments. Table 7 shows the optical densities of smoke adjacent to Detectors 4–6, 7–9 and 10–12 when these smoke-alarms actuated. Details of the results from each experiment are presented in the following sections.
2.6.2.1 Test 10
The test fire was in the living room, using the fuel package consisting of 10 pine sticks. After a 2-minute baseline, the fuel package was put on the electrically-heated ignitor and covered by the perforated metal bucket. The fire started with smouldering. The holes around the lower part of the metal bucket were sealed to limit the amount of air to keep the fire smouldering. Smoke came out from the holes on the top of the metal bucket approximately 200 s after ignition. The optical density measurements indicated that smoke moved fairly quickly to the second floor. After the ground floor smoke density meters detected smoke production, the 2nd floor smoke density meters started to detect smoke within 1 minute. The metal bucket was taken off from the fuel 2710 s after ignition. The fire changed from
smouldering to flaming 2744 s after ignition. The total time of smouldering and flaming was 2880 s.
During the smouldering period, the change of temperatures in the house was very small (less than 1°C increase even in the room of fire origin). The maximum temperature rise at the ceiling of the living room was 10°C during the flaming period.
All smoke-alarms responded to the fire, with 17 smoke-alarms actuated during the smouldering stage and 1 ionization smoke-alarm actuated during the flaming stage. At each location, the ionization smoke-alarm always responded to the smouldering fire slower than the adjacent dual and photoelectric smoke-alarms. The dual and photoelectric smoke-alarms performed similarly at the same location.
It was interesting to observe that the ionization smoke-alarms in the 3 bedrooms responded to the fire at times much earlier than the ionization smoke-alarms in the 2nd floor hallway and staircase landing. The smoke-alarm in Bedroom 2 (Detector I18) actuated at the same time as Detector I4 downstairs.
At the activation of those smoke-alarms that were directly adjacent to the
ceiling-mounted smoke density meters, the optical density of adjacent smoke was 0.08-0.15 m-1 for the ionization smoke-alarms, 0.03-0.11 m-1 for the dual smoke-alarms, and 0.02-0.11 m-1 for the photoelectric smoke-alarms. The observed visibility in the house appeared to be sufficient for evacuation purposes throughout the experiment.
The maximum CO concentration measured at the ground floor staircase was
approximately 100 ppm. The CO detectors did not actuate but registered a 77-ppm peak CO level near the staircase on the ground floor and a 66-ppm peak CO level at the ceiling of Bedroom 3 on the second floor. The ceiling CO detector in Bedroom 3 displayed a 33 ppm CO level when the adjacent smoke-alarm activated.
2.6.2.2 Test 11
The test fire was in the living room, using the fuel package consisting of polyurethane foam wrapped with cotton flannel (simulating upholstered furniture). After a 2-minute baseline, the fuel package was put on the electrically-heated ignitor and covered by the perforated metal bucket. The fire started with smouldering. The holes around the lower part of the metal bucket were sealed to limit the amount of air to keep the fire smouldering. Smoke came out from the holes on the top of the metal bucket approximately 240 s after ignition.
The optical density measurement indicated that smoke moved fairly quickly to the second floor. After the ground floor smoke density meters detected smoke production, the 2nd floor smoke density meters started to detect smoke within 1 minute. Note that the sharp spikes in the optical density signals were due to 2 power interruptions to the smoke density meters caused by a bad connection of an extension cord.
The metal bucket was taken off from the fuel approximately 1640 s after ignition. The fire changed from smouldering to flaming 1674 s after ignition. The total time of smouldering and flaming was 1980 s. During the smouldering period, the change of temperatures in the house was very small (less than 1°C increase even in the room of fire origin). The maximum temperature rise at the ceiling of the living room was 4°C during the flaming period.
All the dual and photoelectric smoke-alarms responded to the fire during the smouldering stage. At each location, the dual and photoelectric smoke-alarms performed similarly and responded to the fire much earlier than the ionization smoke-alarm. Two ionization smoke-alarms on the 2nd floor (Detectors I13 and I17) did not actuate. There was no visible smoke (observed by sight) on the 2nd floor throughout the experiment. The other 6 ionization smoke-alarms actuated near the end of the experiment when the fire changed to the flaming mode.
The maximum smoke optical density was 0.16 m-1 on the ground floor, 0.08 m-1 at the staircase landing, and 0.07 m-1 on the second floor. At the activation of those smoke-alarms that were directly adjacent to the ceiling-mounted smoke density meters, the optical density of adjacent smoke was 0.06-0.10 m-1 for the ionization smoke-alarms, 0.02-0.13 m-1 for the dual smoke-alarms, and 0.02-0.11 m-1 for the photoelectric smoke-alarms. The observed visibility in the house appeared to be sufficient for evacuation purposes throughout the experiment.
The maximum CO concentration measured at the ground floor staircase was 140 ppm, with the concentration above 100 ppm for 7 minutes. The concentration levels were not high enough nor did they last long enough to trigger the CO detectors. The CO detectors did not actuate but registered a 72-ppm peak CO level near the staircase on the ground floor and a 53-ppm peak CO level at the ceiling of Bedroom 3 on the second floor. The CO level display on the ceiling CO detector in Bedroom 3 was 40 ppm when the adjacent smoke-alarm activated.
2.6.2.3 Test 12
The test fire was in the kitchen, using cooking oil as the fuel (shown in Figure 5). The ignitor was immersed in 450 mL cooking oil in the cooking pan. The electrical power to the ignitor was turned on at time zero. The fire smouldered slowly. In order to accelerate fire development, a mixture of 25% toluene and 75% heptane was added to the oil pan at 1530, 1680 and 1960 s (each addition was 10 mL). These resulted in temperature spikes measured
by the target thermocouple (Figure 36). After each of the first 2 additions of the accelerant, the fire changed to flaming for a short period and then became smouldering again. Only after the 3rd addition of the accelerant, the fire sustained flaming. The fire development, therefore, had 3 flaming periods. The 1st and 2nd flaming periods were very short and the 3rd flaming period was sustained burning. The total time of smouldering and flaming was 2400 s (the fire was put out using a fire blanket at the end of the experiment). The maximum temperature rise at the ceiling of the kitchen was 38°C during the last flaming period.
Before the 3rd flaming period, the optical density was less than 0.02 m-1 at the ground floor measurement points and less than 0.01 m-1 at the staircase and 2nd floor measurement points. After the start of the 3rd flaming period, smoke moved fairly quickly to the second floor.
During the smouldering period (before the 1st flaming period), only 1 smoke-alarm (Detector 5) responded to the smoke. All other smoke-alarms did not actuate until the fire became flaming. This is desirable since smouldering cooking oil often represents a common nuisance source. Five smoke-alarms responded to the flaming fire during the 1st and 2nd flaming periods. The 12 remaining smoke-alarms responded to the flaming fire during the 3rd flaming period. For the flaming cooking oil, there was very little difference in the response time between the ionization and photoelectric smoke-alarms at each location while the dual
smoke-alarm responded to the flaming fire earlier than both the ionization and photoelectric smoke-alarms.
The fact that Detector 5 was the only one actuated during the smouldering period suggested that the sensitivity of this dual smoke-alarm as well as the ionization and
photoelectric smoke-alarms need to be determined. Without determination of their sensitivity, it is hard to determine whether this dual smoke-alarm was more sensitive or more prone to the cooking oil nuisance source than the ionization and photoelectric smoke-alarms.
At the activation of those smoke-alarms that were directly adjacent to the ceiling-mounted smoke density meters, the optical density of adjacent smoke was
0.014-0.03 m-1 for the ionization smoke-alarms, 0.008-0.01 m-1 for the dual smoke-alarms, and 0.014-0.015 m-1 for the photoelectric smoke-alarms. The observed visibility in the house appeared to be sufficient for evacuation purposes throughout the experiment. There was very little visible smoke in the three bedrooms (observed by sight) when the bedroom smoke-alarms actuated to the flaming fire.
The maximum CO concentration measured at the ground floor staircase was 30 ppm, which was not high enough to trigger the CO detectors. The CO detectors registered a 21-ppm peak CO level near the staircase on the ground floor and an 11-ppm peak CO level at the ceiling of Bedroom 3 on the second floor.
2.6.2.4 Test 13
The test fire was in the living room, using the fuel package consisting of newspaper (20 sheets). After a 2-minute baseline, the fuel package was put on the electrically-heated ignitor and covered by the perforated metal bucket. The fire started with smouldering. Smoke came out from the holes on top of the metal bucket approximately 160 s after ignition. In order to keep the fire smouldering, the holes around the lower part of the metal bucket were sealed to limit the amount of air from the beginning of the experiment.
All dual and photoelectric smoke-alarms on both floors responded relatively early to the smouldering fire. All ionization smoke-alarms actuated at much later times. At around 3000 s after ignition, 3 holes around the lower part of the metal bucket were opened to allow more air to enter the bucket and to increase the smoke production rate, indicated in Figure 39 by the
increase of smoke optical density. Shortly after this, the ionization smoke-alarms on the ground floor and in the 3 bedrooms upstairs actuated at almost the same time. The 2 ionization
smoke-alarms in the 2nd floor corridor (Detector I7) and the staircase landing (Detector I10) actuated later than the bedroom smoke-alarms, with the alarm going on and off a few times.
Detector I13 in the 2nd floor corridor did not actuate until the fire became flaming. The metal bucket was taken off from the fuel 4794 s after ignition and then the fire changed from smouldering to flaming. Detector I13 only provided a short alarm and then silenced as shown in Figure 39.
During the experiment, the change of temperature in the house was very small. The maximum temperature rise at the ceiling of the living room was 3°C during the flaming period. The total time of smouldering and flaming was 5080 s.
At the activation of those smoke-alarms that were directly adjacent to the
ceiling-mounted smoke density meters, the optical density of adjacent smoke was 0.08-0.09 m-1 for the ionization smoke-alarms, 0.03-0.08 m-1 for the dual smoke-alarms, and 0.015-0.07 m-1 for the photoelectric smoke-alarms. The observed visibility in the house appeared to be sufficient for evacuation purposes throughout the experiment.
The maximum CO concentration measured at the ground floor staircase was 220 ppm, with the concentration above 100 ppm for 40 minutes and above 200 ppm for 1 minute. The concentration levels were not high enough nor did they last long enough to trigger the CO detectors. Although the CO detectors did not actuate, they registered a 152-ppm peak CO level near the staircase on the ground floor and a 132-ppm peak CO level at the ceiling of Bedroom 3 on the second floor.
3.0 DISCUSSION
All test fires in the experiments were limited to small sizes with slow growth rates in order to provide the greatest challenges to the operation of smoke-alarms. Although all test fires started with smouldering then developed into flaming, the length of the smouldering stage was dependent on type and quantity of fuel and amount of available air. The absolute activation times of various smoke-alarms obtained only apply under the experimental conditions of this test program. In order to draw useful conclusions from these experiments that can be applied to other fire scenarios, the following discussion focuses on the relative activation times of the smoke-alarms as well as associate optical densities at their activation.
3.1 Optical Density at Smoke-Alarm Activation
From Tables 4 and 7, it appears that the smoke-alarms in the room of fire origin actuate at higher optical densities than the smoke-alarms in the areas remote from the fire. However, one can see from the optical density profiles that the optical density in the room of fire origin changes much faster than those in the areas remote from the fire. In many cases, it is difficult to make an unambiguous determination of the optical density at which a smoke-alarm actuated
![Figure 11. Temperatures at fire source and on TC trees in bedroom, corridor and living room during Test 1 Time [s]020040060080010001200Temperature [oC]-50501502503504505506500100200300400500600700](https://thumb-eu.123doks.com/thumbv2/123doknet/14194825.478843/46.1188.655.1084.130.437/figure-temperatures-source-trees-bedroom-corridor-living-temperature.webp)
